Ichimoku with MACD/ CMF/ TSIThis is a very powerful trend strategy designed for markets such as stocks market , stock index and crypto.
For time frames I found out that 1h seems to do the trick.
Components:
Ichimoku full pack
MACD histogram
CMF oscillator
TSI oscillator
Rules for entry
Long :
For Ichimoku:Tenkan part of cloud is bigger than kijun, Chikou is above 0 , close of a candle is above the Senkou
MACD histogram is above 0
CMF oscillator is positive and bigger than 0.1
TSI oscillator is above 0
Short:
For Ichimoku:Tenkan part of cloud is smaller than kijun, Chikou is below 0 , close of a candle is belowthe Senkou
MACD histogram is below 0
CMF oscillator is negative and below -0.1
TSI oscillator is below 0
Rules for exit
This strategy does not have any risk management inside. Instead it exits whenver it receives an opposite signal form the original one used for entry.
If you have any questions let me know !
Nasdaq

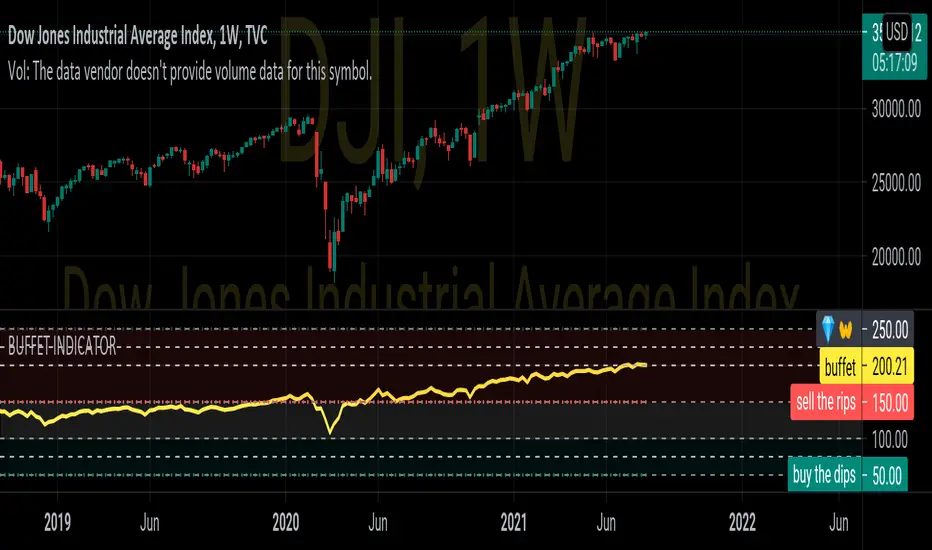
BUFFET INDICATORDISCRIPTION
The stock market cap to GDP ratio has become known as the Buffett Indicator in recent years, as Warren Buffett commented that he believes it is “probably the best single measure of where valuations stand at any given moment.”
CALCULATION
100*VALUE OF ALL STOCKS IN COUNTRY/GDP OF COUNTRY
100*wilshire5000/gdp
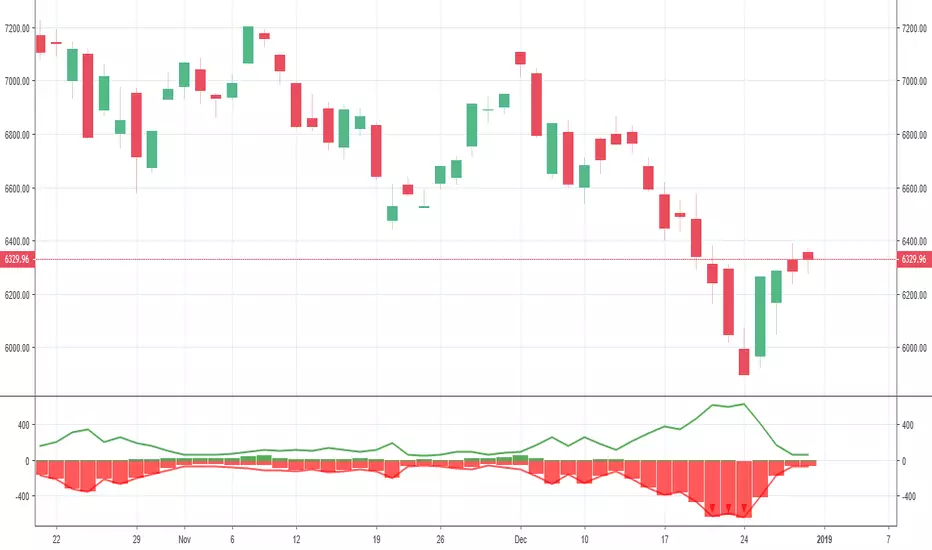
SMART4TRADER-INDEX PATTERN BREAKOUT MULTIThis indicator is designed to analyze the breakdown of previous values of the candles, not only on the selected tool, but also on others. The indicator is well used on the indices of the stock market. In the default indicator, recommended indexes are configured.
The indicator summarizes the results of the analysis of all tools and shows in the form of columns that are above and \ or below the zero line. Additionally, the indicator has two horizontal lines above zero (green) and two horizontal lines below zero (red). The breakdown of these nearest to zero lines signals the possible beginning of the move towards which the column is directed. If the column reached the left line, this means that a very strong trend is noticeable on all the tools selected in the settings.
Additionally, the indicator has a blue line that shows the average value of the columns both above and below the zero line. And also added Hull Moving Average Period (9).
BUY signal:
HIGH > HIGH(1) и LOW > LOW(1)
SELL signal:
HIGH < HIGH(1) и LOW < LOW(1) и LOW < LOW(2)
--------------------------------------------------------
Этот индикатор предназначен для анализа пробития предыдущих значений свечей, не только на выбранном инструменте, но и на других. Индикатор хорошо использовать на индексах фондового рынка. В индикаторе по умолчанию настроены рекомендуемые индексы для анализа.
Индикатор суммирует результаты анализа всех инструментов и показывает в виде столбиков, которые находиться выше и\или ниже нулевой линии. Дополнительно на индикаторе есть две горизонтальные линии выше нуля (зеленый) и две горизонтальные линии ниже нуля (красный). Пробитие этих ближайших к нулю линий сигнализирует о возможном начале движения в сторону, в которую направлен столбик. Если столбик достиг крайней линии, то это значит, что очень сильный тренд заметен на всех инструментах выбранных в настройках.
Дополнительно в индикаторе есть синяя линия, которая показывает среднее значение столбиков как выше, так и ниже нулевой линии. А также добавлена HULL MOVING AVERAGE период (9).
Сигнал на покупку:
HIGH > HIGH(1) и LOW > LOW(1)
Сигнал на продажу:
HIGH < HIGH(1) и LOW < LOW(1) и LOW < LOW(2)

Vwap mtf Swing Stock StrategyThis is a trending strategy designed for stock market, especially long trending assets such as TSLA, NIO, AMAZON and so on.
Its made of volatility bands and weekly VWAP, in this case daily and weekly.
This strategy has been adapted to go long only.
Rules for entry
For long , we want to enter close of a candle is above vwap weekly, and at the same time the close of a candle cross-under the lower volatility band.
For exit , we want to enter close of a candle is below vwap weekly, and at the same time the close of a candle cross-over the upper volatility band.
This strategy does not have a risk management inside, so use it with caution.
If you have any questions, let me know !


US Indices Cash Initial BalanceThis indicator plots the Cash Initial Balance for the ES, YM, NQ.
The Cash Initial Balance for US indices is the high & low from 9:30-10:30 ET, the first hour after the NYSE open.

Equity Index Extended HoursHighlights the extended hours/Globex session for US Equity Index Futures.

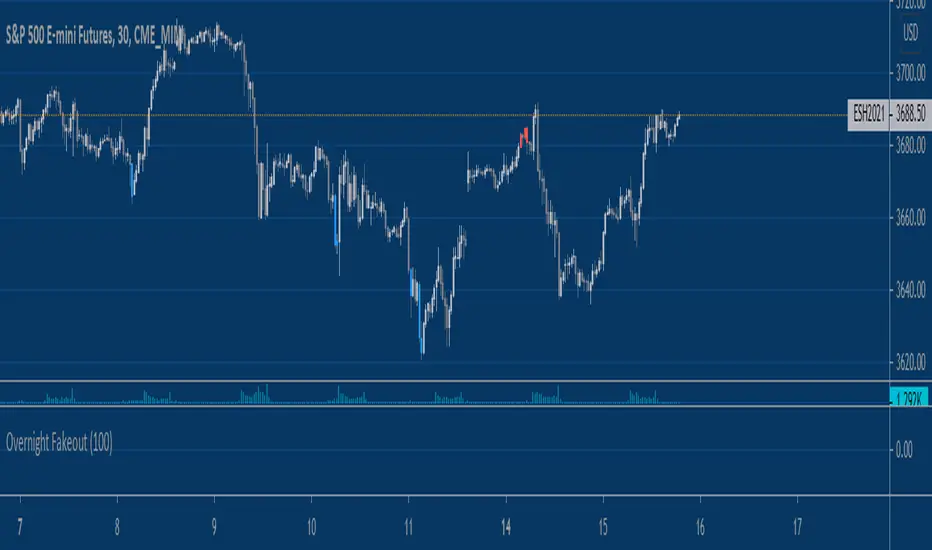
Equity Index Overnight FakeoutThis script highlights when price violates the highest high or lowest low within the user's selected lookback period, with the caveat that it occurs during the GLOBEX session. The script is designed to work exclusively with the trading hours for CME and CBOT Equity Index futures. I'm planning to make a more customizable version down the line.
My reasoning behind this very simple script is that the low liquidity and participation of the overnight session creates a tendency for moves at extremes to mean revert. Let me know what you think.
Percentage Relative StrengthA relative strength indicator that compares your main symbol (one on your chart) strength to another symbol by percentage.
The result is plotted as a histogram showing which symbol is rising or falling more in percentage.
In case your chart symbol is TSLA (Tesla) and the indicator 'Symbol to compare' is SPX:
GREEN area (above zero) means TSLA is rising more than the SPX.
RED area (below zero) means TSLA is falling more than the SPX.
To these who wants to understand calculation, it's pretty straightforward.
For each asset we calculate everyday percentage change based on previous close and current close.
We take main asset (chart symbol) percentage and subtract it from percent of change of the symbol we want to compare to.
Result are smoothed by SMA (Simple Moving Average)
You can select different indexes or cfds such as S&P500 (SPX), NASDAQ 100 (NSX), RUSSELL 2000 (RUT) and NASDAQ (IXIC).
Default is S&P 500 (SPX).
Enjoy and Like if you like.

Phenom 5.3.1This has been a private script until now. I will be sharing it in order to get some feedback until it is ready to be made "invite only"
WHAT IT IS:
This is a scalping method (mostly) that works on nearly all markets and timeframes. THIS IS A BACKTEST SCRIPT! PLAN ACCORDINGLY!
HOW IT WORKS:
This script uses common indicators (5) in non-standard ways. When combined together, they can give fairly accurate results (40-65%) with acceptable Profit Factor ratings (1.7-3+).
This uses CCI, Moving Average, Stochastic, PSAR, and Bollinger Bands.
With these we have 4 base strategies usable.
Each indicator can be disabled (one at a time).
Each indicator has a SL method (stackable).
Each indicator has a TP method (stackable).
BEST RESULTS:
I have received best results as a scalper on 5min or 1HR timeframes. Mostly used on Index CFD's and CRYPTO markets.
NOT RESPONSIBLE FOR MISUSE OR LOST FUNDS! D.Y.O.R

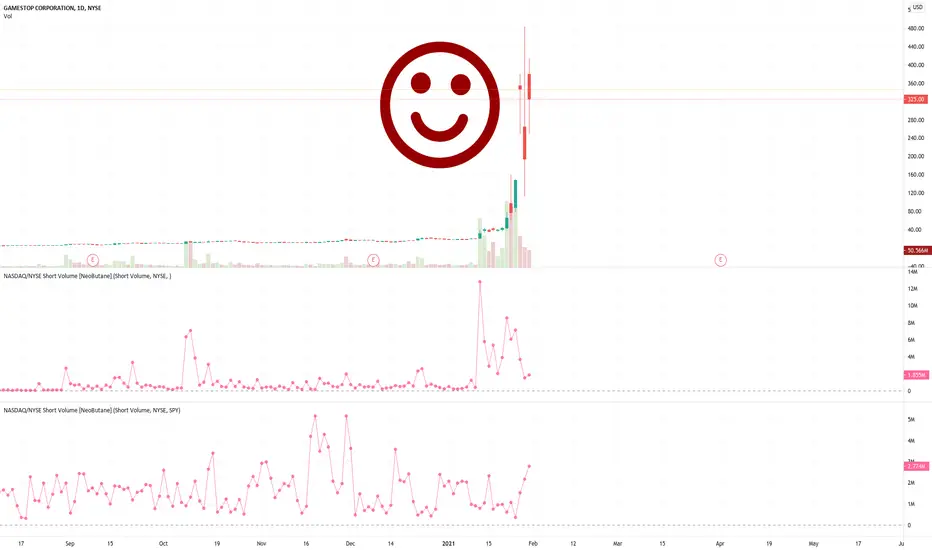
NASDAQ/NYSE Short Volume [NeoButane]This shows short volume from NASDAQ and NYSE.
If you do not understand what short volume is, I highly recommend researching FINRA documentation and reporting.
The indicator looks nice in histogram and column style.
The neat thing about nesting str.replace_all is that you can get the ticker without using a mutable variable.
Stock Market Strategy : VWAP, MACD, EMA, Breakout, BBHello there,
Today I bring you a stock market strategy, specialized in NASDAQ stocks.
Its a daytrading strategy, that can only do a max of 1 trade per day. In this case it only trades the first 2 opening hours of the market.
The rules are simple :
We follow the trend based on a big EMA, in this case 200, after that, we check for VWAP direction , then, we check histogram from MACD. This is the simple logic of the strategy.
Inside there is another strategy, that not just do the above, but also uses Bollinger bands, and checks for breakout of bottom or top line. Also it uses Average directional Index, for even a bigger criteria .
So for example a long condition it would be : candle is above the ema, and candle is above vwap, and histogram is positive, and candle break the top bb level and ADI < 40 -> long signal . The opposite works for short(ADI > 20).
In this case all this criterias are between the first 2 hours of market. So we enter between the first hour, and exit in the next hour. For this we need to use very short time frames.
Hope you enjoy it.
Let me know if you have any questions

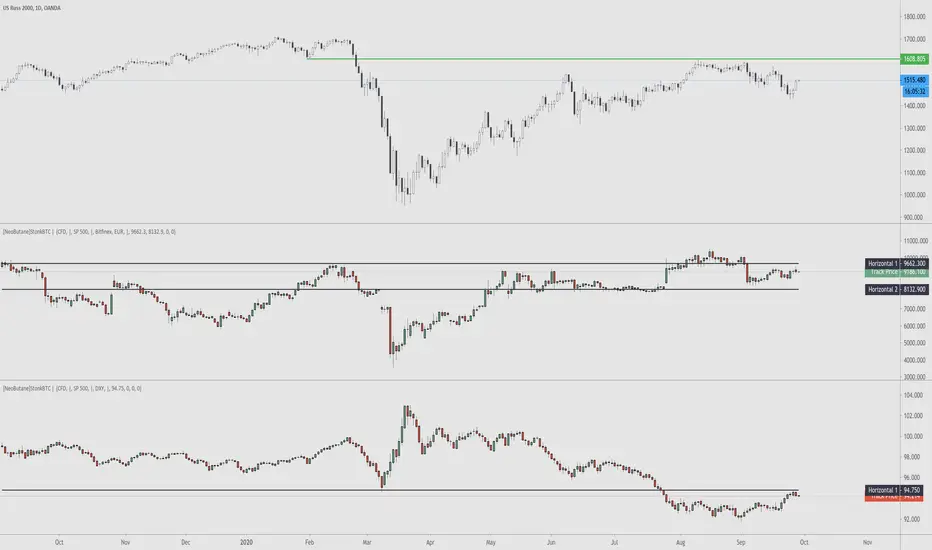
StonkBTC - autoswitch secondary series for scalpersSince the drop in March of 2020, the U.S. ETF , SPY, has been correlated with bitcoin's moves, especially during the NY session.
This tool is meant to help traders who want to take advantage of that without having to switch the secondary series between BTCUSD and (generally) SPY when changing the ticker they are viewing.
How this works:
The indicator will automatically switch between bitcoin or equity index depending on what ticker your current chart is. Ideally this tool would be very simple to use.
Options:
Show/hide a 'track price' line
Index choice of SP500, Nasdaq 100, and Russell 2000. Further selection by ETF, futures, and CFD
Varied bitcoin price sources
Notes:
You will need a separate subscription to TradingView to view realtime CME futures data (if not, it will be delayed by 10 minutes). Because of this, the default option chosen is the CFD for the most complete chart when viewing bitcoin.
NY Core Trading Session: 9:30 a.m. to 4:00 p.m. ET
www.nyse.com
Financials Per-EmployeeThe critical public eye has a strong interest in the fair payment of employees, especially in large, multi-national corporations such as Amazon, Apple, Google, and so on.
This indicator allows the user to view various measures of a companies financial performance against each employee.
When viewing the settings of this indicator, the user can select from a specific financial measure to view against the employees.
NOTE: Figures are published on a quarterly basis!
Settings Selections
Net Business Income per Employee
EBITDA per Employee
Gross Profit per Employee
Total Revenue per Employee
Total Common Equity per Employee
Total Number of Employees
This indicator can be accessed by ANYONE by searching in the public indicator library located at the top of your chart!

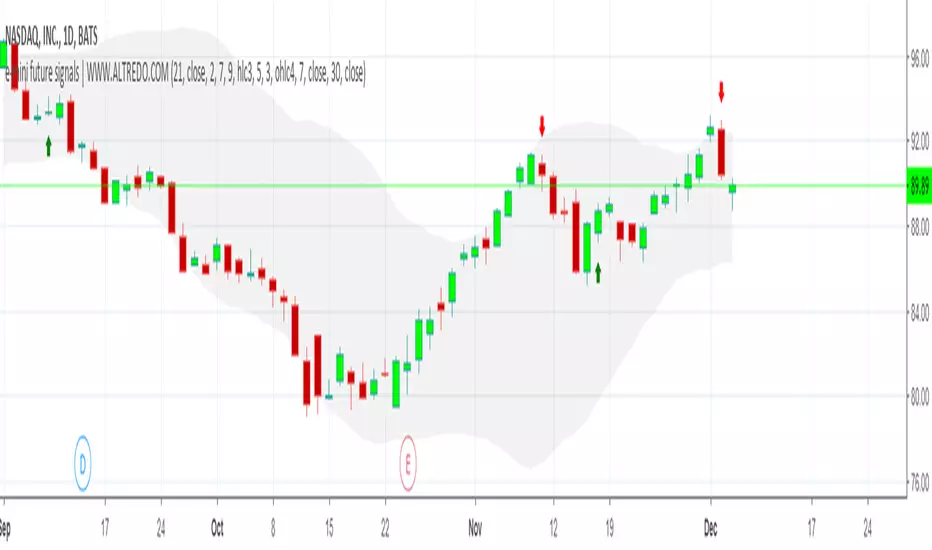
TeoTrading 17-C.1 - 107. USA Algorithmic Trading Long SignalsThis indicator mark patterns that were successful in the past, based on Algorithmic Trading and backtesting.
This Script is for Private Use.
It was designed for Long Signals.
Was developed and tested with Nasdaq technology stocks and Argentinian ADRs.
Includes Real Time Stastistics.
No purchase recommendations are given. The user must do their own analysis to decide whether to buy.
"A" signal is to make the Analysis. Here the user will see a Yellow Candle.
"V" signal is to Sell. Here the user will see:
- A Green Candle: Sell with Gain using a fixed Stop Gain.
- A Blue Candle: Sell with Gain using a dynamic (variable) Stop Gain.
- A Fuchsia Candle: Sell with lost.
The Orange Candle indicates that a trade is open.
Includes Alerts.

TeoTrading 17 - 106. Long Signals based on Algorithmic TradingThis indicator mark patterns that were successful in the past, based on Algorithmic Trading and backtesting.
This Script is for Private Use.
It was designed for Long Signals. Was developed and tested with o group of stocks:
- Argentine Stocks of different sectors: Bank, Energy and Industry.
- Nasdaq technology stocks.
- Petroleum.
Includes Real Time Stastistics.
No purchase recommendations are given. The user must do their own analysis to decide whether to buy.
"A" signal is to make the Analysis. Here the user will see a Yellow Candle.
"V" signal is to Sell. Here the user will see:
- A Green Candle: Sell with Gain using a fixed Stop Gain.
- A Blue Candle: Sell with Gain using a dynamic (variable) Stop Gain.
- A Fuchsia Candle: Sell with lost.
The Orange Candle indicates that a trade is open.
Includes Alerts.
Enabled users will obtain a complete manual.

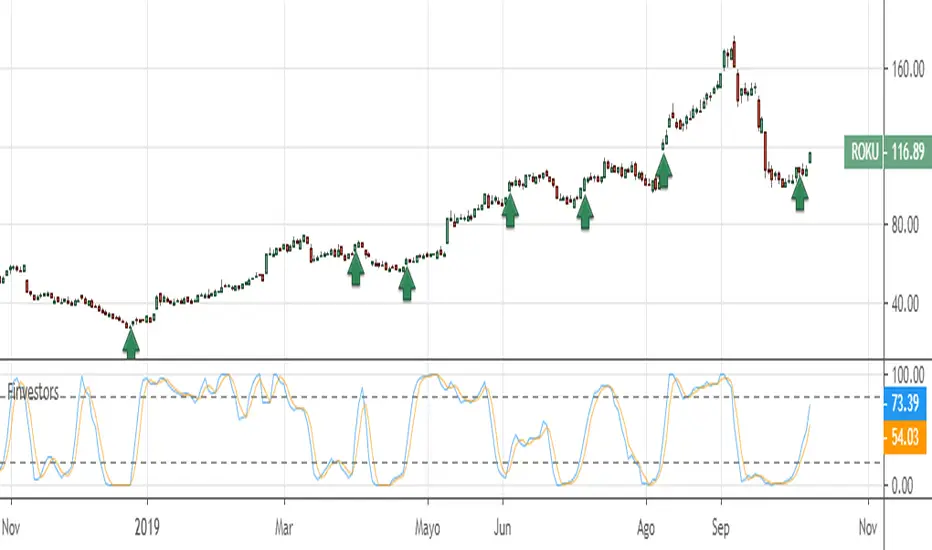
FinvestorsThis indicator is of the oscillator type. This indicator offers buy signals to investors. Swing Trading. Daily Timeframe.
Este indicador es del tipo oscilador. Este indicador ofrece señales de compra a los inversores.
New Highs-Lows NASDAQ-Buschi
English:
This indicator shows the NASDAQ's new highs (green) and new lows (red).
Extreme trading days with more than 99 % new highs relative to new lows vice versa are marked via lines (theoretically values) and triangles (breaches).
Deutsch:
Dieser Indikator zeigt die neuen Hochs (grün) und neuen Tiefs (rot) der NASDAQ.
Extreme Handelstage mit mehr als 99 % neuen Hochs relativ zu den neuen Tiefs und andersherum sind gekennzeichnet über Linien (theoretische Werte) und Dreiecke (Überschreitungen).
Up-Down Volume NASDAQ-Buschi
English:
This indicator shows the NASDAQ's up volume (green) and down volume (red).
Extreme trading days with more than 90 % up or down volume are marked via lines (theoretically values) and triangles (breaches).
Deutsch:
Dieser Indikator zeigt das Aufwärts- (grün) und Abwärts-Volumen (rot) der NASDAQ.
Extreme Handelstage mit mehr als 90 % Aufwärts- oder Abwärts-Volumen ist gekennzeichnet über Linien (theoretische Werte) und Dreiecke (Überschreitungen).

NASDAQ 1D TRADING SIGNALS | DAY TRADING SIGNALSNASDAQ 1D TRADING SIGNALS FOR SHORT-TERM AND MEDIUM-TERM TRADING!
✅ Based on trend analysis, includes Moving Average, Volatility indicators.
✅ This strategy can be used alone or alongside other strategies for better success.
✅ Real-time NASDAQ trading signals
The indicator provides an easy and fast way to determine the trend direction and possible reversals.
Green : Uptrend. Long trading
Red : Downtrend. Short trading
Stock Market Indices Correlations HeatmapHello friends,
I'm excited to share one of my insightful tools. This indicator visualizes how major global stock indices move relative to your selected instrument, helping you instantly spot market-wide strength, weakness, or divergence.
🛠 How It Works
The indicator calculates Pearson correlation coefficients between your selected symbol and 28 major stock indices , including S&P 500, NASDAQ, DAX, NIKKEI, and many more. Each color is selected according to the correlation value:
Green hues show positive correlations (instruments moving together).
Red hues show negative correlations (instruments moving in opposite directions).
Lighter or transparent colors indicate weak or no correlation.
You can customize the correlation lookback period (default 14 bars ), select your preferred data source (close, open, etc.), and choose from multiple professional color palettes to best match your charting style.
🔥 Key Features
Comprehensive Global Coverage — Correlations across 28 major indices from North America, Europe, and Asia.
Multiple Palettes — Choose from 8 professional color palettes (Blue/Red, Spectral, Viridis, etc.) for better visual clarity.
Adjustable Lookback — Set correlation calculation period from 1 to any number of bars.
Dynamic Data Requests — Real-time updates for all tracked indices using TradingView's request.security.
Smart Alerts — Receive alerts when all indices align positively or negatively — a sign of broad market sentiment extremes.
Performance Optimized — Efficient data handling ensures smooth operation even with multiple requests per bar.
Enhanced UI — Streamlined settings panel for fast palette and source adjustments.
Non-Repainting — Uses only historical data, ensuring stable readings.
If you'd like access or have any questions, feel free to reach out to me directly via DM.
👋 Good luck and happy trading!
Платный скрипт

PPSignal Salper Day (w and M)We have ppsignal day signal, we take daily and monthly signals, when these two intersect they generate atrend signal. ideal to search long signs in indices and actions.
Use with ppsigna trend overlay, hullma cross ordemae with ewo lbr and wave

Dhananjay Volatility stop strategy v1.0
Sharing one more strategy after getting good feedback on my earlier published strategy.
This is simple volatility stop strategy where in we are using VStop as entry and exit point.
Again smart traders can add MA to decide the trend and can avoid trading in opposite direction of trend which will help them to minimize loss making trades.
There are more than 1 parameters which traders can use/change to make this strategy compatible to their instrument.
To understand what is VStop use google.com :-)
Looking forward to receiving feedback from all of you.
