Dhanesh_CustomTrendlineLogicUsed framma in getting the trades.
You can also define the custom horizontal and an inclined trendline breaking of which can trigger the trade. Enjoy the script.
Индикаторы и стратегии
Quasimodo Pattern Strategy Back Test [TradingFinder] QM Trading🔵 Introduction
The QM pattern, also known as the Quasimodo pattern, is one of the popular patterns in price action, and it is often used by technical analysts. The QM pattern is used to identify trend reversals and provides a very good risk-to-reward ratio. One of the advantages of the QM pattern is its high frequency and visibility in charts.
Additionally, due to its strength, it is highly profitable, and as mentioned, its risk-to-reward ratio is very good. The QM pattern is highly popular among traders in supply and demand, and traders also use this pattern.
The Price Action QM pattern, like other Price Action patterns, has two types: Bullish QM and Bearish QM patterns. To identify this pattern, you need to be familiar with its types to recognize it.
🔵 Identifying the QM Pattern
🟣 Bullish QM
In the bullish QM pattern, as you can see in the image below, an LL and HH are formed. As you can see, the neckline is marked as a dashed line. When the price reaches this range, it will start its upward movement.
🟣 Bearish QM
The Price Action QM pattern also has a bearish pattern. As you can see in the image below, initially, an HH and LL are formed. The neckline in this image is the dashed line, and when the LL is formed, the price reaches this neckline. However, it cannot pass it, and the downward trend resumes.
🔵 How to Use
The Quasimodo pattern is one of the clearest structures used to identify market reversals. It is built around the concept of a structural break followed by a pullback into an area of trapped liquidity. Instead of relying on lagging indicators, this pattern focuses purely on price action and how the market reacts after exhausting one side of liquidity. When understood correctly, it provides traders with precise entry points at the transition between trend phases.
🟣 Bullish Quasimodo
A bullish Quasimodo forms after a clear downtrend when sellers start losing control. The market continues to make lower lows until a sudden higher high appears, signaling that buyers are entering with strength. Price then pulls back to retest the previous low, creating what is known as the Quasimodo low.
This area often becomes the final trap for sellers before the market shifts upward. A visible rejection or displacement from this zone confirms bullish momentum. Traders usually place entries near this level, stops below the low, and targets at previous highs or the next resistance zone. Combining the setup with demand zones or Fair Value Gaps increases its accuracy.
🟣 Bearish Quasimodo
A bearish Quasimodo forms near the top of an uptrend when buyers begin to lose strength. The market continues to make higher highs until a sudden lower low breaks the bullish structure, showing that selling pressure is entering the market. Price then retraces upward to retest the previous high, forming the Quasimodo high, where breakout buyers are often trapped.
Once rejection appears at this level, it indicates a likely reversal. Traders can enter short near this area, with stop-losses placed above the high and targets near the next support or previous lows. The setup gains more reliability when aligned with supply zones, SMT divergence, or bearish Fair Value Gaps.
🔵 Setting
Pivot Period : You can use this parameter to use your desired period to identify the QM pattern. By default, this parameter is set to the number 5.
Take Profit Mode : You can choose your desired Take Profit in three ways. Based on the logic of the QM strategy, you can select two Take Profit levels, TP1 and TP2. You can also choose your take profit based on the Reward to Risk ratio. You must enter your desired R/R in the Reward to Risk Ratio parameter.
Stop Loss Refine : The loss limit of the QM strategy is based on its logic on the Head pattern. You can refine it using the ATR Refine option to prevent Stop Hunt. You can enter your desired coefficient in the Stop Loss ATR Adjustment Coefficient parameter.
Reward to Risk Ratio : If you set Take Profit Mode to R/R, you must enter your desired R/R here. For example, if your loss limit is 10 pips and you set R/R to 2, your take profit will be reached when the price is 20 pips away from your entry point.
Stop Loss ATR Adjustment Coefficient : If you set Stop Loss Refine to ATR Refine, you must adjust your loss limit coefficient here. For example, if your buy position's loss limit is at the price of 1000, and your ATR is 10, if you set Stop Loss ATR Adjustment Coefficient to 2, your loss limit will be at the price of 980.
Entry Level Validity : Determines how long the Entry level remains valid. The higher the level, the longer the entry level will remain valid. By default it is 2 and it can be set between 2 and 15.
🔵 Results
The following examples show the backtest results of the Quasimodo (QM) strategy in action. Each image is based on specific settings for the symbol, timeframe, and input parameters, illustrating how the QM logic can generate signals under different market conditions. The detailed configuration for each backtest is also displayed on the image.
⚠ Important Note : Even with identical settings and the same symbol, results may vary slightly across different brokers due to data feed variations and pricing differences.
Default Properties of Backtests :
OANDA:XAUUSD | TimeFrame: 5min | Duration: 1 Year :
BINANCE:BTCUSD | TimeFrame: 5min | Duration: 1 Year :
CAPITALCOM:US30 | TimeFrame: 5min | Duration: 1 Year :
NASDAQ:QQQ | TimeFrame: 5min | Duration: 5 Year :
OANDA:EURUSD | TimeFrame: 5min | Duration: 5 Year :
PEPPERSTONE:US500 | TimeFrame: 5min | Duration: 5 Year :

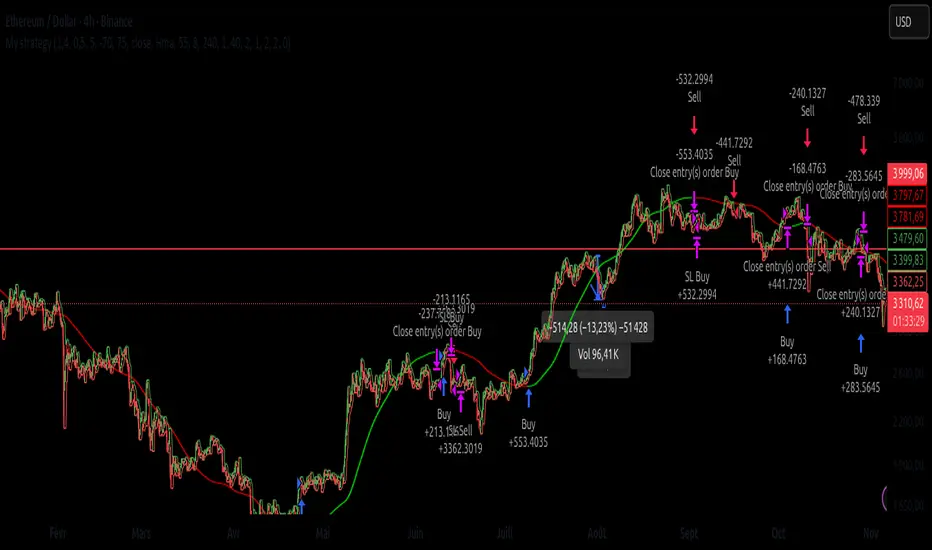
EMA Cross + RSI + ADX - Autotrade Strategy V2Overview
A versatile trend-following strategy combining EMA 9/21 crossovers with RSI momentum filtering and optional ADX trend strength confirmation. Designed for both cryptocurrency and traditional futures/options markets with built-in stop loss management and automated position reversals.
Key Features
Multi-Market Compatibility: Works on both crypto futures (Bitcoin, Ethereum) and traditional markets (NIFTY, Bank NIFTY, S&P 500 futures, equity options)
Triple Confirmation System: EMA crossover + RSI filter + ADX strength (optional)
Automated Risk Management: 2% stop loss with wick-touch detection
Position Auto-Reversal: Opposite signals automatically close and reverse positions
Webhook Ready: Six distinct alert messages for automation (Entry Buy/Sell, Close Long/Short, SL Hit Long/Short)
Performance Metrics
NIFTY Futures (15min): 50%+ win rate with ADX filter OFF
Crypto Markets: Requires extensive backtesting before live deployment
Optimal Timeframes: 15-minute to 1-hour charts (patience required for higher timeframes)
Strategy Logic
Entry Signals:
LONG: EMA 9 crosses above EMA 21 + RSI > 55 + ADX > 20 (if enabled)
SHORT: EMA 9 crosses below EMA 21 + RSI < 45 + ADX > 20 (if enabled)
Exit Signals:
Opposite EMA crossover (auto-closes current position)
Stop loss hit at 2% from entry price (tracks candle wicks)
Technical Indicators:
Fast EMA: 9-period (short-term trend)
Slow EMA: 21-period (primary trend)
RSI: 14-period with 55/45 thresholds (momentum confirmation)
ADX: 14-period with 20 threshold (trend strength filter - optional)
Market-Specific Settings
Traditional Markets (NIFTY, Bank NIFTY, S&P Futures, Options)
Recommended Settings:
ADX Filter: Turn OFF (less choppy, cleaner trends)
Timeframe: 15-minute chart
Win Rate: 50%+ on NIFTY Futures
Why No ADX: Traditional markets have more institutional participation and smoother price action, making ADX unnecessary
Cryptocurrency Markets (BTC, ETH, Altcoins)
Recommended Settings:
ADX Filter: Turn ON (ADX > 20)
Timeframe: 15-minute to 1-hour
Extensive backtesting required before live trading
Why ADX: Crypto markets are highly volatile and prone to false breakouts; ADX filters low-quality chop
Best Practices
✅ Backtest thoroughly on your specific instrument and timeframe
✅ Use larger timeframes (1H, 4H) for higher quality signals and better risk/reward
✅ Adjust RSI thresholds based on market volatility (try 52/48 for more signals, 60/40 for fewer but stronger)
✅ Monitor ADX effectiveness - disable for traditional markets, enable for crypto
✅ Proper position sizing - adjust default_qty_value based on your capital and instrument price
✅ Paper trade first - test for 2-4 weeks before risking real capital
Risk Management
Fixed 2% stop loss per trade (adjustable)
Stop loss tracks candle wicks for accurate execution
Positions auto-reverse on opposite signals (no manual intervention needed)
0.075% commission built into backtest (adjust for your broker)
Customization Options
All parameters are adjustable via inputs:
EMA periods (default: 9/21)
RSI length and thresholds (default: 14-period, 55/45 levels)
ADX length and threshold (default: 14-period, 20 threshold)
Stop loss percentage (default: 2%)
Webhook Automation
This strategy includes six distinct alert messages for automated trading:
"Entry Buy" - Long position opened
"Entry Sell" - Short position opened
"Close Long" - Long position closed on opposite crossover
"Close Short" - Short position closed on opposite crossover
"SL Hit Long" - Long stop loss triggered
"SL Hit Short" - Short stop loss triggered
Compatible with Delta Exchange, Binance Futures, 3Commas, Alertatron, and other webhook platforms.
Important Notes
⚠️ Crypto markets require extensive backtesting - volatility patterns differ significantly from traditional markets
⚠️ Higher timeframes = better results - 15min works but 1H/4H provide cleaner signals
⚠️ ADX toggle is critical - OFF for traditional markets, ON for crypto
⚠️ Not financial advice - always conduct your own research and use proper risk management
⚠️ Past performance ≠ future results - backtest results may not reflect live trading conditions
Disclaimer
This strategy is for educational and informational purposes only. Trading futures and options involves substantial risk of loss. Always backtest thoroughly, start with paper trading, and never risk more than you can afford to lose. The author assumes no responsibility for any trading losses incurred using this strategy.

3-Minute RSI and EMA Crossover Strategy 3-Minute RSI and EMA Crossover Sell Strategy with Exit Conditions and Re-entry

週一普跌策略 Monday shit Strategy Strategy Description / 策略敘述
EN
This strategy takes a short position at the start of each Monday, based on the hypothesis that cryptocurrency markets tend to experience post-weekend risk-off behavior.
The system enters a full-equity short position at the Tokyo open (Taipei 08:00), aiming to capture Monday downside pressure resulting from accumulated weekend information and macro sentiment adjustments when traditional financial markets reopen.
Risk management uses fixed percentage take-profit and stop-loss levels, emphasizing asymmetric reward-to-risk (large occasional gains, small frequent losses).
The model reflects the increasing alignment between crypto price behavior and traditional financial market cycles.
ZH-TW
本策略於每週一開盤時做空,基於假設加密資產在週末後具有風險釋放與補跌傾向。
系統會在台北時間早上 08:00 以全倉做空,目標捕捉因週末累積消息與傳統金融市場重新開盤所造成的下跌壓力。
風控採固定止盈、止損百分比,強調高報酬/低風險的不對稱結構(小虧多次、偶爾大賺)。
此模型反映加密貨幣市場行為與華爾街週期愈趨一致的市場現象。

FVG Session Break Strategy with ATR RR🧠 FVG Session Break Strategy with ATR RR — Timezone-Aware, Session-Savvy, and Risk-Calibrated
This strategy captures high-probability reversals and continuations by combining Fair Value Gap (FVG) imbalances with session-based breakout logic and ATR-calibrated risk management. It’s designed for traders who want to exploit structural inefficiencies during key market sessions — with precision and portability across global exchanges.
🔍 Core Logic:
Fair Value Gap Detection: Identifies bullish and bearish FVGs using a 3-bar displacement pattern.
Session Breakout Engine: Tracks session highs and lows (Asian, London, NY) and triggers trades only when price breaks these levels — ensuring trades occur at meaningful inflection points.
ATR-Based RR Control: Dynamically sizes stop-loss and take-profit levels using ATR × multiplier, maintaining consistent risk across volatility regimes.
🌐 Timezone-Aware Session Logic:
Session boundaries are defined in UTC-5 (e.g., NY: 0930–1600) but automatically converted to the exchange’s local timezone using timestamp("Etc/GMT+5", ...). This ensures:
Accurate session detection across all markets and assets
No manual timezone adjustments needed
Robust performance on crypto, forex, and global equities
📈 Visuals:
Session highs and lows plotted in orange
Bullish and bearish FVGs marked with green and red triangles
Strategy entries and exits shown on chart with full RR logic
This strategy is ideal for traders who want to combine structural edge with session context and disciplined risk.

QQQ TimingThis is a trend-following position trading strategy designed for the QQQ and the leveraged ETF QLD (ProShares Ultra QQQ). The primary goal is to capture multi-month holds for maximal profit.
Key Instruments & Performance
The strategy performs best with QLD, which yields far superior results compared to QQQ.
TQQQ (triple-leveraged) results in higher drawdowns and is not the optimal choice.
Important: The system is not intended for use with other indexes, individual stocks, or investments (like crypto or gold), as performance can vary widely.
Buy Signals
The strategy's signals are rooted in the S&P 500 Index (SPX), as testing showed it provides more reliable triggers than using QQQ itself.
Primary Buy Signal (Credit to IBD/Mike Webster): The SPX triggers a buy when its low closes above the 21-day Exponential Moving Average (EMA) for three consecutive days.
Refinement with Downtrend Lines: During corrective or bear periods, results and drawdowns can be significantly improved by incorporating downtrend lines. These lines connect lower highs. The strategy waits for the price to close above a drawn downtrend line before executing a buy. This refinement can modify the primary signal, either by allowing for an earlier entry or, in some cases, completely nullifying a false signal until the trend change proves itself.
Risk Management & Exit Strategy
Initial Buy Risk: A 3.7% stop loss is applied immediately upon the initial entry.
Initial Exit Rule: An exit is required if the QQQ's low drops below the 50-day Simple Moving Average (SMA).
Note: The 3.7% stop often provides protection when the initial buy occurs below the 50-day SMA. However, if QQQ is already trading above its 50-day SMA at the time of the SPX signal (indicating relative strength), historically, it has been better to use the 50-day SMA rule to give the position more room to run.
Trend Exit (Profit-Taking): To stay in a strong trend for the optimal amount of time, the long position is exited when a moving average crossover to the downside is triggered, based around the 107-day Simple Moving Average (SMA).

RastaRasta — Educational Strategy (Pine v5)
Momentum · Smoothing · Trend Study
Overview
The Rasta Strategy is a visual and educational framework designed to help traders study momentum transitions using the interaction between a fast-reacting EMA line and a slower smoothed reference line.
It is not a signal generator or profit system; it’s a learning tool for understanding how smoothing, crossovers, and filters interact under different market conditions.
The script displays:
A primary EMA line (the fast reactive wave).
A Smoothed line (using your chosen smoothing method).
Optional fog zones between them for quick visual context.
Optional DNA rungs connecting both lines to illustrate volatility compression and expansion.
Optional EMA 8 / EMA 21 trend filter to observe higher-time-frame alignment.
Core Idea
The Rasta model focuses on wave interaction. When the fast EMA crosses above the smoothed line, it reflects a shift in short-term momentum relative to background trend pressure. Cross-unders suggest weakening or reversal.
Rather than treating this as a trading “signal,” use it to observe structure, study trend alignment, and test how smoothing type affects reaction speed.
Smoothing Types Explained
The script lets you experiment with multiple smoothing techniques:
Type Description Use Case
SMA (Simple Moving Average) Arithmetic mean of the last n values. Smooth and steady, but slower. Trend-following studies; filters noise on higher time frames.
EMA (Exponential Moving Average) Weights recent data more. Responds faster to new price action. Momentum or reactive strategies; quick shifts and reversals.
RMA (Relative Moving Average) Used internally by RSI; smooths exponentially but slower than EMA. Momentum confirmation; balanced response.
WMA (Weighted Moving Average) Linear weights emphasizing the most recent data strongly. Intraday scalping; crisp but potentially noisy.
None Disables smoothing; uses the EMA line alone. Raw comparison baseline.
Each smoothing method changes how early or late the strategy reacts:
Faster smoothing (EMA/WMA) = more responsive, good for scalping.
Slower smoothing (SMA/RMA) = more stable, good for trend following.
Modes of Study
🔹 Scalper Mode
Use short EMA lengths (e.g., 3–5) and fast smoothing (EMA or WMA).
Focus on 1 min – 15 min charts.
Watch how quick crossovers appear near local tops/bottoms.
Fog and rung compression reveal volatility contraction before bursts.
Goal: study short-term rhythm and liquidity pulses.
🔹 Momentum Mode
Use moderate EMA (5–9) and RMA smoothing.
Ideal for 1 H–4 H charts.
Observe how the fog color aligns with trend shifts.
EMA 8 / 21 filter can act as macro bias; “Enter” labels will appear only in its direction when enabled.
Goal: study sustained motion between pullbacks and acceleration waves.
🔹 Trend-Follower Mode
Use longer EMA (13–21) with SMA smoothing.
Great for daily/weekly charts.
Focus on periods where fog stays unbroken for long stretches — these illustrate clear trend dominance.
Watch rung spacing: tight clusters often precede consolidations; wide rungs signal expanding volatility.
Goal: visualize slow-motion trend transitions and filter whipsaw conditions.
Components
EMA Line (Red): Fast-reacting short-term direction.
Smoothed Line (Yellow): Reference trend baseline.
Fog Zone: Green when EMA > Smoothed (up-momentum), red when below.
DNA Rungs: Thin connectors showing volatility structure.
EMA 8 / 21 Filter (optional):
When enabled, the strategy will only allow Enter events if EMA 8 > EMA 21.
Use this to study higher-trend gating effects.
Educational Applications
Momentum Visualization: Observe how the fast EMA “breathes” around the smoothed baseline.
Trend Transitions: Compare different smoothing types to see how early or late reversals are detected.
Noise Filtering: Experiment with fog opacity and smoothing lengths to understand trade-off between responsiveness and stability.
Risk Concept Simulation: Includes a simple fixed stop-loss parameter (default 13%) for educational demonstrations of position management in the Strategy Tester.
How to Use
Add to Chart → “Strategy.”
Works on any timeframe and instrument.
Adjust Parameters:
Length: base EMA speed.
Smoothing Type: choose SMA, EMA, RMA, or WMA.
Smoothing Length: controls delay and smoothness.
EMA 8 / 21 Filter: toggles trend gating.
Fog & Rungs: visual study options only.
Study Behavior:
Use Strategy Tester → List of Trades for entry/exit context.
Observe how different smoothing types affect early vs. late “Enter” points.
Compare trend periods vs. ranging periods to evaluate efficiency.
Combine with External Tools:
Overlay RSI, MACD, or Volume for deeper correlation analysis.
Use replay mode to visualize crossovers in live sequence.
Interpreting the Labels
Enter: Marks where fast EMA crosses above the smoothed line (or when filter flips positive).
Exit: Marks where fast EMA crosses back below.
These are purely analytical markers — they do not represent trade advice.
Educational Value
The Rasta framework helps learners explore:
Reaction time differences between moving-average algorithms.
Impact of smoothing on signal clarity.
Interaction of local and global trends.
Visualization of volatility contraction (tight DNA rungs) and expansion (wide fog zones).
It’s a sandbox for studying price structure, not a promise of profit.
Disclaimer
This script is provided for educational and research purposes only.
It does not constitute financial advice, trading signals, or performance guarantees. Past market behavior does not predict future outcomes.
Users are encouraged to experiment responsibly, record observations, and develop their own understanding of price behavior.
Author: Michael Culpepper (mikeyc747)
License: Educational / Open for study and modification with credit.
Philosophy:
“Learning the rhythm of the market is more valuable than chasing its profits.” — Rasta

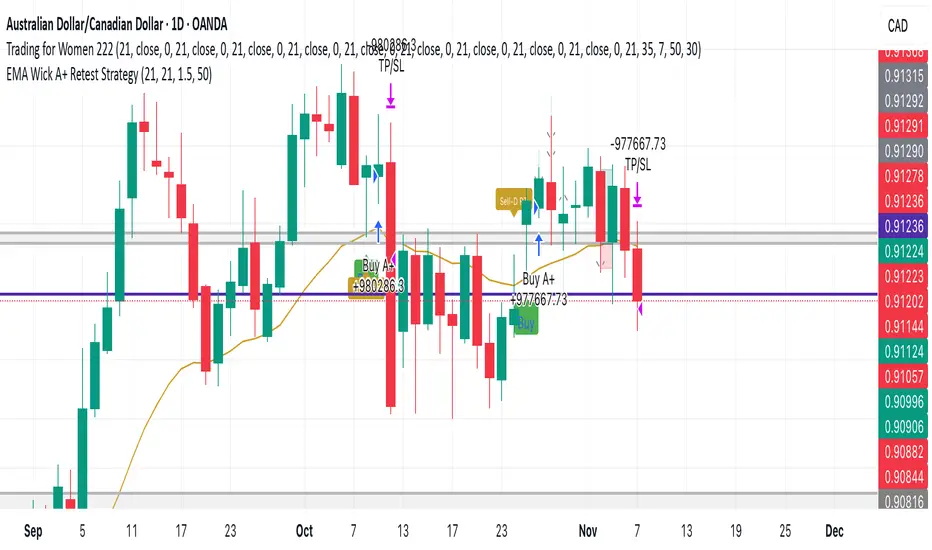
EMA Wick A+ Retest StrategyThe EMA Wick A+ Retest Strategy is a precision pullback system built for high-probability trend entries. It uses a combination of:
EMA 21 dynamic trend filtering
ATR-based stop-loss and reward targeting (1:1.5 RR)
Wick retest logic, where the lower wick must touch the EMA and represent at least 50% of the candle's range
Optional filter: RSI > 50 for bullish momentum confirmation
This strategy is designed to capture institutional-style entries after a clean pullback in an uptrend.
✅ Clean signals
✅ High risk-to-reward setups
✅ Built for swing trading or intraday with strong trend bias
Ideal for Forex, Crypto, and Indices.
Use responsibly. Backtest before live trading.
ETH Short-Term VWAP+EMA/RSI (ATR Risk, <1h) (James Logan)ETH Short-Term VWAP + EMA / RSI Strategy (ATR-based Risk Control)
A short-term (< 1 hour) ETH trading system designed for intraday scalps and momentum swings on 5- to 15-minute charts.
It blends trend confirmation (EMA 50 / 200) with intrabar structure (EMA 21 pullback & VWAP filter) and RSI momentum triggers, managing exits dynamically through ATR-based stop, take-profit, and trailing stop targets.
Core logic
• Long when RSI crosses above the threshold within an up-trend (EMA 50 > EMA 200) and price is above VWAP.
• Short when RSI crosses below threshold within a down-trend (EMA 50 < EMA 200) and price is below VWAP.
• Optional pullback confirmation to the 21-EMA for cleaner entries.
• Risk defined by ATR-multiples for stop-loss, take-profit, and an adaptive trailing stop.
• Automatic flat-out exit after a set number of bars (time-based close).
Best use
• 5 min – 15 min ETH/USDT charts (Binance, Bybit, Coinbase, etc.)
• Works with both spot and perpetual data.
• Tune ATR and RSI thresholds per venue; defaults are balanced for 0.05 % per-side fees.
Key parameters
• ATR SL × 1.6 ATR TP × 2.2 ATR Trail × 2.0
• RSI 50 cross | EMA 50/200 trend filter | VWAP confirmation
• Default position sizing = USD-based (e.g. $1 000 per trade).
Notes
• All orders and exits are simulated at bar close; use 1-minute bar magnifier for finer fill modeling.
• No repainting—uses only confirmed bar data.
• Best validated with ≥ 200 trades and profit factor > 1.25 over multi-month backtests.

Final Scalping Strategy - RELAXED ENTRY, jangan gopoh braderEMA Scalping System (MTF) Guide (1HR direction, 15 min entry)
Objective
To capture small, consistent profits by entering trades when 15-minute momentum aligns with the 1-hour trend.
Trades are executed only during high-liquidity London and New York sessions to increase the probability of execution and success.
Strategy Setup
Chart Timeframe (Execution): 15-Minute (M15).
Trend Filter (HTF): 1-Hour (H1) chart data is used for the long-term EMA.
Long-Term Trend Filter: 50-Period EMA (based on H1 data).
Short-Term Momentum Signal: 20-Period EMA (based on M15 data).
Risk
Metric: 14-period ATR for dynamic Stop Loss calculation.
✅ Trading Rules🟢
Long (Buy) Entry Conditions
Session: Must be within the London (0800-1700 GMT) or New York (1300-2200 GMT) sessions.
HTF Trend: Current price must be above the 1-Hour EMA 50.
Momentum Signal: Price crosses above the 15-Minute EMA 20.
Confirmation: The bar immediately following the crossover must close above the 15-Minute EMA 20.
Ent
ry: A market order is executed on the close of the confirmation candle.
🔴 Short (Sell) Entry Conditions
Session: Must be within the London (0800-1700 GMT) or New York (1300-2200 GMT) sessions.
HTF Trend: Current price must be below the 1-Hour EMA 50.
Momentum Signal: Price crosses below the 15-Minute EMA 20.
Confirmation: The bar immediately following the crossover must close below the 15-Minute EMA 20.
Entry: A market order is executed on the close of the confirmation candle.
🛑 Trade Management & Exits
Stop Loss (SL): Placed dynamically at 2.0 times the 14-period ATR distance from the entry candle's low (for Buys) or high (for Sells).
Take Profit (TP): Placed dynamically to achieve a 1.5 Risk-Reward Ratio (RR) (TP distance = 1.5 x SL d
istance).
📊 On-Chart Visuals
Detailed Labels: A box appears on the entry bar showing the action, SL/TP prices, Risk/Reward in Pips, and the exact R:R ratio.
Horizontal Lines: Dashed lines display the calculated SL (Red) and TP (Green) levels while the trade is active.
Background: The chart background is shaded to highlight the active London and New York tradi
ng sessions.

XAutoTrade Alert Builder v1.1Automate Your NinjaTrader Trading with TradingView Alerts
The XAutoTrade Alert Builder is a flexible Pine Script strategy that bridges TradingView alerts with
NinjaTrader automated trading. Design custom entry signals, configure exit strategies, and execute trades
automatically on your NinjaTrader account - all from TradingView charts.
Key Features
📊 Flexible Signal Logic
- Configure buy/sell signals independently
- Compare any two indicators or price sources using crossover, crossunder, greater than, or less than
logic
- Visual buy/sell markers on chart for easy signal verification
🎯 Multiple Exit Methods
1. ATM Strategy - Leverage your existing NinjaTrader ATM templates for advanced order management
2. Source Signals - Exit positions based on opposite entry signals
3. Fixed Levels - Set stop loss and profit targets using ticks or percentage
⚙️ NinjaTrader Integration
- Direct webhook integration with XAutoTrade backend service
- Multi-account support (trade multiple accounts simultaneously)
- Position sizing and max position limits
- Market or limit order types with configurable offset
- Time-in-force options (DAY/GTC)
- Active hours filter (US ET timezone) to control when alerts execute
🔐 Secure & Reliable
- Webhook secret authentication
- Symbol override capability
- Real-time status indicator showing configuration readiness
How It Works
1. Configure Entry Signals - Choose your buy/sell logic by comparing any two data sources (price,
indicators, etc.)
2. Set Exit Strategy - Select ATM templates, signal-based exits, or fixed stop/profit levels
3. Connect to NinjaTrader - Enter your XAutoTrade webhook secret and account details
4. Create Alert - Use the strategy's alert system to send formatted JSON payloads to your XAutoTrade
webhook
5. Trade Futures & Stocks Automatically - TradingView alerts trigger real trades in your NinjaTrader account
Perfect For
- Traders wanting to automate TradingView strategies in NinjaTrader
- Users with existing ATM templates who want TradingView signal automation
- Multi-account traders managing several NinjaTrader accounts
- Anyone seeking a no-code bridge between TradingView and NinjaTrader
Requirements
- Active XAutoTrade account and subscription
- NinjaTrader 8 with XAutoTrade AddOn installed
- TradingView Premium/Pro account (for webhook alerts)

NEXT GEN INSPIRED BY OLIVER VELEZDYOR NFA
1. Initial Setup & Application
Load the Strategy to your desired chart (e.g., EURUSD M5, as suggested by the script's backtest).
Overlay: Ensure the script is set to overlay=true (which it is) so the signals and Moving Averages plot directly on the price chart.
Equity Management: Review the initial strategy settings for capital and position sizing:
Initial Capital: Defaults to 10,000.
Default Qty Type: Set to strategy.percent_of_equity (22%), meaning 22% of your available equity is used per trade. Adjust this percentage based on your personal risk tolerance.
2. Reviewing Key Indicator Inputs
The script uses default values that are optimized, but you can adjust them in the settings panel:
Fast EMA: Defaults to 9 (e.g., a 9-period Exponential Moving Average).
Slow EMA: Defaults to 21 (e.g., a 21-period Exponential Moving Average). These EMAs define the short-term trend.
ATR: Defaults to 14 (Average True Range). Used to dynamically calculate volatility for SL/TP distances.
Final R:R: Defaults to 4.5 (minimum R:R required for a signal). This is the core of the strategy's high reward goal.
3. Interpreting Entry Signals
A trade signal is generated only when all conditions—EMA trend, "Elephant Logic" momentum, and non-ranging market—are met.
Long Signal: Appears as a green triangle (▲) below the bar, labeled "COMBO".
Short Signal: Appears as a red triangle (▼) above the bar, labeled "COMBO".
Live Plan: Upon signal, a detailed label is immediately plotted on the chart showing the FULL BATTLE PLAN:
SL: Calculated Stop Loss price.
TP: Calculated Take Profit price (based on the Final R:R).
Risk/Reward Pips: The calculated pips for the trade's risk and reward.
R:R = 1:4.5: The exact Risk-to-Reward ratio.
4. Understanding Market Conditions & Visuals
The script provides visuals to help you understand the current market state:
Trend EMAs: The 9 EMA (green) and 21 EMA (purple/magenta) are plotted to show the underlying trend.
Long trades only fire when Price > 9 EMA > 21 EMA.
Short trades only fire when Price < 9 EMA < 21 EMA.
Ranging Market (Rejection): Bars turn a light gray/silver when the proprietary "Reject Ranging" logic is active, indicating a low-volatility period. No new trades will be taken during these bars.
Momentum Bar: Bars turn a gold/yellow color when the "Elephant Logic" (high-momentum, large-body candles over 2-3 periods) is detected, highlighting powerful price movement.
5. Execution and Exit Logic
The strategy handles entry, scaling, and exit automatically:
Entry: A market order is placed (strategy.entry) immediately upon the bar where the longSetup or shortSetup condition is met.
Scaling Out (+1R): If the trade moves favorably by an amount equal to the initial risk (1R), the script closes a portion of the position (strategy.close with comment "+1R"). This partial exit locks in profit equivalent to the initial risk.
Re-entry (Pyramiding): After the +1R exit, the strategy attempts a re-entry (LONG RE/SHORT RE diamond plot) if the price meets certain criteria near the 9 EMA, trying to capitalize on further trend continuation.
Final Exits:
Take Profit: A limit order is set at the calculated TP level (stopDist * minRR).
Stop Loss: A stop order is set at the calculated SL level (stopDist * 1.3), slightly wider than the initial SL distance, likely to account for spread/slippage, ensuring the maximum loss is defined.
Trailing Stop: A trailing stop is applied to the re-entry positions (LONG RE/SHORT RE) to protect profits as the market moves further in the direction of the trade.

Range Trading StrategyOVERVIEW
The Range Trading Strategy is a systematic trading approach that identifies price ranges
from higher timeframe candles or trading sessions, tracks pivot points, and generates
trading signals when range extremes are mitigated and confirmed by pivot levels.
CORE CONCEPT
The strategy is based on the principle that when a candle (or session) closes within the
range of the previous candle (or session), that previous candle becomes a "range" with
identifiable high and low extremes. When price breaks through these extremes, it creates
trading opportunities that are confirmed by pivot levels.
RANGE DETECTION MODES
1. HTF (Higher Timeframe) Mode:
Automatically selects a higher timeframe based on the current chart timeframe
Uses request.security() to fetch HTF candle data
Range is created when an HTF candle closes within the previous HTF candle's range
The previous HTF candle's high and low become the range extremes
2. Sessions Mode:
- Divides the trading day into 4 sessions (UTC):
* Session 1: 00:00 - 06:00 (6 hours)
* Session 2: 06:00 - 12:00 (6 hours)
* Session 3: 12:00 - 20:00 (8 hours)
* Session 4: 20:00 - 00:00 (4 hours, spans midnight)
- Tracks high, low, and close for each session
- Range is created when a session closes within the previous session's range
- The previous session's high and low become the range extremes
PIVOT DETECTION
Pivots are detected based on candle color changes (bullish/bearish transitions):
1. Pivot Low:
Created when a bullish candle appears after a bearish candle
Pivot low = minimum of the current candle's low and previous candle's low
The pivot bar is the actual bar where the low was formed (current or previous bar)
2. Pivot High:
Created when a bearish candle appears after a bullish candle
Pivot high = maximum of the current candle's high and previous candle's high
The pivot bar is the actual bar where the high was formed (current or previous bar)
IMPORTANT: There is always only ONE active pivot high and ONE active pivot low at any
given time. When a new pivot is created, it replaces the previous one.
RANGE CREATION
A range is created when:
(HTF Mode) An HTF candle closes within the previous HTF candle's range AND a new HTF
candle has just started
(Sessions Mode) A session closes within the previous session's range AND a new session
has just started
Or Range Can Be Created when the Extreme of Another Range Gets Mitigated and We Have a Pivot low Just Above the Range Low or Pivot High just Below the Range High
Range Properties:
rangeHigh: The high extreme of the range
rangeLow: The low extreme of the range
highStartTime: The timestamp when the range high was actually formed (found by looping
backwards through bars)
lowStartTime: The timestamp when the range low was actually formed (found by looping
backwards through bars)
highMitigated / lowMitigated: Flags tracking whether each extreme has been broken
isSpecial: Flag indicating if this is a "special range" (see Special Ranges section)
RANGE MITIGATION
A range extreme is considered "mitigated" when price interacts with it:
High is mitigated when: high >= rangeHigh (any interaction at or above the level)
Low is mitigated when: low <= rangeLow (any interaction at or below the level)
Mitigation can happen:
At the moment of range creation (if price is already beyond the extreme)
At any point after range creation when price touches the extreme
SIGNAL GENERATION
1. Pending Signals:
When a range extreme is mitigated, a pending signal is created:
a) BEARISH Pending Signal:
- Triggered when: rangeHigh is mitigated
- Confirmation Level: Current pivotLow
- Signal is confirmed when: close < pivotLow
- Stop Loss: Current pivotHigh (at time of confirmation)
- Entry: Short position
Signal Confirmation
b) BULLISH Pending Signal:
- Triggered when: rangeLow is mitigated
- Confirmation Level: Current pivotHigh
- Signal is confirmed when: close > pivotHigh
- Stop Loss: Current pivotLow (at time of confirmation)
- Entry: Long position
IMPORTANT: There is only ever ONE pending bearish signal and ONE pending bullish signal
at any given time. When a new pending signal is created, it replaces the previous one
of the same type.
2. Signal Confirmation:
- Bearish: Confirmed when price closes below the pivot low (confirmation level)
- Bullish: Confirmed when price closes above the pivot high (confirmation level)
- Upon confirmation, a trade is entered immediately
- The confirmation line is drawn from the pivot bar to the confirmation bar
TRADE EXECUTION
When a signal is confirmed:
1. Position Management:
- Any existing position in the opposite direction is closed first
- Then the new position is entered
2. Stop Loss:
- Bearish (Short): Stop at pivotHigh
- Bullish (Long): Stop at pivotLow
3. Take Profit:
- Calculated using Risk:Reward Ratio (default 2:1)
- Risk = Distance from entry to stop loss
- Target = Entry ± (Risk × R:R Ratio)
- Can be disabled with "Stop Loss Only" toggle
4. Trade Comments:
- "Range Bear" for short trades
- "Range Bull" for long trades
SPECIAL RANGES
Special ranges are created when:
- A range high is mitigated AND the current pivotHigh is below the range high
- A range low is mitigated AND the current pivotLow is above the range low
In these cases:
- The pivot value is stored in an array (storedPivotHighs or storedPivotLows)
- A "special range" is created with only ONE extreme:
* If pivotHigh < rangeHigh: Creates a range with rangeHigh = pivotLow, rangeLow = na
* If pivotLow > rangeLow: Creates a range with rangeLow = pivotHigh, rangeHigh = na
- Special ranges can generate signals just like normal ranges
- If a special range is mitigated on the creation bar or the next bar, it is removed
entirely without generating signals (prevents false signals)
Special Ranges
REVERSE ON STOP LOSS
When enabled, if a stop loss is hit, the strategy automatically opens a trade in the
opposite direction:
1. Long Stop Loss Hit:
- Detects when: position_size > 0 AND position_size <= 0 AND low <= longStopLoss
- Action: Opens a SHORT position
- Stop Loss: Current pivotHigh
- Trade Comment: "Reverse on Stop"
2. Short Stop Loss Hit:
- Detects when: position_size < 0 AND position_size >= 0 AND high >= shortStopLoss
- Action: Opens a LONG position
- Stop Loss: Current pivotLow
- Trade Comment: "Reverse on Stop"
The reverse trade uses the same R:R ratio and respects the "Stop Loss Only" setting.
VISUAL ELEMENTS
1. Range Lines:
- Drawn from the time when the extreme was formed to the mitigation point (or current
time if not mitigated)
- High lines: Blue (or mitigated color if mitigated)
- Low lines: Red (or mitigated color if mitigated)
- Style: SOLID
- Width: 1
2. Confirmation Lines:
- Drawn when a signal is confirmed
- Extends from the pivot bar to the confirmation bar
- Bearish: Red, solid line
- Bullish: Green, solid line
- Width: 1
- Can be toggled on/off
STRATEGY SETTINGS
1. Range Detection Mode:
- HTF: Uses higher timeframe candles
- Sessions: Uses trading session boundaries
2. Auto HTF:
- Automatically selects HTF based on current chart timeframe
- Can be disabled to use manual HTF selection
3. Risk:Reward Ratio:
- Default: 2.0 (2:1)
- Minimum: 0.5
- Step: 0.5
4. Stop Loss Only:
- When enabled: Trades only have stop loss (no take profit)
- Trades close on stop loss or when opposite signal confirms
5. Reverse on Stop Loss:
- When enabled: Hitting a stop loss opens opposite trade with stop at opposing pivot
6. Max Ranges to Display:
- Limits the number of ranges kept in memory
- Oldest ranges are purged when limit is exceeded
KEY FEATURES
1. Dynamic Pivot Tracking:
- Pivots update on every candle color change
- Always maintains one high and one low pivot
2. Range Lifecycle:
- Ranges are created when price closes within previous range
- Ranges are tracked until mitigated
- Mitigation creates pending signals
- Signals are confirmed by pivot levels
3. Signal Priority:
- Only one pending signal of each type at a time
- New signals replace old ones
- Confirmation happens on close of bar
4. Position Management:
- Closes opposite positions before entering new trades
- Tracks stop loss levels for reverse functionality
- Respects pyramiding = 1 (only one position per direction)
5. Time-Based Drawing:
- Uses time coordinates instead of bar indices for line drawing
- Prevents "too far from current bar" errors
- Lines can extend to any historical point
USAGE NOTES
- Best suited for trending and ranging markets
- Works on any timeframe, but HTF mode adapts automatically
- Sessions mode is ideal for intraday trading
- Pivot detection requires clear candle color changes
- Range detection requires price to close within previous range
- Signals are generated on bar close, not intra-bar
The strategy combines range identification, pivot tracking, and signal confirmation to
create a systematic approach to trading breakouts and reversals based on price structure, past performance does not in any way predict future performance

RSI + MACD Multi-Timeframe StrategyThis strategy combines the Relative Strength Index (RSI) from the daily timeframe with the Moving Average Convergence Divergence (MACD) from the 4-hour timeframe to generate precise long entry and exit signals.
The system uses a multi-timeframe approach to align longer-term trend conditions with shorter-term momentum shifts — allowing traders to catch dips with confirmation and exit before reversals.
🧠 Strategy Logic
✅ Long Entry Condition:
- RSI on the daily (1D) timeframe is oversold (below your defined threshold)
- MACD on the 4H timeframe crosses above the signal line
→ A long trade is opened when these two align
✅ Long Exit Condition:
- RSI on the daily timeframe is overbought
- MACD on the 4H timeframe crosses below the signal line
→ The long trade is closed when these two conditions are met
💡 This strategy currently supports long entries only. Short logic can be added if needed.
📊 Indicator Components
🔹 RSI (Relative Strength Index):
- A momentum oscillator that measures the speed and magnitude of price changes.
- Helps identify overbought (potential sell) and oversold (potential buy) conditions.
- Applied on the 1D timeframe (by default) to reflect broader market trend or exhaustion levels.
🔹 MACD (Moving Average Convergence Divergence):
- A trend-following momentum indicator based on moving averages.
- The MACD Line (fast EMA - slow EMA) crossing above the Signal Line indicates bullish momentum.
- Used here on the 4-hour timeframe (by default) for shorter-term momentum confirmation.
🔹 Multi-Timeframe (MTF) Logic:
- Uses request.security() to pull higher timeframe data (1D for RSI, 4H for MACD).
- Ensures no repainting, as it only uses closed candles from the higher timeframe.
- Aligns longer-term signals with shorter-term entries, reducing false signals.
📈 Plotting Options
The script includes a plot selector input allowing you to toggle between:
- RSI Plot (with overbought/oversold lines)
- MACD Plot (MACD line and signal line)
- This helps visualize signal conditions clearly on your chart.
🛠 Customization
- RSI & MACD settings are fully configurable
- RSI and MACD timeframes can be adjusted independently
⚠️ Disclaimer
This strategy is provided for educational and informational purposes only.
It is not financial advice or a recommendation to buy or sell any asset.
Past performance does not guarantee future results. Always test strategies in a simulated environment before live use, and consult with a licensed financial advisor for investment decisions.

Confirmed Momentum QQQ (RSI/MACD Filter)Gemini and Myself,
How This Targets a Higher Win Rate
The key to the win rate increase is the RSI 20/80 filter.
Long Signal: A long entry is now only taken if the trend is up (SMA cross), the MACD is bullish, and the RSI is not overbought (below 80). By only entering when momentum is not yet exhausted, you increase the chance that the price can travel far enough to hit your 4.0 point Take Profit.
Wider SL: The wider Stop Loss of 2.5 points reduces the chance of being stopped out prematurely by routine market movements (whipsaws), which is the number one killer of win rates in high-frequency trading.
After applying these changes, you will need to run the Strategy Tester again to see the new win rate and the new total number of trades.
Would you like me to help you interpret the new Strategy Tester results once you apply these settings?

W%R Pullback+EMA Trend [TS_Indie]🔰 Core Concept of the Strategy
The main idea is “Trend-Following with Momentum Pullback.”
This means trading in the direction of the main trend (defined by EMA) while using Williams %R to identify pullback entries (buying the dip or selling the rally) where momentum returns to the trend direction.
📊 Indicators Used
1. EMA Fast – Defines the short-term trend.
2. EMA Slow – Defines the long-term trend (used as a trend filter).
3. Williams %R
• Overbought zone: above -20
• Oversold zone: below -80
⚙️ Entry Rules
🔹 Buy Setup
1. EMA Fast > EMA Slow → Uptrend condition.
2. Williams %R on the previous candle dropped below -80, and on the current candle, it crosses back above -80 → indicates momentum returning to the upside.
3. Current close is above EMA Fast.
4. Entry Buy at the close of the candle where %R crosses above -80.
🎯 Entry, Stop Loss, and Take Profit
1. Entry : At the candle close where the signal occurs.
2. Stop Loss : At the lowest low between the current and previous candles.
3. Take Profit : Calculated based on entry price and stop loss distance multiplied by the Risk/Reward Ratio.
🔹 Sell Setup
1. EMA Fast < EMA Slow → Downtrend condition.
2. Williams %R on the previous candle went above -20, and on the current candle, it crosses back below -20 → indicates renewed selling momentum.
3. Current price is below EMA Fast.
4. Entry Sell at the close of the candle where %R crosses below -20.
🎯 Entry, Stop Loss, and Take Profit
1. Entry : At the candle close where the signal occurs.
2. Stop Loss : At the highest high between the current and previous candles.
3. Take Profit : Calculated based on entry price and stop loss distance multiplied by the Risk/Reward Ratio.
⚙️ Optional Parameters
• Custom Risk/Reward Ratio for Take Profit.
• Option to add ATR buffer to Stop Loss.
• Adjustable EMA Fast period.
• Adjustable EMA Slow period.
• Adjustable Williams %R period.
• Option to enable Long only / Short only positions.
• Customizable Backtest start and end date.
• Customizable trading session time.
⏰ Alert Function
Alerts display:
• Entry price
• Stop Loss price
• Take Profit price
Guys, try adjusting the parameters yourselves!
I’ve been tweaking the settings for several days and managed to get great results on XAU/USD in the 5-minute timeframe.
I think this strategy is quite interesting and could potentially deliver good results on other instruments as well.
⚠️ Disclaimer
This indicator is designed for educational and research purposes only.
It does not guarantee profits and should not be considered financial advice.
Trading in financial markets involves significant risk, including the potential loss of capital.

12M SMA Timing (HTF-safe, 100% equity)Buy when S&P500 closes above 12M moving average. Sell when it closes below it. Monthly only.

For Albert**Strategy Name:** Agile Marketing Strategy
**Description:**
The Agile Marketing Strategy is a flexible and iterative approach to marketing that emphasizes rapid experimentation, customer feedback, and continuous improvement. This strategy enables marketers to adapt quickly to changing market conditions and customer needs, ensuring that marketing efforts remain relevant and effective.
**Key Principles:**
1. **Iterative Planning:** marketing activities are planned in short sprints, allowing for regular reassessment and adjustment of goals.
2. **Cross-Functional Teams:** collaboration between different departments (e.g., sales, product development, customer service) is encouraged to ensure a holistic approach to marketing.
3. **Data-Driven Decision Making:** decisions are based on real-time data and customer insights, enabling marketers to optimize their efforts for maximum impact.
4. **Continuous Learning:** the strategy promotes a culture of learning and experimentation, where marketers can test new ideas and learn from failures.
5. **Customer-Centric Approach:** understanding and meeting customer needs is prioritized through regular feedback and iterative improvements.
**Benefits:**
- **Increased Efficiency:** by focusing on iterative and incremental improvements, marketers can achieve better results with fewer resources.
- **Enhanced Customer Satisfaction:** a customer-centric approach helps to build stronger relationships and drive customer loyalty.
- **Faster Response to Market Changes:** the ability to quickly adapt to market trends and customer preferences ensures that marketing efforts remain effective.
- **Improved Collaboration:** cross-functional teams foster better communication and collaboration across departments.
- **Greater Innovation:** a culture of experimentation encourages marketers to explore new ideas and innovations.

BB SPY Mean Reversion Investment StrategySummary
Mean reversion first, continuation second. This strategy targets equities and ETFs on daily timeframes. It waits for price to revert from a Bollinger location with candle and EMA agreement, then manages risk with ATR based exits. Uniqueness comes from two elements working together. One, an adaptive band multiplier driven by volatility of volatility that expands or contracts the envelope as conditions change. Two, a bias memory that re arms the same direction after any stop, target, or time exit until a true opposite signal appears. Add it to a clean chart, use the markers and levels, and select on bar close for conservative alerts. Shapes can move while the bar is open and settle on close.
Scope and intent
• Markets. Currently adapted for SPY, needs to be optimized for other assets
• Timeframes. Daily primary. Other frames are possible but not the default
• Default demo. SPY on daily
• Purpose. Trade mean reversion entries that can chain into a longer swing by splitting holds into ATR or time segments
Originality and usefulness
• Novelty. Adaptive band width from volatility of volatility plus a persistent bias array that keeps the original direction alive across sequential entries until an opposite setup is confirmed
• Failure modes mitigated. False starts in chop are reduced by candle color and EMA location. Missed continuation after a take profit or stop is addressed by the re arm engine. Oversized envelopes during quiet regimes are avoided by the adaptive multiplier
• Testability. Every module has Inputs and visible levels so users can see why a suggestion appears
• Portable yardstick. All risk and targets are expressed in ATR units
Method overview in plain language
The engine measures where price sits relative to Bollinger bands, confirms with candle color and EMA location, requires ADX for shorts(in our case long close since we use it currently as long only), and optionally requires a trend or mean reversion regime using band width percent rank and basis slope. Risk uses ATR for stop, target, and optional breakeven. A small array stores the last confirmed direction. While flat, the engine keeps a pending order in that direction. The array flips only when a true opposite setup appears.
Base measures
• Range basis. True Range smoothed over a user defined ATR Length
• Return basis. Not required
Components
• Bollinger envelope. SMA length and standard deviation multiplier. Entry is based on cross of close through the band with location bias
• Candle and EMA filter. Close relative to open and close relative to EMA align direction
• ADX gate for shorts. Requires minimum trend strength for short trades
• Adaptive multiplier. Band width scales using volatility of volatility so envelopes breathe with conditions
• Regime gate optional. Band width percent rank and basis slope identify trend or mean reversion regimes
• Risk manager. ATR stop, ATR target, optional breakeven, optional time exit
• Bias memory. Array stores last confirmed direction and re arms entries while flat
Fusion rule
Minimum satisfied gates count style. All required gates must be true. Optional gates are controlled in Inputs. Bias memory never overrides an opposite confirmed setup.
Signal rule
• Long setup when close crosses up through the lower band, the bar closes green, and close is above the long EMA
• Short setup when close crosses down through the upper band, the bar closes red, close is below the short EMA, and ADX is above the minimum
• While flat the model keeps a pending order in the stored direction until a true opposite setup appears
• IN LONG or IN SHORT describes states between entry and exit
What you will see on the chart
• Markers for Long and Short setups
• Exit markers from ATR or time rules
• Reference levels for entry, stop, and target
• Bollinger bands and optional adaptive bands
Inputs with guidance
Setup
• Signal timeframe. Uses the chart timeframe
• Invert direction optional. Flips long and short
Logic
• BB Length. Typical 10 to 50. Higher smooths more
• BB Mult. Typical 1.0 to 2.5. Higher widens entries
• EMA Length long. Typical 10 to 50
• EMA Length short. Typical 5 to 30
• ADX Minimum for short. Typical 15 to 35
Filters
• Regime Type. none or trend or mean reversion
• Rank Lookback. Typical 100 to 300
• Basis Slope Length and Threshold. Larger values reduce false trends
Risk
• ATR Length. Typical 10 to 21
• ATR Stop Mult. Typical 1.0 to 3.0
• ATR Take Profit Mult. Typical 2.0 to 5.0
• Breakeven Trigger R. Move stop to entry after the chosen multiple
• Time Exit. Minimum bars and extension when profit exceeds a fraction of ATR
Bias and rearm
• Bias flips kept. Array depth
• Keep rearm when flat. Maintain a pending order while flat
UI
• Show markers and levels. Clean defaults
Usage recipes
Alerts update in real time and can change while the bar forms. Select on bar close for conservative workflows.
Properties visible in this publication
• Initial capital 25000
• Base currency USD
• If any higher timeframe calls are enabled, request.security uses lookahead off
• Commission 0.03 percent
• Slippage 3 ticks
• Default order size method Percent of equity with value 5
• Pyramiding 0
• Process orders on close On
• Bar magnifier Off
• Recalculate after order is filled Off
• Calc on every tick Off
Realism and responsible publication
No performance claims. Costs and fills vary by venue. Shapes can move intrabar and settle on close. Strategies use standard candles only.
Honest limitations and failure modes
High impact releases and thin liquidity can break assumptions. Gap heavy symbols may require larger ATR. Very quiet regimes can reduce contrast in the mean reversion signal. If stop and target can both be touched inside one bar, outcome follows the TradingView order model for that bar path.
Regimes with extreme one sided trend and very low volatility can reduce mean reversion edges. Results vary by symbol and venue. Past results never guarantee future outcomes.
Open source reuse and credits
None.
Backtest realism
Costs are realistic for liquid equities. Sizing does not exceed five percent per trade by default. Any departure should be justified by the user.
If you got any questions please le me know

RSI Mean-Reversion StrategyLong entry when RSI ≤ 30; exit at RSI ≥ 70. 100% equity per trade, 0.1% commission + 1 tick slippage. Optional 2% stop-loss. Visual buy/sell signals, dynamic SL line, and background highlight on oversold zones. Clean, backtest-ready Pine Script v5. Everything is easily adjustable to suit your liking.

Momentum Swing 1–3 Weeks
✅ Entry (LONG) Conditions
Price above EMA9 and SMA20
SMA20 > SMA50 (trend confirmation)
MACD above the signal line
RSI between 50–65 (healthy momentum)
Volume at least 20% above the 20-day average
When all conditions align, a LONG signal is generated.
✅ Exit (SELL) Conditions
Price closes below EMA9
MACD gives a bearish crossover
Or TP/SL levels are hit
Position is closed.
✅ Multi-Stage Take Profit
TP1: ATR × 1.5 → closes 50% of the position
TP2: ATR × 3.0 → closes remaining 50%
✅ Stop Loss
ATR × 1.5 dynamic SL
✅ What This Strategy Aims For
Catching early trend continuation signals
Filtering weak / low-volume breakouts
Exiting when momentum fades
Eliminating emotional decision-making through rules
📌 Note
Backtest performance may vary by symbol and volatility. Proper risk management is strongly recommended.

tradingview_momentum_Hull-Suite-W-FVSO-NO-WeekendMomentum no weekend trades. It uses FVZO and Hull suite.
This strategy has low win rate but successfully catches trends. Works well on ETH in High Time Frame multi-year.