Pivot Point Pivot points simply took the high, low, and closing price from the previous period and
divided by 3 to find the pivot. From this pivot, traders would then base their
calculations for three support, and three resistance levels. The calculation for the most
basic flavor of pivot points, known as ‘floor-trader pivots’, along with their support and
resistance levels.
Pivot
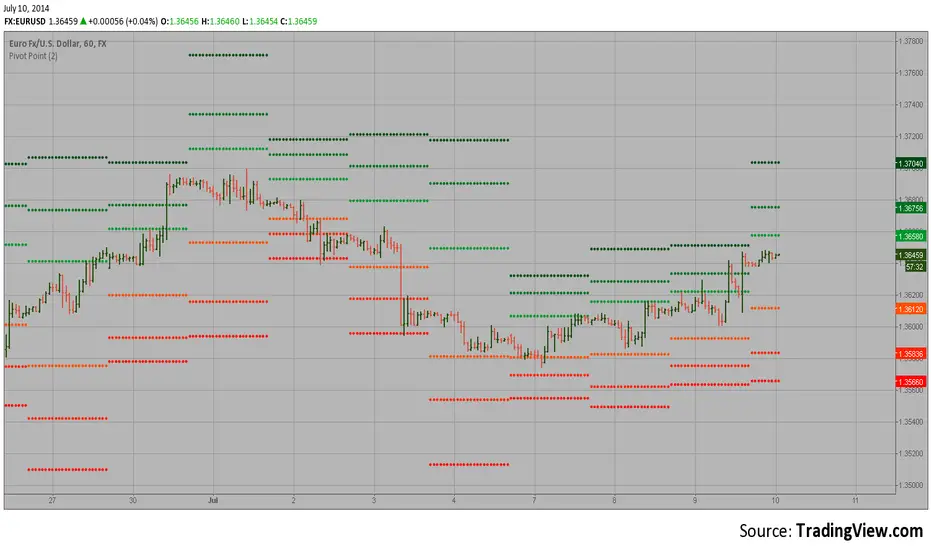
CM_Pivot Points_CustomCustom Pivots Indicator - Plots Yearly, Quarterly, Monthly, Weekly, and Daily Levels.
I created this indicator because when you have multiple Pivots on one chart (For Example The Monthly, Weekly, And Daily Pivots), the only way to know exactly what pivot level your looking at is to color ALL S1 Pivots the same color, but create the plot types to look different. For example S1 = Bright Green with Daily being small circles, weekly being bigger circles, and monthly being even bigger crosses for example. This allows you to visually know exactly what pivot levels your looking at…Instantly without thinking. This indicator allows you to Choose any clor you want for any Pivot Level, and Choose The Plot Type.
