[astropark] MACD, RSI+, Awesome Oscillator, DMI, ADX, OBV//******************************************************************************
// Copyright by astropark v4.0.0
// MACD, RSI+, Awesome Oscillator, DMI, ADX, OBV
// 24/10/2018 Added RSI with Center line to have clear glue of current trend
// 10/12/2018 Added MACD
// 13/12/2018 Added multiplier for MACD in order to make it clearly visible over RSI graph
// 11/01/2019 Added Awesome Oscillator (AO)
// 11/01/2019 Added Directional Movement Index (DMI) with ADX
// 14/01/2019 Added On Balance Volume (OBV)
//******************************************************************************
Поиск скриптов по запросу "adx"

[astropark] MACD, RSI+, Awesome Oscillator, DMI with ADX//******************************************************************************
// Copyright by astropark v3.1.0
// MACD, RSI+, Awesome Oscillator, DMI, ADX
// 24/10/2018 Added RSI with Center line to have clear glue of current trend
// 10/12/2018 Added MACD
// 13/12/2018 Added multiplier for MACD in order to make it clearly visible over RSI graph
// 11/01/2019 Added Awesome Ascillator (AO)
// 11/01/2019 Added Directional Movement Index (DMI) with ADX
//******************************************************************************

Directional Indicator Strategy v1.2ADX Trading Strategy , using
ADX, D+ and D-
RSI
Historical Volatility
Hull Moving Averange for the price trend
Stop-loss
The Strategy Report is based on 10.000 USD initial investment without pyramiding, starting on januari the 1st 2018, on a 1D time frame. Taking in account a 0.2% Commission fee per trade.

DMI strategy(lirshah)The Directional Movement Index indicator, or DMI, is a trend trading indicator developed by Welles Wilder, which also invented one of the most popular overbought and oversold indicator " RSI indicator".
DMI is based on a scale from 0 to 100 that identifies the price direction and the strength of the trend.
The DMI indicator is composed of three lines:
ADX, which is non-directional, so it will quantify the strength of the trend regardless if it’s bullish or bearish.The ADX line is derived from the relationship of the DMI+ and DMI- lines
DMI+, which measures the strength of the upward price movement.
DMI-, which measures the strength of the downward price movement.
this strategy gives signals according to movements of these three lines and has the best result on xrpusd M15 chart.

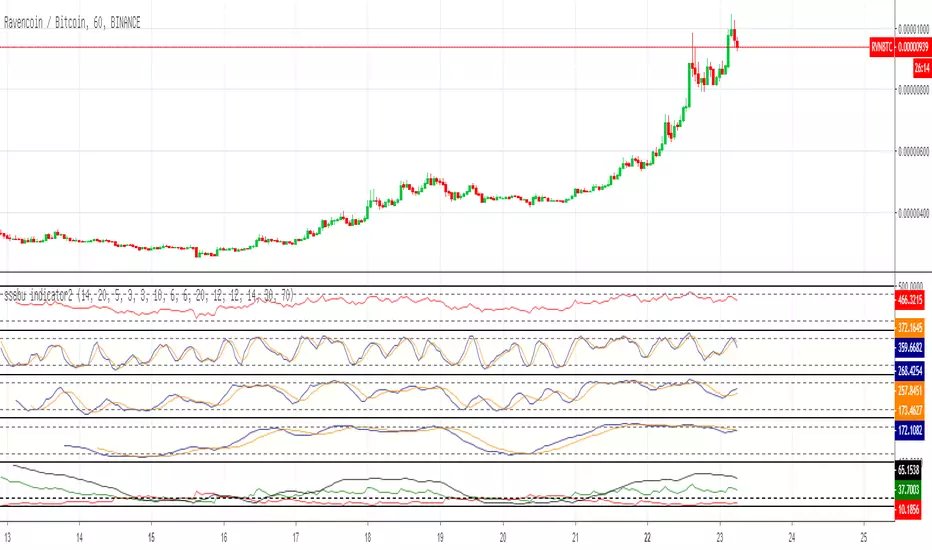
SSABU Indicator2
─────────────────────────────────────
3 Stochastic
1 RSI
1 ADX and DI
Use it if you need auxiliary indicators!
─────────────────────────────────────
스톡캐스틱 3개
RSI 1개
ADX and DI 1개
보조지표 갯수 모자란분들 사용하세요!
─────────────────────────────────────
✅ Other indicators to help you trade
✅ 매매에 도움되는 다른 보조지표
Basel major swing 2.2
PpSignal ALMA ADXAlma ADX is a ADX and dmi oscillator in histogram format with alma and linreg internal calculation, yo have 3 line, green not trade, withe transition zone and lime trade zone.
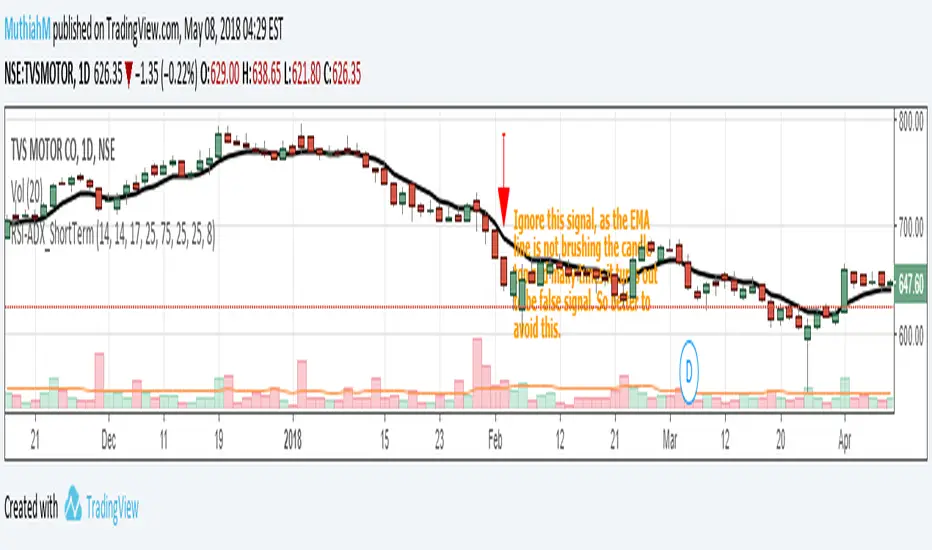
Setup for Short Term Investment using RSI&ADX. High success rateThis is a very simple script which gives reliable signals for buying and selling in short term. I came across this strategy a long time before in some website and coded it here. I had been using this for a long time and made good profits.
Idea is very simple, a buy call is triggered when RSI is greater than 75 and ADX is greater than 25. Sell call is triggered when RSI is lesser than 25 and ADX is again greater than 25. To remove false signals I always use it with EMA(close,8) which is also included as part of the code.
The ideal chart resolution is 1 day, below this the indicator is not reliable. Haven't tested this indicator for anything other than daily chart.
Refer the snapshots for more details.For any queries, please comment or PM me.
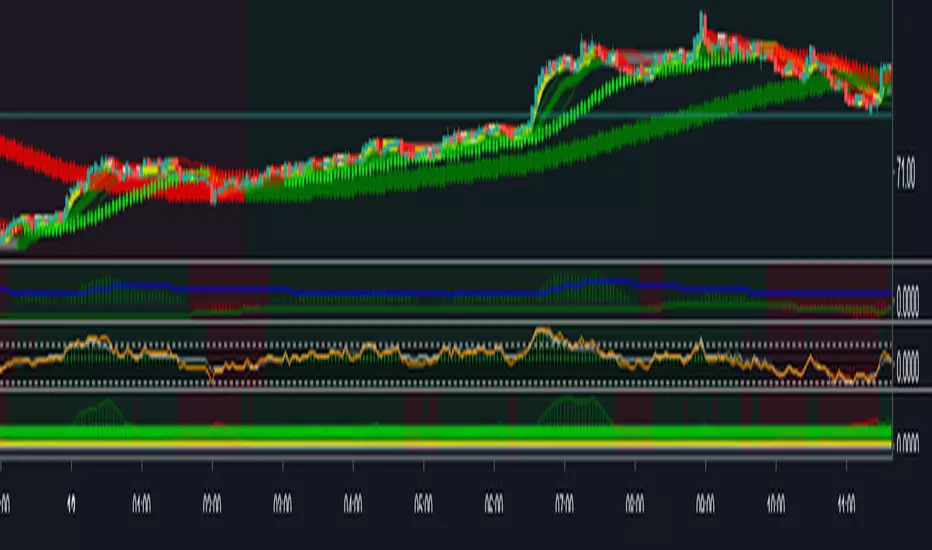
Ultimate Bar Analysis Emiliano MesaMy most complex script as a gift to you @TradingView.
Simple price action analysis. Look at the chart and the indicator will do everything else for you. This indicator is based in a combination of several indicators, including ADX, EMA, and concepts by the book "Bar by Bar" by Al Brooks. You can use it any way you like.
Its been tested in 5 minute stock charts, anything else is not assured to work.
Key:
Yellow/Pink ===> Buyer / Seller pressure (Bears/Bulls are gaining momentum)
Green/Orange ===> Up Trend / Down Trend, this is based on ADX, change the values if you wish.
Red ===> High reversal chance, based on Al Brooks book.
Grey Bars ===> No man land. (No trend is taking place)
Hope you enjoy! Leave your feedback down below.
---------------------------------------------------------------------
Want your own indicator? Email me at : emilianomesauribe2000@live.com
Prices starting at 100$
DMI strategykr.tradingview.com
Time of purchase : After the triangle under the Candle, Buy it if cross Just before the high on the day. and Consider the down trend and Whether the color of the candle is green and lime.
DMI+ADX를 이용한 전략입니다. +DI가 -DI를 상향돌파하면 캔들 아래 삼각형이 생기며 봉 캔들이 그린이면 +DI > -DI 일때이며 진정한 상승은 ADX도 20보다 클때인 형광색 캔들일때 입니다.
매수시점은 당일 즉 블루라인 범위내에서 고점을 캔들아래 삼각형 생기고 캔들색이 그린이나 형광색일때 돌파하면 매수입니다. 그리고 하향추세선이 위에있으면 참고하셔야합니다. 올라갈 공간이 있는지 확인해야합니다.

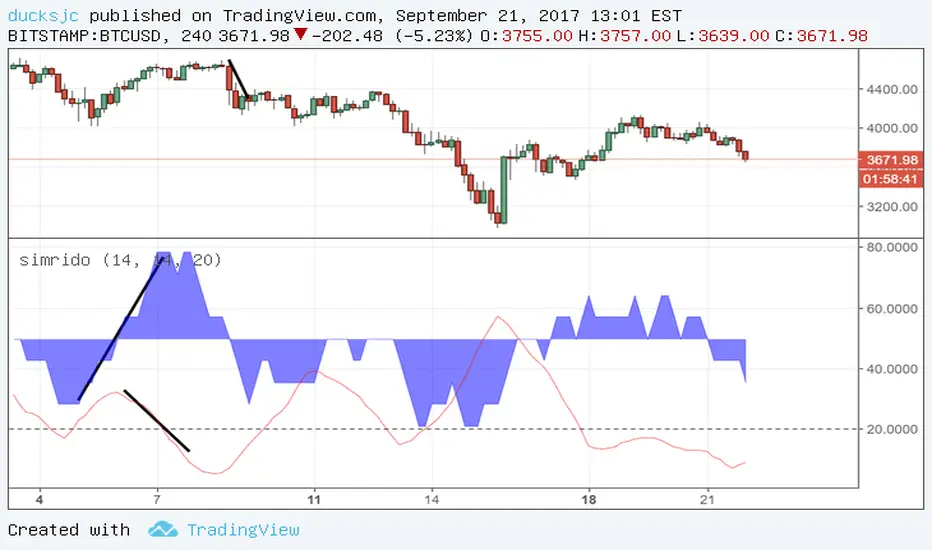
simrido+ADXblue area is srd (simrido. i cannot find proper english word. so i named it srd)
red is ADX
if blue is increasing (or higher than 50), it mean price increasing.
ok i like SRD. it looks like RSI. so good!
--------
blue increase + ADX decrease = price can be decrease soon (or decreasing already?)
This is not my idea. it something like Divergence...
well....i still cannot understand this idea.
:)
anyway i hope you enjoy this indicator.
DI histo + adxThis is a DI + ,DI - with ADX , but instead of plot the 2 lines of Directional moviment ( + and -), we have a histogram of the difference between DI+ and DI-. As zero line I used value of 25, so can plot the ADX too

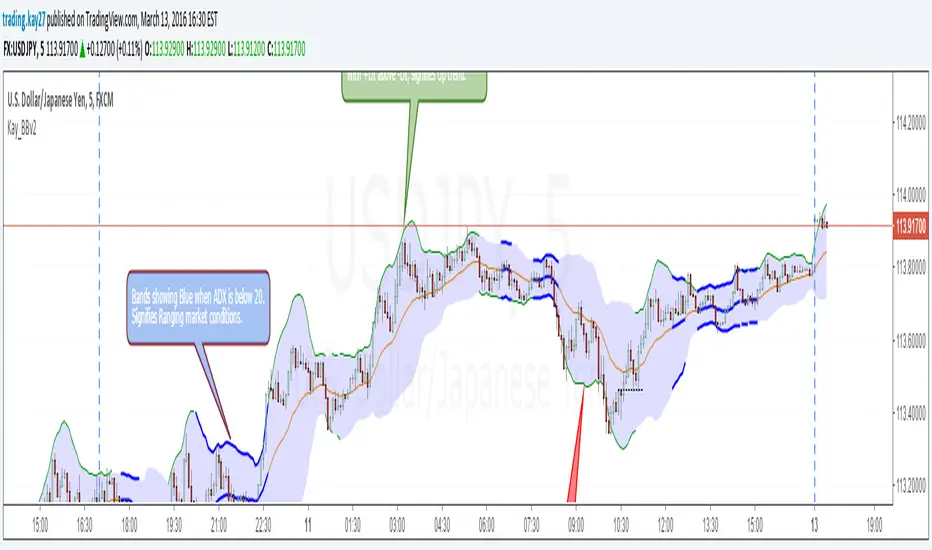
Kay_BBands v2This is the second version of Kay_BBands. But this is infused with ADX.
When +DI (Directional Index) is above -DI, then Upper band will be visible and vice-versa.
This is when the ADX is above the threshold. 20 is the default but can be set to 25.
When the ADX is below the specified threshold, both bands gets visible, showing no trending conditions.
Use it with another band with setting 20/21, 0.6 deviation. Prices keeping above or below the 2nd bands upper or lower bounds shows trending conditions.
VuManChu Strategy [ADX + Vol + Risk] - Good for BTC- The strategy uses the VuManChu WaveTrend oscillator
- Before entering any trade, the ADX filter must show a reading above 25. For more reliable momentum moves
- Three-Layer Exit System:
Fixed Stop Loss (3%): Hard stop placed 3% below entry for longs (above for shorts) to limit maximum loss per trade. This accommodates typical BTC 5-minute volatility without premature stopouts.
Take Profit Target (9%): Fixed profit target at 9% providing a 1:3 risk-reward ratio. This means you only need a 40-50% win rate to be profitable overall.
Conditional Trailing Stop: The most sophisticated protection - a trailing stop that only activates after the trade reaches 4.5% profit (halfway to target). Once activated, it trails price by 2%, locking in gains while still allowing the trade to reach the full 9% target.

Nifty-50 Futures trading ideas with RSI and ADX FilterNifty Futures @15M is a trend-following strategy derived from the Savitzky Flow Bands methodology by ChartPrime , adapted into a complete strategy with structured trade execution and risk controls.
The strategy identifies directional bias using a Savitzky-smoothed price structure and executes trades based on trend changes or continuation, depending on the selected entry mode.
Configurable Entry Modes are : 1. Change Only (trend reversal based) 2.Continuation Allowed (trend follow-through).
Optional ADX + DI and RSI filters help validate trend strength and avoid unfavorable market conditions.
Risk management features include configurable Stop-Loss and Take-Profit, ATR-based exits, trailing stop, and separate maximum loss per trade (₹) for long and short positions.
Date and session filters are provided for controlled backtesting.
This script is published for educational and analytical purposes only and is intended for research and backtesting, not as a trading signal or investment recommendation.
Credits:
Original indicator concept: Savitzky Flow Bands by ChartPrime
Strategy conversion & enhancements: @Alpha_Trinity

Crypto Intraday Strategy by SAIFOverview
A comprehensive intraday trading strategy designed for cryptocurrency markets, combining multiple technical indicators and risk management principles to identify high-probability trading opportunities.
Key Features
Multi-Timeframe Analysis
Utilizes exponential moving averages for trend identification
Incorporates swing structure analysis for support and resistance levels
Applies momentum and trend strength filters
Risk Management
Configurable risk-reward ratios (default 1.6:1)
Maximum risk per trade capped at 3.1% of equity
Dynamic stop-loss placement based on market structure
Position sizing at 2% of equity per trade
Advanced Filters
Trend strength confirmation using ADX indicator
Momentum validation through multiple oscillators
Market correlation analysis for additional confluence
Optional weekend trading filter to avoid low-liquidity periods
Swing Structure Recognition
Automatically identifies key swing highs and lows
Uses pivot points to determine optimal entry zones
Prevents entries too far from established support/resistance
Trade Execution
The strategy employs a one-way trading approach, entering positions only when multiple technical conditions align. Each trade includes pre-defined stop-loss and take-profit levels calculated at entry.
Customization Options
Adjustable swing detection sensitivity
Configurable EMA distance thresholds
Optional correlation filters
Weekend trading toggle
Risk parameters can be modified to suit individual preferences
Important Disclaimers
⚠️ Educational Purpose Only: This strategy is provided for educational and informational purposes. Past performance does not guarantee future results.
⚠️ Risk Warning: Trading cryptocurrencies carries substantial risk of loss. Only trade with capital you can afford to lose.
⚠️ Not Financial Advice: This tool does not constitute financial, investment, or trading advice. Always conduct your own research and consult with qualified financial professionals.
⚠️ Backtesting Limitations: Historical backtesting results may not reflect actual trading conditions due to slippage, execution delays, and changing market dynamics.
Fees & Slippage
Commission: 0.12% per trade
Slippage: 2 ticks accounted for in backtesting
Recommended Usage
Thoroughly backtest on your preferred trading pairs
Start with small position sizes when live trading
Monitor performance across different market conditions
Adjust parameters based on asset volatility and your risk tolerance

Trend with ADX, multiple EMAs - Buy & Sell✔ Trend Direction
Via DI+ > DI–
✔ Trend Strength
Via ADX
✔ Fast Entry Signals
5/8 EMA crossovers
✔ Larger Trend Confirmation
13/48 EMA crossovers
✔ Macro Trend
EMA 200
✔ Intraday Bias
VWAP
✔ Visual Trend (background)
✔ Alerts for signals + trend shifts


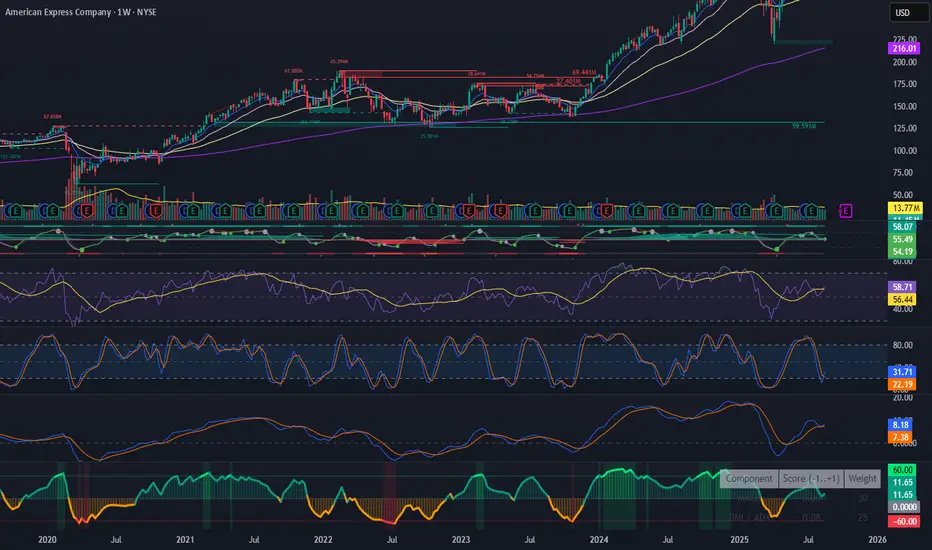
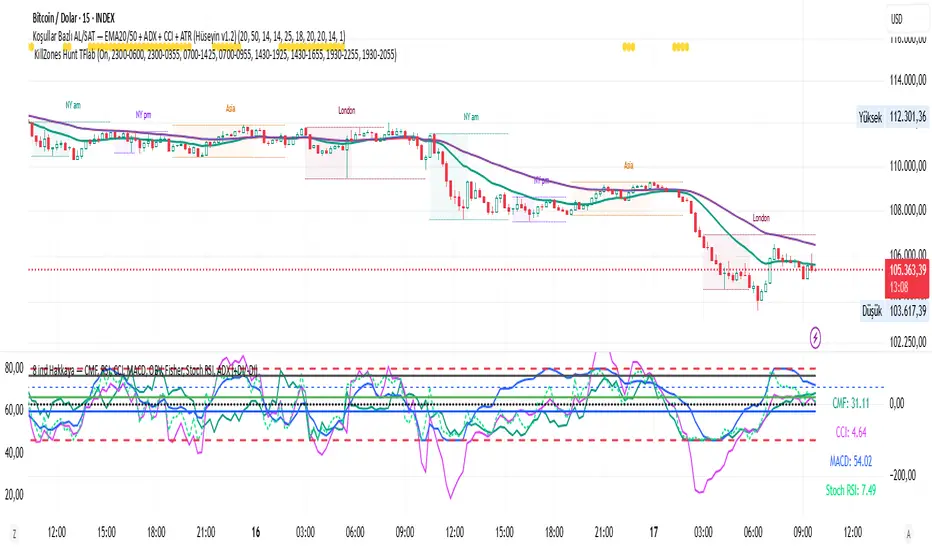
CMF, RSI, CCI, MACD, OBV, Fisher, Stoch RSI, ADX (+DI/-DI)
Stoch RSINine indicators in one, CMF, RSI, CCI, MACD, OBV, Fisher, Stoch RSI, ADX (+DI/-DI) You can use whichever of the nine indicators you want. I use CFM, CCI, MACD, Stoch RSI.
OBV Cloud v1.0 [PriceBlance]🌐 English
OBV Cloud v1.0 – Free & Open-Source
OBV Cloud v1.0 integrates On-Balance Volume (OBV) with a Cloud model and enhanced trend filters.
It helps traders quickly identify:
Money Flow Trend: OBV Cloud acts as a dynamic support/resistance zone.
Trend Filters: EMA9 (short-term) and WMA45 (medium-term) directly applied on OBV.
OBV–Price Divergence: Detects both regular and hidden bullish/bearish divergences.
Trend Strength: Measured with ADX calculated on OBV.
OBV Cloud is suitable for both swing and day trading, allowing traders to spot breakouts, reversals, or sustained trends through volume-based analysis.

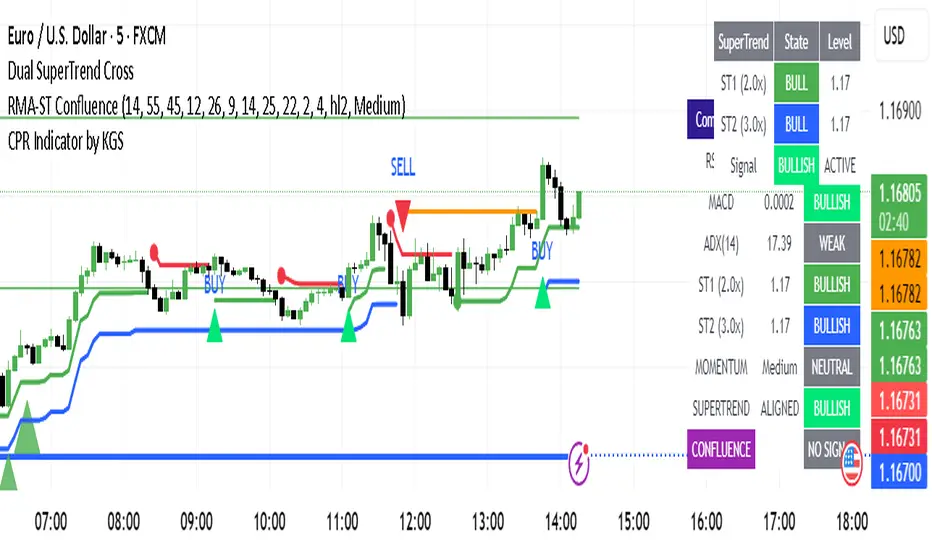
RSI-MACD-ADX + Dual SuperTrend ConfluenceKey Features:
Confluence Logic:
Buy signals only trigger when BOTH momentum AND SuperTrend are bullish
Sell signals only trigger when BOTH momentum AND SuperTrend are bearish
No conflicting signals - eliminates false entries when systems disagree
Signal Types:
STRONG BUY/SELL: Fresh momentum signal + Fresh SuperTrend alignment (maximum confidence)
Regular BUY/SELL: Momentum bullish + Both SuperTrends bullish (high confidence)
Customizable Settings:
RSI Momentum Zones: Bullish (>55), Bearish (<45), Neutral (45-55)
MACD Parameters: Fast (12), Slow (26), Signal (9)
ADX Trend Filter: Threshold (25) for trend strength
Dual SuperTrend: Two multipliers (2.0x and 3.0x) for confluence
Signal Strength: Choose between Weak/Medium/Strong momentum requirements
Visual Elements:
SuperTrend Lines: Both multipliers displayed with different colors
Background Highlighting: Green for bullish confluence, red for bearish
Signal Arrows: Large arrows for strong signals, smaller for regular
Comprehensive Table: Shows all component states and final confluence signal
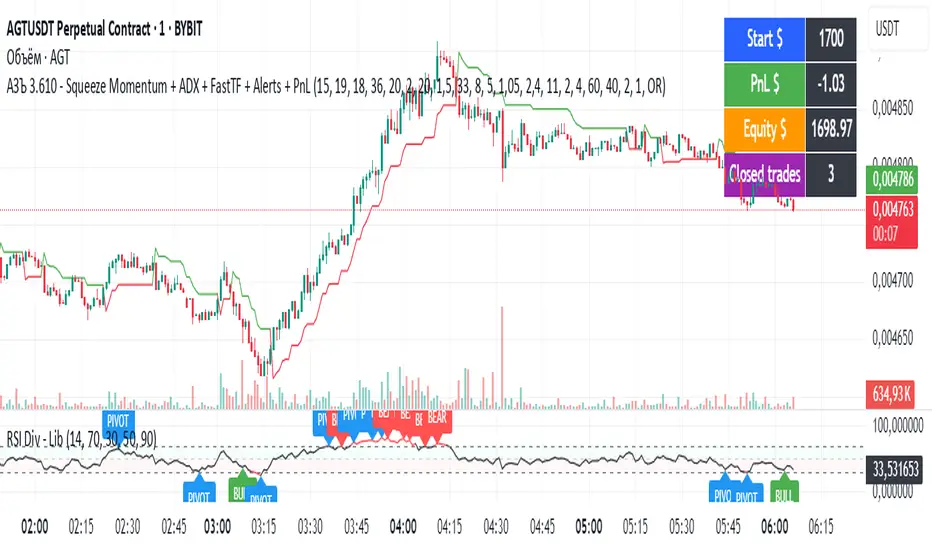
АЗЪ 3.610 - Squeeze Momentum + ADX + FastTF + Alerts + PnLStrata genius squeeze momentum + tester + adx +fast tf
Fear & Greed Oscillator — LEAPs (v6, manual DMI/ADX)Fear & Greed Oscillator for LEAPs — a composite sentiment/trend tool that highlights long-term fear/greed extremes and trend quality for better LEAP entries and exits.
This custom Fear & Greed Oscillator (FGO-LEAP) is designed for swing trades and long-term LEAP option entries. It blends multiple signals — MACD (trend), ADX/DMI (trend quality), OBV (accumulation/distribution), RSI & Stoch RSI (momentum), and volume spikes — into a single score that ranges from –100 (extreme fear) to +100 (extreme greed). The weights are tuned for LEAPs, emphasizing slower trend and accumulation signals rather than short-term noise.
Use Weekly charts for the main signal and Daily only for entry timing. Entries are strongest when the score is above zero and rising, with both MACD and DMI positive. Extreme Fear (< –60) can mark long-term bottoms when followed by a recovery, while Extreme Greed (> +60) often signals overheated conditions. A cross below zero is an early warning to reduce or roll positions.