Regime EngineRegime Engine
Overview
Regime Engine is a market regime detection system that classifies price action into bullish, bearish, or neutral states using weighted exponential moving average analysis. Once the regime is identified, the indicator generates buy and sell signals based on Donchian channel breakouts, filtered by ADX trend strength and RSI momentum conditions.
The Money Line
The core of regime detection is the Money Line, a weighted combination of two exponential moving averages. By default, the short EMA (8 periods) receives 60% weight while the long EMA (24 periods) receives 40% weight. This weighting allows the Money Line to be more responsive than a simple long-period average while remaining smoother than a short-period average alone.
The Money Line changes color based on the current regime: green for bullish, red for bearish, and yellow for neutral. This provides immediate visual feedback about the market state.
Regime Classification
The indicator determines market regime by comparing the relative positions of the short and long EMAs while also considering RSI levels to avoid classifying overbought or oversold conditions as trend states.
Bullish regime is identified when the short EMA is above the long EMA and RSI is not in overbought territory. This combination suggests upward momentum that is not yet exhausted.
Bearish regime is identified when the short EMA is below the long EMA and RSI is not in oversold territory. This indicates downward momentum with room to continue.
Neutral regime applies when the EMAs are close together or RSI conditions prevent trend classification. The indicator provides two optional methods for enhanced neutral detection.
Neutral Zone Detection
Markets often transition through periods where trend direction is unclear. The indicator offers two complementary methods for detecting these neutral zones.
The slope method examines the rate of change of the Money Line relative to ATR. When the Money Line is moving slowly (slope below a tolerance threshold), the market is classified as neutral regardless of EMA positioning.
The EMA distance method calculates the percentage distance between the short and long EMAs. When they are within a specified percentage of each other, the EMAs are considered too close to reliably indicate direction.
Either or both methods can be enabled, and if either triggers, the regime is classified as neutral.
Donchian Channel Signals
Buy and sell signals are generated when price interacts with the Donchian channel boundaries. The Donchian channel plots the highest high and lowest low over a lookback period (default 20 bars), offset by one bar to prevent repainting.
Buy signals trigger when price touches or breaks below the lower Donchian band, indicating a potential support level. Sell signals trigger when price touches or breaks above the upper Donchian band, indicating potential resistance.
An optional setting requires the close to confirm the break rather than just the wick, providing more conservative signal generation.
ADX Trend Strength Filter
The Average Directional Index filters signals to ensure they occur during trending conditions. When enabled, signals only fire if ADX exceeds the threshold (default 24), confirming that the market has sufficient directional momentum for breakout trades to succeed.
The indicator uses Wilder's original smoothing method for ADX calculation, providing the traditional interpretation of trend strength values.
RSI Momentum Filter
RSI provides additional signal filtering to ensure entries occur at favorable momentum levels. Buy signals require RSI to be at or below the oversold threshold (default 30), indicating potential exhaustion of selling pressure. Sell signals require RSI to be at or above the overbought threshold (default 70), suggesting exhaustion of buying pressure.
These filters can be disabled for traders who prefer unfiltered Donchian breakout signals.
BBWP Volatility Monitoring
Bollinger Band Width Percentile measures current volatility relative to its historical range. The indicator calculates BB width and ranks it against the specified lookback period (default 252 bars, approximately one trading year).
BBWP above 70% indicates elevated volatility, which may signal trend acceleration or potential reversals. BBWP below 30% indicates compressed volatility, often preceding significant moves. The information panel displays the current BBWP reading with color coding to highlight these conditions.
Signal Cooldown
To prevent signal clustering during extended breakout periods, a configurable cooldown prevents new signals of the same type for a specified number of bars after each signal. This ensures each signal represents a distinct trading opportunity.
Visual Components
The Donchian channel can display shaded bands between the upper and lower boundaries. The shading color reflects the current regime: green for bullish, magenta for bearish, and blue for neutral. This provides at-a-glance context for where price is trading within its recent range.
An ADX strength bar at the bottom of the chart uses color coding: white for weak trend (ADX below 15), orange for ranging (ADX 15-24), and blue for trending (ADX above 24). This matches the trend strength display in the information panel.
Price labels appear at signal locations showing the signal type and entry price. Labels are automatically cleaned up after reaching a configurable history limit to maintain chart performance.
Signal candles are highlighted in blue, making it easy to identify exactly which bars generated signals when reviewing historical performance.
Information Panel
A compact table displays key metrics: current regime bias, trend strength classification, BBWP volatility reading, RSI level, and ADX value. Each metric is color-coded to highlight favorable or unfavorable conditions.
The panel can be positioned at any corner or middle edge of the chart. An alternative label-based display anchored to the chart is also available for those who prefer that format.
Trend Persistence Option
By default, the regime is recalculated on every bar. An optional persistence mode changes this behavior so that the regime only changes on EMA crossovers. This reduces regime flipping during choppy conditions but may delay regime recognition during gradual trend changes.
How to Use
Monitor the Money Line color and information panel for current regime. In bullish regimes, focus on buy signals at the lower Donchian band as potential pullback entries. In bearish regimes, focus on sell signals at the upper band as potential short entries or exit points.
Use the ADX strength indicator to gauge signal reliability. Signals during trending conditions (blue ADX bar) have historically higher success rates than signals during ranging conditions (orange bar) or weak trends (white bar).
Watch BBWP for volatility context. Low BBWP readings suggest a significant move may be developing, while high readings indicate the current move may be overextended.
The combination of regime awareness, Donchian breakout signals, and ADX/RSI filtering provides a structured approach to identifying trading opportunities across different market conditions.
Settings Guidance
The default settings work well for cryptocurrency and forex markets on intraday timeframes. For stocks or longer timeframes, consider increasing the EMA periods and Donchian lookback. The ADX threshold can be adjusted based on the typical ADX range for the traded instrument.
The RSI filter levels can be relaxed (higher oversold, lower overbought) for more signals or tightened for higher-quality but less frequent signals. The cooldown period should be adjusted based on timeframe, with shorter timeframes typically requiring longer cooldown periods.
Поиск скриптов по запросу "adx"

Chimera [theUltimator5]In myth, the chimera is an “impossible” hybrid—lion, goat, and serpent fused into one—striking to look at and formidable in presence. The word has come to mean a beautiful, improbable union of parts that shouldn’t work together, yet do.
Chimera is a dual-mode market context tool that blends a multi-input oscillator with classic ADX/DI trend strength, plus optional multi-timeframe “gap-line” tracking. Use it to visualize regime (trend vs. range), momentum swings around an adaptive midline, and higher timeframe (HTF) reference levels that auto-terminate on touch/cross.
Modes
1) Oscillator view
A smoothed composite of five common inputs—RSI, MACD (oscillator), Bollinger position, Stochastic, and an ATR/DI-weighted bias. Each is normalized to a comparable 0–100 style scale, averaged, and plotted as a candle-style oscillator (short vs. long smoothing, wickless for clarity). A dynamic midline with standard-deviation bands frames neutral → bearish/bullish zones. Colors ramp from neutral to your chosen Oversold/Overbought endpoints; consolidation can override to white.
Here is a description of the (5) signals used to calculate the sentiment oscillator:
RSI (14): Measures recent momentum by comparing average gains vs. losses. High = strength after advances; low = weakness after declines. (Z-score normalized to 0–100.)
MACD oscillator (12/26/9): Uses the difference between MACD and its signal (histogram) to gauge momentum shifts. Positive = bullish tilt; negative = bearish. (Z-score normalized.)
Bollinger Bands position (20, 2): Locates price within the bands (0–100 from lower → upper). Near upper suggests strength/expansion; near lower suggests weakness/contraction. (Then normalized.)
Stochastic (14, 3, 3): Shows where the close sits within the recent high-low range, smoothed via %D. Higher values = closes near highs; lower = near lows. (Scaled 0–100.)
ATR/DI composite (14): Volatility-weighted directional bias: (+DI − −DI) amplified by ATR as a % of price and its relative average. Positive = bullish pressure with volatility; negative = bearish. (Rank/scale normalized.)
All five are normalized and averaged into one composite, then smoothed (short/long) and compared to an adaptive midline with bands.
2) ADX view
Shows ADX, +DI, –DI with user-defined High Threshold. Transparency and color shift with regime. When ADX is strong, a directional “fire/ice” gradient fills the area between ADX and the high threshold, biased toward the dominant DI; when ADX is weak, a soft white fade highlights low-trend conditions.
HTF gap-line tracking (optional; both modes)
Detects “gap-like” reference levels after weak-trend consolidation flips into a sudden DI jump.
Anchors a line at the event bar’s open and auto-terminates upon first touch/cross (tick-size tolerance).
Auto-selects up to three higher timeframes suited to your chart resolution and prints non-overlapping lines with labels like 1H / 4H / 1D. Lower-priority duplicates are suppressed to reduce clutter.
Confirmation / repaint notes
Signals and lines finalize on bar close of the relevant timeframe.
HTF elements update only on the HTF bar close. During a forming bar they may appear transiently.
Line removal finalizes after the bar that produced the touch/cross closes.
Visual cues & effects
Oscillator candles: Open/High = long smoothing; Low/Close = short smoothing (no wicks).
Adaptive bands: Midline ± StdDev Multiplier × stdev of the blended series.
Consolidation tint: Optional white backdrop/candles when the consolidation condition is true (balance + low ADX).
Breakout VFX (optional): With strong DI/ADX and Bollinger breaks, renders a subtle “fire” flare above upper-band thrusts or “ice” shelf below lower-band thrusts.
Inputs (high-level)
Visual Style: Oscillator or ADX.
General (Oscillator): Lookback Period, Short/Long Smoothing, Standard Deviation Multiplier.
Color (Oscillator): Oversold/Overbought colors for gradient endpoints.
Plot (Oscillator): Show Candles, Show Slow MA Line, Show Individual Component (RSI/MACD/BB/Stoch/ATR).
Table (Oscillator): Show Information Table & position (compact dashboard of component values + status).
ADX / Gaps / VFX (both modes): ADX High Threshold, Highlight Backgrounds, Show Gap Labels, Visual Overlay Effects, and color choices for current-TF & HTF lines.
HTF selection: Automatic ladder (3 tiers) based on your chart timeframe.
Alerts (built-in)
Buy Signal – Primary: Oscillator exits oversold.
Sell Signal – Primary: Oscillator exits overbought.
Gap Fill Line Created (Any TF)
Gap Fill Line Terminated (Any TF)
ADX Crossed ABOVE/BELOW Low Threshold
ADX Crossed ABOVE/BELOW High Threshold
Consolidation Started
Alerts evaluate on the close of the relevant timeframe.
How to read it (quick guide)
Pick your lens: Oscillator for blended momentum around an adaptive midline; ADX for trend strength and DI skew.
Watch extremes & mean re-entries (Oscillator): Approaches to the top/bottom band show persistent momentum; returns toward the midline show normalization.
Check regime (ADX): Below Low = low-trend; above High = strong trend, with “fire/ice” bias toward +DI/–DI.
Track gap lines: Fresh labels mark new reference levels; lines auto-remove on first interaction. HTF lines add context but finalize only on HTF close.
The uniqueness from this indicator comes from multiple areas:
1. A unique multi-timeframe algorithm detects gap fill zones and plots them on the chart.
2. Visual effects for both visual modes were hand crafted to provide a visually stunning and intuitive interface.
3. The algorithm to determine sentiment uses a unique blend of weight and sensitivity adjustment to create a plot with elastic upper and lower bounds based off historical volatility and price action.

Market Zone Analyzer[BullByte]Understanding the Market Zone Analyzer
---
1. Purpose of the Indicator
The Market Zone Analyzer is a Pine Script™ (version 6) indicator designed to streamline market analysis on TradingView. Rather than scanning multiple separate tools, it unifies four core dimensions—trend strength, momentum, price action, and market activity—into a single, consolidated view. By doing so, it helps traders:
• Save time by avoiding manual cross-referencing of disparate signals.
• Reduce decision-making errors that can arise from juggling multiple indicators.
• Gain a clear, reliable read on whether the market is in a bullish, bearish, or sideways phase, so they can more confidently decide to enter, exit, or hold a position.
---
2. Why a Trader Should Use It
• Unified View: Combines all essential market dimensions into one easy-to-read score and dashboard, eliminating the need to piece together signals manually.
• Adaptability: Automatically adjusts its internal weighting for trend, momentum, and price action based on current volatility. Whether markets are choppy or calm, the indicator remains relevant.
• Ease of Interpretation: Outputs a simple “BULLISH,” “BEARISH,” or “SIDEWAYS” label, supplemented by an intuitive on-chart dashboard and an oscillator plot that visually highlights market direction.
• Reliability Features: Built-in smoothing of the net score and hysteresis logic (requiring consecutive confirmations before flips) minimize false signals during noisy or range-bound phases.
---
3. Why These Specific Indicators?
This script relies on a curated set of well-established technical tools, each chosen for its particular strength in measuring one of the four core dimensions:
1. Trend Strength:
• ADX/DMI (Average Directional Index / Directional Movement Index): Measures how strong a trend is, and whether the +DI line is above the –DI line (bullish) or vice versa (bearish).
• Moving Average Slope (Fast MA vs. Slow MA): Compares a shorter-period SMA to a longer-period SMA; if the fast MA sits above the slow MA, it confirms an uptrend, and vice versa for a downtrend.
• Ichimoku Cloud Differential (Senkou A vs. Senkou B): Provides a forward-looking view of trend direction; Senkou A above Senkou B signals bullishness, and the opposite signals bearishness.
2. Momentum:
• Relative Strength Index (RSI): Identifies overbought (above its dynamically calculated upper bound) or oversold (below its lower bound) conditions; changes in RSI often precede price reversals.
• Stochastic %K: Highlights shifts in short-term momentum by comparing closing price to the recent high/low range; values above its upper band signal bullish momentum, below its lower band signal bearish momentum.
• MACD Histogram: Measures the difference between the MACD line and its signal line; a positive histogram indicates upward momentum, a negative histogram indicates downward momentum.
3. Price Action:
• Highest High / Lowest Low (HH/LL) Range: Over a defined lookback period, this captures breakout or breakdown levels. A closing price near the recent highs (with a positive MA slope) yields a bullish score, and near the lows (with a negative MA slope) yields a bearish score.
• Heikin-Ashi Doji Detection: Uses Heikin-Ashi candles to identify indecision or continuation patterns. A small Heikin-Ashi body (doji) relative to recent volatility is scored as neutral; a larger body in the direction of the MA slope is scored bullish or bearish.
• Candle Range Measurement: Compares each candle’s high-low range against its own dynamic band (average range ± standard deviation). Large candles aligning with the prevailing trend score bullish or bearish accordingly; unusually small candles can indicate exhaustion or consolidation.
4. Market Activity:
• Bollinger Bands Width (BBW): Measures the distance between BB upper and lower bands; wide bands indicate high volatility, narrow bands indicate low volatility.
• Average True Range (ATR): Quantifies average price movement (volatility). A sudden spike in ATR suggests a volatile environment, while a contraction suggests calm.
• Keltner Channels Width (KCW): Similar to BBW but uses ATR around an EMA. Provides a second layer of volatility context, confirming or contrasting BBW readings.
• Volume (with Moving Average): Compares current volume to its moving average ± standard deviation. High volume validates strong moves; low volume signals potential lack of conviction.
By combining these tools, the indicator captures trend direction, momentum strength, price-action nuances, and overall market energy, yielding a more balanced and comprehensive assessment than any single tool alone.
---
4. What Makes This Indicator Stand Out
• Multi-Dimensional Analysis: Rather than relying on a lone oscillator or moving average crossover, it simultaneously evaluates trend, momentum, price action, and activity.
• Dynamic Weighting: The relative importance of trend, momentum, and price action adjusts automatically based on real-time volatility (Market Activity State). For example, in highly volatile conditions, trend and momentum signals carry more weight; in calm markets, price action signals are prioritized.
• Stability Mechanisms:
• Smoothing: The net score is passed through a short moving average, filtering out noise, especially on lower timeframes.
• Hysteresis: Both Market Activity State and the final bullish/bearish/sideways zone require two consecutive confirmations before flipping, reducing whipsaw.
• Visual Interpretation: A fully customizable on-chart dashboard displays each sub-indicator’s value, regime, score, and comment, all color-coded. The oscillator plot changes color to reflect the current market zone (green for bullish, red for bearish, gray for sideways) and shows horizontal threshold lines at +2, 0, and –2.
---
5. Recommended Timeframes
• Short-Term (5 min, 15 min): Day traders and scalpers can benefit from rapid signals, but should enable smoothing (and possibly disable hysteresis) to reduce false whipsaws.
• Medium-Term (1 h, 4 h): Swing traders find a balance between responsiveness and reliability. Less smoothing is required here, and the default parameters (e.g., ADX length = 14, RSI length = 14) perform well.
• Long-Term (Daily, Weekly): Position traders tracking major trends can disable smoothing for immediate raw readings, since higher-timeframe noise is minimal. Adjust lookback lengths (e.g., increase adxLength, rsiLength) if desired for slower signals.
Tip: If you keep smoothing off, stick to timeframes of 1 h or higher to avoid excessive signal “chatter.”
---
6. How Scoring Works
A. Individual Indicator Scores
Each sub-indicator is assigned one of three discrete scores:
• +1 if it indicates a bullish condition (e.g., RSI above its dynamically calculated upper bound).
• 0 if it is neutral (e.g., RSI between upper and lower bounds).
• –1 if it indicates a bearish condition (e.g., RSI below its dynamically calculated lower bound).
Examples of individual score assignments:
• ADX/DMI:
• +1 if ADX ≥ adxThreshold and +DI > –DI (strong bullish trend)
• –1 if ADX ≥ adxThreshold and –DI > +DI (strong bearish trend)
• 0 if ADX < adxThreshold (trend strength below threshold)
• RSI:
• +1 if RSI > RSI_upperBound
• –1 if RSI < RSI_lowerBound
• 0 otherwise
• ATR (as part of Market Activity):
• +1 if ATR > (ATR_MA + stdev(ATR))
• –1 if ATR < (ATR_MA – stdev(ATR))
• 0 otherwise
Each of the four main categories shares this same +1/0/–1 logic across their sub-components.
B. Category Scores
Once each sub-indicator reports +1, 0, or –1, these are summed within their categories as follows:
• Trend Score = (ADX score) + (MA slope score) + (Ichimoku differential score)
• Momentum Score = (RSI score) + (Stochastic %K score) + (MACD histogram score)
• Price Action Score = (Highest-High/Lowest-Low score) + (Heikin-Ashi doji score) + (Candle range score)
• Market Activity Raw Score = (BBW score) + (ATR score) + (KC width score) + (Volume score)
Each category’s summed value can range between –3 and +3 (for Trend, Momentum, and Price Action), and between –4 and +4 for Market Activity raw.
C. Market Activity State and Dynamic Weight Adjustments
Rather than contributing directly to the netScore like the other three categories, Market Activity determines how much weight to assign to Trend, Momentum, and Price Action:
1. Compute Market Activity Raw Score by summing BBW, ATR, KCW, and Volume individual scores (each +1/0/–1).
2. Bucket into High, Medium, or Low Activity:
• High if raw Score ≥ 2 (volatile market).
• Low if raw Score ≤ –2 (calm market).
• Medium otherwise.
3. Apply Hysteresis (if enabled): The state only flips after two consecutive bars register the same high/low/medium label.
4. Set Category Weights:
• High Activity: Trend = 50 %, Momentum = 35 %, Price Action = 15 %.
• Low Activity: Trend = 25 %, Momentum = 20 %, Price Action = 55 %.
• Medium Activity: Use the trader’s base weight inputs (e.g., Trend = 40 %, Momentum = 30 %, Price Action = 30 % by default).
D. Calculating the Net Score
5. Normalize Base Weights (so that the sum of Trend + Momentum + Price Action always equals 100 %).
6. Determine Current Weights based on the Market Activity State (High/Medium/Low).
7. Compute Each Category’s Contribution: Multiply (categoryScore) × (currentWeight).
8. Sum Contributions to get the raw netScore (a floating-point value that can exceed ±3 when scores are strong).
9. Smooth the netScore over two bars (if smoothing is enabled) to reduce noise.
10. Apply Hysteresis to the Final Zone:
• If the smoothed netScore ≥ +2, the bar is classified as “Bullish.”
• If the smoothed netScore ≤ –2, the bar is classified as “Bearish.”
• Otherwise, it is “Sideways.”
• To prevent rapid flips, the script requires two consecutive bars in the new zone before officially changing the displayed zone (if hysteresis is on).
E. Thresholds for Zone Classification
• BULLISH: netScore ≥ +2
• BEARISH: netScore ≤ –2
• SIDEWAYS: –2 < netScore < +2
---
7. Role of Volatility (Market Activity State) in Scoring
Volatility acts as a dynamic switch that shifts which category carries the most influence:
1. High Activity (Volatile):
• Detected when at least two sub-scores out of BBW, ATR, KCW, and Volume equal +1.
• The script sets Trend weight = 50 % and Momentum weight = 35 %. Price Action weight is minimized at 15 %.
• Rationale: In volatile markets, strong trending moves and momentum surges dominate, so those signals are more reliable than nuanced candle patterns.
2. Low Activity (Calm):
• Detected when at least two sub-scores out of BBW, ATR, KCW, and Volume equal –1.
• The script sets Price Action weight = 55 %, Trend = 25 %, and Momentum = 20 %.
• Rationale: In quiet, sideways markets, subtle price-action signals (breakouts, doji patterns, small-range candles) are often the best early indicators of a new move.
3. Medium Activity (Balanced):
• Raw Score between –1 and +1 from the four volatility metrics.
• Uses whatever base weights the trader has specified (e.g., Trend = 40 %, Momentum = 30 %, Price Action = 30 %).
Because volatility can fluctuate rapidly, the script employs hysteresis on Market Activity State: a new High or Low state must occur on two consecutive bars before weights actually shift. This avoids constant back-and-forth weight changes and provides more stability.
---
8. Scoring Example (Hypothetical Scenario)
• Symbol: Bitcoin on a 1-hour chart.
• Market Activity: Raw volatility sub-scores show BBW (+1), ATR (+1), KCW (0), Volume (+1) → Total raw Score = +3 → High Activity.
• Weights Selected: Trend = 50 %, Momentum = 35 %, Price Action = 15 %.
• Trend Signals:
• ADX strong and +DI > –DI → +1
• Fast MA above Slow MA → +1
• Ichimoku Senkou A > Senkou B → +1
→ Trend Score = +3
• Momentum Signals:
• RSI above upper bound → +1
• MACD histogram positive → +1
• Stochastic %K within neutral zone → 0
→ Momentum Score = +2
• Price Action Signals:
• Highest High/Lowest Low check yields 0 (close not near extremes)
• Heikin-Ashi doji reading is neutral → 0
• Candle range slightly above upper bound but trend is strong, so → +1
→ Price Action Score = +1
• Compute Net Score (before smoothing):
• Trend contribution = 3 × 0.50 = 1.50
• Momentum contribution = 2 × 0.35 = 0.70
• Price Action contribution = 1 × 0.15 = 0.15
• Raw netScore = 1.50 + 0.70 + 0.15 = 2.35
• Since 2.35 ≥ +2 and hysteresis is met, the final zone is “Bullish.”
Although the netScore lands at 2.35 (Bullish), smoothing might bring it slightly below 2.00 on the first bar (e.g., 1.90), in which case the script would wait for a second consecutive reading above +2 before officially classifying the zone as Bullish (if hysteresis is enabled).
---
9. Correlation Between Categories
The four categories—Trend Strength, Momentum, Price Action, and Market Activity—often reinforce or offset one another. The script takes advantage of these natural correlations:
• Bullish Alignment: If ADX is strong and pointed upward, fast MA is above slow MA, and Ichimoku is positive, that usually coincides with RSI climbing above its upper bound and the MACD histogram turning positive. In such cases, both Trend and Momentum categories generate +1 or +2. Because the Market Activity State is likely High (given the accompanying volatility), Trend and Momentum weights are at their peak, so the netScore quickly crosses into Bullish territory.
• Sideways/Consolidation: During a low-volatility, sideways phase, ADX may fall below its threshold, MAs may flatten, and RSI might hover in the neutral band. However, subtle price-action signals (like a small breakout candle or a Heikin-Ashi candle with a slight bias) can still produce a +1 in the Price Action category. If Market Activity is Low, Price Action’s weight (55 %) can carry enough influence—even if Trend and Momentum are neutral—to push the netScore out of “Sideways” into a mild bullish or bearish bias.
• Opposing Signals: When Trend is bullish but Momentum turns negative (for example, price continues up but RSI rolls over), the two scores can partially cancel. Market Activity may remain Medium, in which case the netScore lingers near zero (Sideways). The trader can then wait for either a clearer momentum shift or a fresh price-action breakout before committing.
By dynamically recognizing these correlations and adjusting weights, the indicator ensures that:
• When Trend and Momentum align (and volatility supports it), the netScore leaps strongly into Bullish or Bearish.
• When Trend is neutral but Price Action shows an early move in a low-volatility environment, Price Action’s extra weight in the Low Activity State can still produce actionable signals.
---
10. Market Activity State & Its Role (Detailed)
The Market Activity State is not a direct category score—it is an overarching context setter for how heavily to trust Trend, Momentum, or Price Action. Here’s how it is derived and applied:
1. Calculate Four Volatility Sub-Scores:
• BBW: Compare the current band width to its own moving average ± standard deviation. If BBW > (BBW_MA + stdev), assign +1 (high volatility); if BBW < (BBW_MA × 0.5), assign –1 (low volatility); else 0.
• ATR: Compare ATR to its moving average ± standard deviation. A spike above the upper threshold is +1; a contraction below the lower threshold is –1; otherwise 0.
• KCW: Same logic as ATR but around the KCW mean.
• Volume: Compare current volume to its volume MA ± standard deviation. Above the upper threshold is +1; below the lower threshold is –1; else 0.
2. Sum Sub-Scores → Raw Market Activity Score: Range between –4 and +4.
3. Assign Market Activity State:
• High Activity: Raw Score ≥ +2 (at least two volatility metrics are strongly spiking).
• Low Activity: Raw Score ≤ –2 (at least two metrics signal unusually low volatility or thin volume).
• Medium Activity: Raw Score is between –1 and +1 inclusive.
4. Hysteresis for Stability:
• If hysteresis is enabled, a new state only takes hold after two consecutive bars confirm the same High, Medium, or Low label.
• This prevents the Market Activity State from bouncing around when volatility is on the fence.
5. Set Category Weights Based on Activity State:
• High Activity: Trend = 50 %, Momentum = 35 %, Price Action = 15 %.
• Low Activity: Trend = 25 %, Momentum = 20 %, Price Action = 55 %.
• Medium Activity: Use trader’s base weights (e.g., Trend = 40 %, Momentum = 30 %, Price Action = 30 %).
6. Impact on netScore: Because category scores (–3 to +3) multiply by these weights, High Activity amplifies the effect of strong Trend and Momentum scores; Low Activity amplifies the effect of Price Action.
7. Market Context Tooltip: The dashboard includes a tooltip summarizing the current state—e.g., “High activity, trend and momentum prioritized,” “Low activity, price action prioritized,” or “Balanced market, all categories considered.”
---
11. Category Weights: Base vs. Dynamic
Traders begin by specifying base weights for Trend Strength, Momentum, and Price Action that sum to 100 %. These apply only when volatility is in the Medium band. Once volatility shifts:
• High Volatility Overrides:
• Trend jumps from its base (e.g., 40 %) to 50 %.
• Momentum jumps from its base (e.g., 30 %) to 35 %.
• Price Action is reduced to 15 %.
Example: If base weights were Trend = 40 %, Momentum = 30 %, Price Action = 30 %, then in High Activity they become 50/35/15. A Trend score of +3 now contributes 3 × 0.50 = +1.50 to netScore; a Momentum +2 contributes 2 × 0.35 = +0.70. In total, Trend + Momentum can easily push netScore above the +2 threshold on its own.
• Low Volatility Overrides:
• Price Action leaps from its base (30 %) to 55 %.
• Trend falls to 25 %, Momentum falls to 20 %.
Why? When markets are quiet, subtle candle breakouts, doji patterns, and small-range expansions tend to foreshadow the next swing more effectively than raw trend readings. A Price Action score of +3 in this state contributes 3 × 0.55 = +1.65, which can carry the netScore toward +2—even if Trend and Momentum are neutral or only mildly positive.
Because these weight shifts happen only after two consecutive bars confirm a High or Low state (if hysteresis is on), the indicator avoids constantly flipping its emphasis during borderline volatility phases.
---
12. Dominant Category Explained
Within the dashboard, a label such as “Trend Dominant,” “Momentum Dominant,” or “Price Action Dominant” appears when one category’s absolute weighted contribution to netScore is the largest. Concretely:
• Compute each category’s weighted contribution = (raw category score) × (current weight).
• Compare the absolute values of those three contributions.
• The category with the highest absolute value is flagged as Dominant for that bar.
Why It Matters:
• Momentum Dominant: Indicates that the combined force of RSI, Stochastic, and MACD (after weighting) is pushing netScore farther than either Trend or Price Action. In practice, it means that short-term sentiment and speed of change are the primary drivers right now, so traders should watch for continued momentum signals before committing to a trade.
• Trend Dominant: Means ADX, MA slope, and Ichimoku (once weighted) outweigh the other categories. This suggests a strong directional move is in place; trend-following entries or confirming pullbacks are likely to succeed.
• Price Action Dominant: Occurs when breakout/breakdown patterns, Heikin-Ashi candle readings, and range expansions (after weighting) are the most influential. This often happens in calmer markets, where subtle shifts in candle structure can foreshadow bigger moves.
By explicitly calling out which category is carrying the most weight at any moment, the dashboard gives traders immediate insight into why the netScore is tilting toward bullish, bearish, or sideways.
---
13. Oscillator Plot: How to Read It
The “Net Score” oscillator sits below the dashboard and visually displays the smoothed netScore as a line graph. Key features:
1. Value Range: In normal conditions it oscillates roughly between –3 and +3, but extreme confluences can push it outside that range.
2. Horizontal Threshold Lines:
• +2 Line (Bullish threshold)
• 0 Line (Neutral midline)
• –2 Line (Bearish threshold)
3. Zone Coloring:
• Green Background (Bullish Zone): When netScore ≥ +2.
• Red Background (Bearish Zone): When netScore ≤ –2.
• Gray Background (Sideways Zone): When –2 < netScore < +2.
4. Dynamic Line Color:
• The plotted netScore line itself is colored green in a Bullish Zone, red in a Bearish Zone, or gray in a Sideways Zone, creating an immediate visual cue.
Interpretation Tips:
• Crossing Above +2: Signals a strong enough combined trend/momentum/price-action reading to classify as Bullish. Many traders wait for a clear crossing plus a confirmation candle before entering a long position.
• Crossing Below –2: Indicates a strong Bearish signal. Traders may consider short or exit strategies.
• Rising Slope, Even Below +2: If netScore climbs steadily from neutral toward +2, it demonstrates building bullish momentum.
• Divergence: If price makes a higher high but the oscillator fails to reach a new high, it can warn of weakening momentum and a potential reversal.
---
14. Comments and Their Necessity
Every sub-indicator (ADX, MA slope, Ichimoku, RSI, Stochastic, MACD, HH/LL, Heikin-Ashi, Candle Range, BBW, ATR, KCW, Volume) generates a short comment that appears in the detailed dashboard. Examples:
• “Strong bullish trend” or “Strong bearish trend” for ADX/DMI
• “Fast MA above slow MA” or “Fast MA below slow MA” for MA slope
• “RSI above dynamic threshold” or “RSI below dynamic threshold” for RSI
• “MACD histogram positive” or “MACD histogram negative” for MACD Hist
• “Price near highs” or “Price near lows” for HH/LL checks
• “Bullish Heikin Ashi” or “Bearish Heikin Ashi” for HA Doji scoring
• “Large range, trend confirmed” or “Small range, trend contradicted” for Candle Range
Additionally, the top-row comment for each category is:
• Trend: “Highly Bullish,” “Highly Bearish,” or “Neutral Trend.”
• Momentum: “Strong Momentum,” “Weak Momentum,” or “Neutral Momentum.”
• Price Action: “Bullish Action,” “Bearish Action,” or “Neutral Action.”
• Market Activity: “Volatile Market,” “Calm Market,” or “Stable Market.”
Reasons for These Comments:
• Transparency: Shows exactly how each sub-indicator contributed to its category score.
• Education: Helps traders learn why a category is labeled bullish, bearish, or neutral, building intuition over time.
• Customization: If, for example, the RSI comment says “RSI neutral” despite an impending trend shift, a trader might choose to adjust RSI length or thresholds.
In the detailed dashboard, hovering over each comment cell also reveals a tooltip with additional context (e.g., “Fast MA above slow MA” or “Senkou A above Senkou B”), helping traders understand the precise rule behind that +1, 0, or –1 assignment.
---
15. Real-Life Example (Consolidated)
• Instrument & Timeframe: Bitcoin (BTCUSD), 1-hour chart.
• Current Market Activity: BBW and ATR both spike (+1 each), KCW is moderately high (+1), but volume is only neutral (0) → Raw Market Activity Score = +2 → State = High Activity (after two bars, if hysteresis is on).
• Category Weights Applied: Trend = 50 %, Momentum = 35 %, Price Action = 15 %.
• Trend Sub-Scores:
1. ADX = 25 (above threshold 20) with +DI > –DI → +1.
2. Fast MA (20-period) sits above Slow MA (50-period) → +1.
3. Ichimoku: Senkou A > Senkou B → +1.
→ Trend Score = +3.
• Momentum Sub-Scores:
4. RSI = 75 (above its moving average +1 stdev) → +1.
5. MACD histogram = +0.15 → +1.
6. Stochastic %K = 50 (mid-range) → 0.
→ Momentum Score = +2.
• Price Action Sub-Scores:
7. Price is not within 1 % of the 20-period high/low and slope = positive → 0.
8. Heikin-Ashi body is slightly larger than stdev over last 5 bars with haClose > haOpen → +1.
9. Candle range is just above its dynamic upper bound but trend is already captured, so → +1.
→ Price Action Score = +2.
• Calculate netScore (before smoothing):
• Trend contribution = 3 × 0.50 = 1.50
• Momentum contribution = 2 × 0.35 = 0.70
• Price Action contribution = 2 × 0.15 = 0.30
• Raw netScore = 1.50 + 0.70 + 0.30 = 2.50 → Immediately classified as Bullish.
• Oscillator & Dashboard Output:
• The oscillator line crosses above +2 and turns green.
• Dashboard displays:
• Trend Regime “BULLISH,” Trend Score = 3, Comment = “Highly Bullish.”
• Momentum Regime “BULLISH,” Momentum Score = 2, Comment = “Strong Momentum.”
• Price Action Regime “BULLISH,” Price Action Score = 2, Comment = “Bullish Action.”
• Market Activity State “High,” Comment = “Volatile Market.”
• Weights: Trend 50 %, Momentum 35 %, Price Action 15 %.
• Dominant Category: Trend (because 1.50 > 0.70 > 0.30).
• Overall Score: 2.50, posCount = (three +1s in Trend) + (two +1s in Momentum) + (two +1s in Price Action) = 7 bullish signals, negCount = 0.
• Final Zone = “BULLISH.”
• The trader sees that both Trend and Momentum are reinforcing each other under high volatility. They might wait one more candle for confirmation but already have strong evidence to consider a long.
---
• .
---
Disclaimer
This indicator is strictly a technical analysis tool and does not constitute financial advice. All trading involves risk, including potential loss of capital. Past performance is not indicative of future results. Traders should:
• Always backtest the “Market Zone Analyzer ” on their chosen symbols and timeframes before committing real capital.
• Combine this tool with sound risk management, position sizing, and, if possible, fundamental analysis.
• Understand that no indicator is foolproof; always be prepared for unexpected market moves.
Goodluck
-BullByte!
---

[blackcat] L2 Hann Ehanced DMILevel: 2
Background
Among the many indicators, it can be said that DMI is the only "super turning" indicator. This indicator can alone send out risk warning signals when extreme market conditions occur in the stock market, helping us to solve some problems.
If we can operate according to the instructions of DMI, firstly, we can avoid the mistake of buying stocks at the head. Secondly, in the process of falling fear of the market, we can follow the direction signal sent by DMI and catch every time on the way down. Opportunity to rebound to unwind.
If you look at the diagram of the DMI, you will think it is very complicated, because there are four lines in its diagram, and they are intertwined, and it is difficult to distinguish the complex signals in it. But don't worry about its complex structure, we will fully dissect this indicator.
Function
These four lines are: PDI, MDI, ADX and ADXR. The scale of the table is from 0-100, which means from very weak to very strong. The PDI curve and MDI curve on some software are called +DI curve and -DI curve , all have the same meaning.
PDI: Represents the position of multiple parties in the market.
In market movements, the higher the PDI, the stronger the current market. On the contrary, it is a weak market. The A-share market is easy to go to extremes. Therefore, we can see that in the past A-share market, the PDI sometimes fell to near zero, and at this time, it often indicated that a rebound and uptrend was about to start.
MDI: Represents the position of the bears in the market.
In the market movement, the higher the MDI goes, the weaker the current market is, and vice versa, it is a strong market. Before a big bull market comes, we can see the MDI drop to a position close to zero, and at this time, the bears in the market have no power to fight back.
The relationship between PDI and MDI:
In the operation of the market, PDI and MDI are intertwined with each other. If the PDI is above the MDI, the market at this time is a strong market. The MDI is above the PDI, which is a bear market. The closer the distance between the two, the market is in a stalemate of consolidation. On the contrary, the further apart the two lines are, the more obvious the unilateral nature of the market is, whether it is a bull market or a bear market. The so-called unilateral market means that there is no midway adjustment when it rises, and there is no rebound correction when it falls.
ADX: Fast steering pullback.
The difference between ADX and other analysis indicators is that whether it is rising or falling, as long as there is a unilateral market, it runs upwards, not like other indicators, the strong market runs upwards and the weak market runs downwards.
The thread is almost entwined with PDI and MDI in general market movement, which makes no sense at this time. However, once the market breaks out of the market and starts to go to extremes, whether the market is rising or falling, ADX will start to run upwards. At this time, ADX has a clear meaning, because DMI has begun to issue early warning of impending turn!
ADXR: slow pull back.
This line is matched to ADX and is a moving average of ADX values. When ADX goes up, ADXR goes up with it, just slower.
When a round of rapid decline ends, it usually needs to be corrected by a rebound, and ADX will take the lead in turning up. Once it crosses with ADXR, it is regarded as an effective breakthrough.
Numerical division. I set an input threshold for HEDMI, and users can set the optimal threshold to buy and sell according to different TFs.
When PDI crosses the threshold, no matter how strong the bull market is, we must beware of risks from happening at any time.
In order to distinguish more clearly, I slightly modified the formula of the system, and when this happens, the indicator will issue a green warning label, so as to avoid risks in time.
Comprehensive use of four lines:
If the four lines in the steering indicator DMI are intertwined below 50, it usually means that the market is in a state of mild consolidation at this time. The DMI indicator at this time is useless because it does not generate a strong pullback force. Don't worry about an unexpected turnaround in the market. As for the consolidation, it's not a turnaround, it's a breakout.
When PDI and MDI gradually separate, at this time, ADX and ADXR will also rise. At this time, the DIM that is usually messy like twine will be clearly separated. When rising, PDI rises along with ADX and ADXR, while MDI sinks weakly. On the contrary, when the market starts to fall, MDI will rise along with ADX and ADXR, and PDI will sink helplessly. At this time, the DMI will be like a "tiger's mouth", gradually opening its bloody mouth. The bigger the opening, the more lethal the bite.
Here comes a tactic, or technical trend, called double hooves, that is, PDI and MDI split, ADX and ADXR upward to produce golden forks, PDI and MDI are like the double front hooves of a horse, ADX and ADXR The golden fork is like the rear hooves of a steed ready to take off, and this trend of the four lines is like the four legs of a steed that is about to run.
If you think it is too complicated to look at DMI like this, then I can tell you the easiest way to judge, that is, just look at the PDI line. When the PDI line falls below 10, boldly buy the dip, because it is a dip, so you need to calculate the rebound At this time, combined with the golden section theory I often talk about, you can easily find the selling point by making the golden section of the downward trend for the previous trend.
This kind of bottom-hunting method uses the golden section theory, and basically there will be no losses. Remember that one thing is not to be greedy and strictly enforce discipline. This is bottom-hunting, and advancing with both hooves is chasing up. The two styles are different, and the operation styles are different. You also need to explore more in actual combat. Any kind of trick, if you practice it proficiently, it is a unique trick.
Remark
Hanning Window Enhanced DMI
Free and Open Source Indicator

bitradercrossEl indicador bitradercross, es un indicador basado en el Índice Medio de Movimiento Direccional ( ADX ) es una herramienta de análisis técnico usada para medir la fuerza de la tendencia. El indicador direccional positivo ( DI ) y el indicador direccional negativo ( -DI ) acompañan a la línea ADX . realzando la dirección de la tendencia.
Usados en conjunto forman un sistema de trading que es capaz de determinar tanto la dirección como la fuerza de la tendencia. El indicador consiste en tres líneas: la propia ADX (línea azul), una línea DI (línea verde), y una línea -DI (línea roja). El DI mide la fuerza de la tendencia alcista, mientras que el -DI mide la intensidad del movimiento bajista. La línea ADX muestra la fuerza de la tendencia en general creciendo tanto en las tendencias alcistas como bajistas.
Cuando el DI está por encima del -DI , se dice que los alcistas tienen el dominio direccional. De forma alternativa, cuando el -DI es más alto que el DI , el dominio direccional pertenece a los bajistas.
Es importante entender que el ADX (línea azul) muestra solo la fuerza de la tendencia y no la dirección de la tendencia. La dirección de la tendencia puede en cambio determinarse mirando al DI y el -DI (líneas roja y verde).
¿Cómo usarlo en el trading?
Operar con la tendencia reduce los riesgos e incrementa los beneficios potenciales. Es por esto que muchos traders prefieren consultar la fuerza de la tendencia con ayuda del ADX antes de invertir su dinero. Hay dos formas principales de usar el indicador:
El Cruce de DI
Cuando las líneas direccionales del positivo y negativo se cruzan, normalmente significa que la tendencia está cambiando. Esta información puede usarse para determinar puntos de entrada óptimos. Para los inversores que utilicen este sistema de trading, las señales son las siguientes:
(Compra) cuando el DI cruce el -DI , es mas efectivo, mas fuerte cuando toca o cruza la linea amarilla solida en el nivel de 27 y la tendencia general sea alcista.
El disparo se da en la linea de 20 punteada.
(Venta) cuando el -DI cruce el DI , es mas efectivo, más fuerte cuando toca o cruza la linea amarilla solida en el nivel de 27 y la tendencia sea bajista general sea bajista.
Valor de Fuerza Tendencia ADX
0-20 Tendencia Ausente o Débil
21-26 Disparo
27-50 Tendencia Fuerte
50-75 Tendencia muy Fuerte
75-100 Tendencia Extremadamente Fuerte
El bitradercross es un indicador de análisis técnico verdaderamente único, que combinado con otros indicadores, puede convertirse en la estrategia de trading definitiva en manos de un trader.
Recomendado para scalping en temporalidad de 5 min
swing day 1hora. Esta configurado para una operacion optima.
Acompañelo con el indicador bitraderScalper.
Con mucho cariño Bitrader4.0
_________________________________
The bitradercross indicator, is an indicator based on the Mean Directional Movement Index ( ADX ) is a technical analysis tool used to measure the strength of the trend. The positive directional indicator ( DI ) and the negative directional indicator ( -DI ) accompany the ADX line. enhancing the direction of the trend.
Used together they form a trading system that is able to determine both the direction and strength of the trend. The indicator consists of three lines: the ADX itself (blue line), a DI line (green line), and a -DI line (red line). The DI measures the strength of the uptrend, while the -DI measures the intensity of the bearish movement. The ADX line shows the strength of the overall trend growing in both bullish and bearish trends.
When the DI is above the -DI , it is said that the bulls have the directional domain. Alternatively, when the -DI is higher than the DI , the directional domain belongs to the bears.
It is important to understand that the ADX (blue line) shows only the strength of the trend and not the direction of the trend. The direction of the trend can instead be determined by looking at the DI and the -DI (red and green lines).
How to use it in trading?
Operating with the trend reduces the risks and increases the potential benefits. This is why many traders prefer to consult the strength of the trend with the help of the ADX before investing their money. There are two main ways to use the indicator:
1) The Cross of DI
When the directional lines of the positive and negative intersect, it usually means that the trend is changing. This information can be used to determine optimal entry points. For investors who use this trading system, the signals are the following:
(Buy) when the DI crosses the -DI , it is more effective, stronger when it touches or crosses the solid yellow line at the level of 27 and the general trend is bullish .
The shot is given in the line of 20 dashed.
(Sale) when the -DI crosses the DI , it is more effective, stronger when it touches or crosses the solid yellow line at the level of 27 and the general bearish trend is bearish .
Strength Value ADX Trend
0-20 Absent or Weak Trend
21-26 Shot
27-50 Strong Trend
50-75 Very Strong Trend
75-100 Extremely Strong Trend
The bitradercross is a truly unique indicator of technical analysis , which combined with other indicators, can become the definitive trading strategy in the hands of a trader.
Recommended for scalping 5-minute and 1 hour.
It is configured for an optimal operation.
Accompany it with the bitraderScalper indicator.
With love Bitrader4.0

Advanced DMI [NexusSignals]Overview
The Advanced DMI is a enhanced version of the classic Directional Movement Index (DMI) and Average Directional Index (ADX) indicator, designed to provide traders with deeper insights into trend strength, direction, and momentum. It combines visual plots, a customizable data table, and multiple alert conditions to help identify bullish/bearish trends, consolidations, and potential reversals. This indicator is ideal for trend-following strategies, scalping, or swing trading across various timeframes and assets.
Key enhancements include:
A trend strength metric that quantifies bullish/bearish dominance.
A dynamic table displaying real-time and historical DMI/ADX values, with color-coded signals and buy/sell pressure percentages.
Visual fills and arrows for quick trend interpretation.
Built-in alerts for key crossovers, threshold breaches, and consolidation phases.
The indicator calculates and display:
+DI (Plus Directional Indicator): Measures upward price movement strength.
-DI (Minus Directional Indicator): Measures downward price movement strength.
ADX: Gauges overall trend strength (higher values indicate stronger trends).
Trend Strength: A normalized score computed as ((+DI - -DI) / (+DI + -DI)) * ADX, ranging from negative (bearish) to positive (bullish). This helps quantify trend bias.
Buy/Sell %: Candle body analysis showing the percentage of buyer (close above low) vs. seller (high above close) control in the current bar.
Plots include:
Strength Histogram : Color-coded columns (green for bullish, red for bearish) to visualize trend intensity.
ADX Line : White line showing trend strength, with arrows indicating rising/falling.
+DI and -DI Lines: Green (+DI) and red (-DI) lines with conditional fills above the 15 threshold for strong trends.
Horizontal threshold lines at 15 (consolidation threshold) and 25 (strong trend threshold).
The table (optional) summarizes data for the current candle, previous candle, and two candles ago, including arrows for directional changes and color highlights for quick scans.
Inputs
General Settings:
DMI Length (default: 14): Period for +DI/-DI calculation.
ADX Smoothing (default: 14): Smoothing period for ADX.
ADX Consolidation Threshold (default: 15): Below this, suggests sideways market.
ADX Stronger Trend Threshold (default: 25): Above this, indicates a robust trend.
Threshold for Strong Bullish/Bearish DMI Strength (defaults: 10 / -10): Levels for strength alerts.
Table Settings:
Show Table? (default: true): Toggle the data table on/off.
Table Text Color, Header Color, Text Size, Position: Customize appearance and placement (e.g., middle_right).
How It Works
Interpretation
Bullish Signals: +DI > -DI, rising +DI (↑ arrow), Strength > 0 (green histogram), Buy% > Sell%. Look for ADX > 25 for confirmed uptrends.
Bearish Signals: -DI > +DI, rising -DI (↑ arrow), Strength < 0 (red histogram), Sell% > Buy%. ADX rising above thresholds strengthens the downtrend.
Consolidation: Both +DI and -DI < 20, ADX ≤ 15 (blue fill possible). Use this to avoid choppy markets.
Crossovers: +DI crossing above -DI suggests bullish reversal; opposite for bearish.
Fills: Areas above 15 highlight dominant trends (green for bullish, maroon for bearish).
Combine with price action or other indicators like RSI for better accuracy. Works on any timeframe, but test on historical data for your strategy.
Alerts
The indicator includes 12 built-in alert conditions for automation:
Strength crossing above/below 0 or bullish/bearish thresholds.
+DI/-DI crossovers (bullish/bearish).
ADX crossing above strong threshold.
+DI/-DI crossing above 25 or below 15.
Consolidation detection (low ADX with flat DI lines).
Set up alerts in TradingView by selecting the condition from the dropdown.
Usage Tips
Enable the table for quick multi-candle analysis without scrolling the chart.
Customize colors and positions to fit your workspace.
Backtest on your favorite assets (e.g., stocks, forex, crypto) to optimize thresholds.
For faster loading on large datasets, the script is optimized to update the table only on the last bar.
This indicator is provided by NexusSignals for educational and trading purposes. Always use risk management and verify signals. Feedback welcome!

Swing Trade TarayıcıSwing Trade Scanner (v6) User Guide
1. Purpose:
This TradingView indicator (written in Pine Script v6) is designed to help identify swing trading opportunities. It calculates an overall trend strength and direction score by combining multiple technical analyses for up to 20 financial assets (stocks, cryptocurrencies, forex, etc.) that you specify. It presents the results in a customizable table, allowing you to quickly scan the market.
2. Analyses Used and Their Roles:
By default, the indicator uses the following 4 main technical analyses:
EMA Crossover (Default: 9/21): Used to capture short-term trend direction and potential momentum shifts. When the fast EMA (9) crosses above the slow EMA (21), it's considered a bullish signal; when it crosses below, it's a bearish signal. It's often one of the main entry/exit triggers.
RSI (Relative Strength Index - Default: 14): Measures the speed of price movements to identify overbought (OB) and oversold (OS) conditions. Reversals from the OB zone can signal potential downturns, while reversals from the OS zone can signal potential upturns. It also provides insight into the strength of the momentum.
MACD (Moving Average Convergence Divergence - Default: 12, 26, 9): A trend-following momentum indicator. The relationship between the MACD line and the signal line (crossovers) and the state of the histogram (position relative to the zero line) are used to confirm momentum shifts and trend strength.
ADX/DI (Average Directional Index - Default: 14, 14): Measures the strength (ADX) and direction (+DI/-DI lines) of a trend. Its main role is to filter signals from other indicators. A trend is considered to exist if the ADX is above a certain threshold (e.g., 25). +DI above -DI indicates an uptrend, and the reverse indicates a downtrend.
3. Scoring System:
The indicator calculates an individual score for each analysis and then combines these scores using weights you define to create a final Trend Score:
Individual Scores: Each analysis (EMA, RSI, MACD, ADX/DI) generates a decimal score between -1.0 (Strong Negative/Bearish) and +1.0 (Strong Positive/Bullish) based on its own rules. For example, RSI might score +1.0 if oversold, -1.0 if overbought, and 0.0 if neutral. MACD and ADX/DI scores can also take intermediate values reflecting both direction and strength (e.g., ±1.0, ±0.6, ±0.3, 0.0).
Weighting: In the settings, you can assign a weight (between 0.0 and 1.0) to each analysis, determining how much it influences the final score. For instance, you might give EMA crossover a higher weight and use RSI with a lower weight.
Total Score: The individual scores of the active analyses are multiplied by their assigned weights and summed up. This total is then divided by the sum of the weights of the active analyses to obtain a final, normalized Trend Score between -1.0 and +1.0. This score represents the combined view of all analyses.
4. Trend Determination:
The calculated final Trend Score is classified into an overall TREND status based on threshold values you set in the settings:
S.UP (Strong Up): Score > Strong Up Threshold (Default: 0.70)
UP: Up Threshold < Score <= Strong Up Threshold (Default: 0.35 < Score <= 0.70)
NEUTRAL: Down Threshold <= Score <= Up Threshold (Default: -0.35 <= Score <= 0.35)
DOWN: Strong Down Threshold <= Score < Down Threshold (Default: -0.70 <= Score < -0.35)
S.DOWN (Strong Down): Score < Strong Down Threshold (Default: -0.70)
This classification allows you to see at a glance which assets have strong trend potential.
5. Table Structure and Meanings:
The indicator displays the results in a table with the following columns:
TICKER: The symbol of the analyzed asset (abbreviated).
TREND: The overall trend status determined by the total score (S.UP, UP, NEUTRAL, DOWN, S.DOWN). The background color of this column also reflects this overall trend (Dark Green, Green, Gray, Red, Dark Red).
SCORE: The calculated weighted total score (between -1.00 and +1.00, with two decimal places). The background color of this column also reflects the overall trend.
EMA: Shows the result of only the EMA 9/21 analysis.
▲: EMA(9) > EMA(21) (Green Background)
▼: EMA(9) < EMA(21) (Red Background)
N: Neutral (Gray Background)
-: Analysis disabled or no data (Pale Gray Background)
RSI: Shows the result of only the RSI analysis.
OS: Oversold (RSI < 30) (Green Background)
M+: Mid Positive (30 <= RSI < 45) (Light Green/Lime Background)
N: Neutral (45 <= RSI <= 55) (Gray Background)
M-: Mid Negative (55 < RSI <= 70) (Orange Background)
OB: Overbought (RSI > 70) (Red Background)
-: Analysis disabled or no data (Pale Gray Background)
MACD: Shows the result of only the MACD analysis.
S+: Strong Positive (MACD > Signal AND Histogram > 0) (Green Background)
M+: Mid Positive (MACD > Signal BUT Histogram < 0) (Light Green/Lime Background)
N: Neutral (Other cases) (Gray Background)
M-: Mid Negative (MACD < Signal BUT Histogram > 0) (Orange Background)
S-: Strong Negative (MACD < Signal AND Histogram < 0) (Red Background)
-: Analysis disabled or no data (Pale Gray Background)
ADX/DI: Shows the result of only the ADX/DI analysis.
S+: Strong Uptrend (ADX > 40 AND +DI > -DI) (Green Background)
M+: Mid Uptrend (25 < ADX <= 40 AND +DI > -DI) (Light Green/Lime Background)
W: Weak Trend (ADX <= 25) (Gray Background)
M-: Mid Downtrend (25 < ADX <= 40 AND -DI > +DI) (Orange Background)
S-: Strong Downtrend (ADX > 40 AND -DI > +DI) (Red Background)
-: Analysis disabled or no data (Pale Gray Background)
6. Settings (Inputs):
You can customize the indicator's behavior using the following settings:
General Settings:
Analysis Timeframe: Select the timeframe for the scans (Leave blank to use the chart timeframe).
Auto Adjust Parameters and Weights: If checked, predefined parameters and weights based on the selected timeframe (1h, 4h, 1D, 1W) are used. If unchecked, or if an unsupported timeframe is selected, the manual settings below apply.
Strong/Normal Up/Down Thresholds: Adjust the score thresholds used to determine the TREND column.
Analysis Settings (Separate Group for Each Analysis):
Enable ... Analysis: Check to include the respective analysis in the score.
... Weight (Manual): If auto-adjust is off, set the weight of this analysis in the total score.
... Period/Level (Manual): If auto-adjust is off, adjust the parameters (period, level, etc.) of the respective indicator.
Symbols (1-10):
Checkbox: Check to include the respective symbol in the scan.
Text Box: Enter the symbol of the asset you want to analyze (e.g., "NASDAQ:AAPL", "BINANCE:BTCUSDT").
Table Settings:
Table Position: Choose where the table appears on the chart.
Cell Width: Adjust the width of the table cells.
Text Size: Select the general size of the text in the table (individual analysis columns are usually shown one size smaller).
7. How to Use:
Add the indicator to your TradingView chart.
Enter the indicator settings.
In the Symbols section, enter the symbols of the assets you want to analyze and check the boxes next to them.
In the General Settings section, select your desired Analysis Timeframe.
Decide whether the Auto Adjust Parameters and Weights option should be checked. If not, adjust the manual parameters and weights for each indicator in the Analysis Settings section according to your strategy.
Examine the table:
The TREND and SCORE columns give you a general overview. Focus on strong signals (S.UP, S.DOWN) or states that have just crossed thresholds (UP, DOWN).
The EMA, RSI, MACD, ADX/DI columns allow you to see in detail which analyses influenced the overall score. You can track confirming or conflicting signals here.
Combine these scan results with other rules of your swing trading strategy (support/resistance, patterns, risk management, etc.) to make trading decisions.
8. Important Notes:
This indicator does not constitute financial advice. It is merely a tool that combines technical analysis tools to help you scan the market.
The default parameters and weights in the indicator settings are for general use. For best results, it is strongly recommended that you optimize these settings by backtesting them on historical data according to your own strategy, the assets you trade, and market conditions.
No technical indicator or system generates 100% accurate signals. Always apply risk management principles and do not trade with money you cannot afford to lose.
I hope this guide helps you use the indicator effectively!

Aj's DikFat Adjusted ADXRAj's DikFat Adjusted ADXR
This indicator is designed to plot the Average Directional Index (ADX) and Average Directional Movement Rating (ADXR) on the chart. The ADX and ADXR are both used to measure the strength of a trend in the market. The script allows you to customize several parameters, including the ADX Length and the Moving Average Method used for smoothing the directional movement indicators.
Key Features:
- ADX Length : Defines the number of periods over which the ADX is calculated. This value can be adjusted by the user to suit different trading styles and timeframes.
- Moving Average Method : Choose between several smoothing methods, including Simple Moving Average (SMA), Exponential Moving Average (EMA), Wilder's Moving Average, Weighted Moving Average (WMA), Hull Moving Average (HMA), or a Super Smooth Moving Average.
- Directional Indicators : The script calculates the +DI and -DI, which represent the positive and negative directional indicators respectively. These are then used to calculate the ADX.
- ADXR : The ADXR is calculated as the average of the current ADX value and the ADX value from 14 periods ago, providing a more smoothed representation of the trend strength.
How Traders Use ADX and ADXR:
- ADX : A rising ADX indicates an increasing trend strength, while a falling ADX suggests a weakening trend. A value above 25 is often considered an indication of a strong trend.
- ADXR : This indicator smooths the ADX over time, helping traders identify persistent trends. The ADXR can help filter out noise and provide a clearer picture of the trend's health.
Please note that this script and its indicators are designed to be used as tools for analysis, not as guarantees of market outcomes. Adjustments to the moving average method or ADX length can change the behavior of the indicators based on market conditions.
Market Movement IdentifierOverview : Market Movement Identifier (MMI) uses DMI (Directional Movement Index) Indicator's logic and enhance its capabilities and visualisation. It shows 3 type of overlays over chart - black, green and red which signifies current market trend.
What is DMI ? :
The Directional Movement Index (DMI) is a technical analysis indicator used to assess the strength and direction of a trend in the price of an asset. Developed by J. Welles Wilder, the DMI is part of a broader category of indicators known as oscillators. The DMI comprises three lines: Positive Directional Indicator (+DI), Negative Directional Indicator (-DI), and the Average Directional Index (ADX).
Here's a brief overview of each component:
1. Positive Directional Indicator (+DI): Measures the strength of upward price movement. It is calculated based on the difference between the current high and the previous high.
2. Negative Directional Indicator (-DI): Measures the strength of downward price movement. It is calculated based on the difference between the previous low and the current low.
3. Average Directional Index (ADX): Represents the overall strength of the price movement, regardless of direction. It is a smoothed average of the +DI and -DI values. A rising ADX indicates a strengthening trend, while a falling ADX suggests a weakening trend.
Traders use the DMI to identify potential trends, assess their strength, and determine whether a trend is gaining or losing momentum. The crossover of +DI and -DI can signal potential changes in the trend direction. Additionally, the ADX helps traders gauge the overall strength of the trend. Please note DMI is freely available to use, you must try that before paying for MMI.
What is MMI and how is it different from DMI ? :
Frankly, It is not. If you know how to use DMI and play around with its variables and settings to get the perfect desired result then you are good anyway. But if you want a little bit extra visualisation and accuracy then MMI indicator is for you.
The MMI Indicator which we have built over DMI uses :
1. Unique variables and settings - Instead of using default variable values, we have modified them a bit for aligning it perfectly with our desired result.
2. New variables - We have added few new variables which act as threshold values.Calculations are being done using these variables to find out bool conditions true or false.
3. Background Colours - Using the bool conditions we show 3 different background colours on chart, which helps user in differentiating type of market trend.
How does MMI work? :
Let's break down the key components and logic behind this indicator:
1. DMI (Directional Movement Index) Calculation: The code calculates the DMI using the Wilder's smoothing method. It uses the true range (trur) and calculates the positive directional movement (plusDM) and negative directional movement (minusDM). The smoothed values of these are then used to compute the Plus Directional Indicator (plus) and Minus Directional Indicator (minus).
2. ADX (Average Directional Index) Calculation: The ADX is computed using the smoothed Plus and Minus Directional Indicators. The ADX is a trend strength indicator, and in this script, it is smoothed using the lensig parameter.
3. Setting Thresholds for ADX: tlow and thigh are user-defined thresholds for the ADX. If the ADX is within these thresholds, it proceeds to further conditions. This helps filter out noise and focus on significant trends.
4. Determining Market Movement: Based on the conditions of the Plus and Minus Directional Indicators, the script assigns a color to currentColor. If Plus is greater than Minus, it assigns a green color; otherwise, it assigns a red color. This suggests whether the market movement is bullish or bearish.
Setting Background Color: Finally, the background color of the chart is set to currentColor. This provides a visual representation of the market movement identified by the script.
Comparison with DMI Indicator:
This script can be considered an improvement or modification of the DMI (Directional Movement Index) indicator. It incorporates user-defined thresholds for the ADX and assigns background colors to chart to indicate market direction. The idea is to make it more visually intuitive and customizable for traders. The flexibility of adjusting parameters allows traders to fine-tune the sensitivity of the indicator to different market conditions.
Why it is worth paying for:
As mentioned earlier this indicator is built over freely available DMI indicator. The modifications which we have done with variables and visualization of DMI indicator makes it worth.
The indicator may be considered valuable for traders who appreciate a visual representation of market movements based on ADX. Normal DMI doesn't prvoide that, it displays three lines at bottom of chart like RSI. Neither does it provides alert or a visual that a threshold has been crossed. That's why to help traders see all conditions and trend status on background of chart itself we have created MMI which has
1. The customization options and visual clarity could enhance decision-making for those who prefer a more tailored approach.
2. Traders willing to pay for this indicator may find it useful in complementing their existing analysis and strategy, especially if they prioritize ADX-related insights in their trading decisions.
How to use MMI ?
Refer this snapshot for understand content below -
So the three overlays signifies something. As explained earlier the overlays are displayed checking if adx is > or < a threshold value and checking +di > or < -di. Also the interpretations is just a probability not a confirmation. To be sure, always follow price action.
Black overlay - No trading zone. This means market might be in consolidation range, no strong trend right now or the trend is so strong that it can reverse any time. So it's better not to trade in black zones.
Red overlay - Probable Bearish Trend. This means market might be in good trend and favourable direction might be in bearish or short side.
Green overlay - Probable Bullish Trend. This means market might be in good trend and favourable direction might in bullish or long side.
Preferred Timeframe : - Although as its a mathematical calculation based indicator which works on DMI's logic, the modifications which we have done on it works best in 5 minute timeframe.
Remember these visualisations of colors is based on mathematical calculations, they dont mean full 100% confirmation that market will go in said direction. It's just a probability and traders can use their research and price action to take best decision.
IMPORTANT : This indicator tells you these overlays and results based on mathematical calculations which you can check in DMI indicator logic. As Stock markets are dynamic in nature, no indicator is a magic indicator which will give you 100% accurate results on one click. You still have to use price action for best results.
DISCLAIMER : This indicator isn't a get rich quick scheme, neither it can provide 100% accurate results. It is meant to be used as an aid to Price Action Trading and proper risk management.

Dynamo
╭━━━╮
╰╮╭╮┃
╱┃┃┃┣╮╱╭┳━╮╭━━┳╮╭┳━━╮
╱┃┃┃┃┃╱┃┃╭╮┫╭╮┃╰╯┃╭╮┃
╭╯╰╯┃╰━╯┃┃┃┃╭╮┃┃┃┃╰╯┃
╰━━━┻━╮╭┻╯╰┻╯╰┻┻┻┻━━╯
╱╱╱╱╭━╯┃
╱╱╱╱╰━━╯
Overview
Dynamo is built to be the Swiss-knife for price-movement & strength detection, it aims to provide a holistic view of the current price across multiple dimensions. This is achieved by combining 3 very specific indicators(RSI, Stochastic & ADX) into a single view. Each of which serve a different purpose, and collectively provide a simple, yet powerful tool to gauge the true nature of price-action.
Background
Dynamo uses 3 technical analysis tools in conjunction to provide better insights into price movement, they are briefly explained below:
Relative Strength Index(RSI)
RSI is a popular indicator that is often used to measure the velocity of price change & the intensity of directional moves. RSI computes the relative strength of the current price by comparing the security’s bullish strength versus bearish strength for a given period, i.e. by comparing average gain to average loss.
It is a range bound(0-100) variable that generates a bullish reading if average gain is higher, and a bullish reading if average loss is higher. Values over 50 are generally considered bullish & values less than 50 indicate a bearish market. Values over 70 indicate an overbought condition, and values below 30 indicate oversold condition.
Stochastic
Stochastic is an indicator that aims to measure the momentum in the market, by comparing most recent closing price of the security to its price range for a given period. It is based on the assumption that price tends to close near the recent high in an up trend, and it closes near the recent low during a down trend.
It is also range bound(0-100), values over 80 indicate overbought condition and values below 20 indicate oversold condition.
Average Directional Index(ADX)
ADX is an indicator that can quantify trend strength, it is derived from two underlying indices, known as Directional Movement Index(DMI). +DMI represents strength of the up trend, and -DMI represents strength of the down trend, and ADX is the average of the two.
ADX is non-directional or trend-neutral, which means, it does not follow the direction of the price, instead ADX will rise only when there is a strong trend, it does not matter if it’s an up trend or a down trend. Typical ranges of ADX are 25-50 for a strong trend, anything below 25 is considered as no trend or weak trend. ADX can frequently shoot upto higher values, but it generally finds exhaustion levels around the 60-75 range.
About the script
All these indicators are very powerful tools, but just like any other indicator they have their limitations. Stochastic & ADX can generate false signals in volatile markets, meaning price wouldn’t always follow through with what’s being indicated. ADX may even fail to generate a signal in less volatile markets, simply because it is based on moving averages, it tends to react slower to price changes. RSI can also lose it’s effectiveness when markets are trending strong, as it can stay in the overbought or oversold ranges for an extended period of time.
Dynamo aims to provide the trader with a much broader perspective by bringing together these contrasting indicators into a single simplified view. When Stochastic becomes less reliable in highly volatile conditions, one can cross validate their deduction by looking at RSI patterns. When RSI gets stuck in overbought or oversold range, one can refer to ADX to get better picture about the current trend. Similarly, various combinations of rules & setups can be formulated to get a more deterministic view, when working with either of these indicators.
There many possible use cases for a tool like this, and it totally depends on how you want to use it. An obvious option is to use it to trigger signals only after it has been confirmed by two or more indicators, for example, RSI & Stochastic make a great combination for cross-over or cross-under strategies. Some of the other options include trend detection, strength detection, reversals or price rejection points, possible duration of a trend, and all of these can very easily be translated into effective entry and exit points for trades.
How to use it
Dynamo is an easy-to-use tool, just add it to your chart and you’re good to start with your market analysis. Output consists of three overlapping plots, each of which tackle price movement from a slightly different angle.
Stochastic: A momentum indicator that plots the current closing price in relation to the price-range over a given period of time.
Can be used to detect the direction of the price movement, potential reversals, or duration of an up/down move.
Plotted as grey coloured histograms in the background.
Relative Strength Index(RSI): RSI is also a momentum indicator that measures the velocity with which the price changes.
Can be used to detect the speed of the price movement, RSI divergences can be a nice way to detect directional changes.
Plotted as an aqua coloured line.
Average Directional Index(ADX): ADX is an indicator that is used to measure the strength of the current trend.
Can be used to measure how strong the price movement is, both up and down, or to establish long terms trends.
Plotted as an orange coloured line.
Features
Provides a well-rounded view of the market movement by amalgamating some of the best strength indicators, helping traders make better informed decisions with minimal effort.
Simplistic plots that aim to convey clean signals, as a result, reducing clutter on the chart, and hopefully in the trader's head too.
Combines different types of indicators into a single view, which leads to an optimised use of the precious screen real-estate.
Final Note
Dynamo is designed to be minimalistic in functionality and in appearance, as it is being built to be a general purpose tool that is not only beginner friendly, but can also be highly-configurable to meet the needs of pro traders.
Thresholds & default values for the indicators are only suggestions based on industry standards, they may not be an exact match for all markets & conditions. Hence, it is advisable for the user to test & adjust these values according their securities and trading styles.
The chart highlights one of many possible setups using this tool, and it can used to create various types of setups & strategies, but it is also worth noting that the usability & the effectiveness of this tool also depends on the user’s understanding & interpretation of the underlying indicators.
Lastly, this tool is only an indicator and should only be perceived that way. It does not guarantee anything, and the user should do their own research before committing to trades based on any indicator.

Zettt's Directional Movement IndexThis is a modified version of the standard DMI/ADX indicator by Welles Wilder. It makes the most important parts of the standard version more prominent to help traders better identify emerging trends, and judge markets.
First of all the dominant Direction Index, +DI or -DI (green and red), is emphasized with a different color, but only if they break the ADX Weak Threshold .
There is a setting for "ADX Weak Threshold". This is the general trend strength meter. It determines at which level one of the Directional Indexes are emphasized, and it serves as threshold level at which the "Long ADX" is emphasized too.
Trader should think of Long ADX (yellow) as an ability to judge higher timeframe trend, on lower timeframes, which is determined by the ADX Multiplier. For example, while viewing a 4h chart, and an ADX Multiplier of 4, Long ADX acts like an ADX on the 12h (4h * 4). Furthermore Long ADX is also only emphasized in color once it breaches the ADX Weak Threshold. Therefore helping to give further confluence, e.g. pyramiding into a bigger-sized trade when a higher timeframe trend is strengthening.
Last but not least the (normal) ADX (purple) color is emphasized when its value is strengthening. More prominent color = strengthening trend.
Additional this DMI provides 4 "trend strength zones". These help to easier judge trend exhaustion, and spot potential reversals earlier.
The standard DMI setting is changed from 14 to 6 in this version. Reducing this setting also requires reducing the ADX Multiplier.

CHOP Zone Entry Strategy + DMI/PSAR ExitThis is a Strategy with associated visual indicators and Long/Short and Reverse/Close Position Alerts for the Choppiness Index (CHOP) . It is used to determine if the market is choppy (trading sideways) or not choppy (trading within a trend in either direction). CHOP is not directional, so a DMI script was ported into this strategy to allow for trend confirmation and direction determination; it consists of an Average Directional Index (ADX) , Plus Directional Indicator (+DI) and Minus Directional Indicator (-DI) . In addition, a Parabolic SAR is also included to act as a trailing stop during any strong trends.
Development Notes
---------------------------
This indicator, and most of the descriptions below, were derived largely from the TradingView reference manual. Feedback and suggestions for improvement are more than welcome, as well are recommended Input settings and best practices for use.
www.tradingview.com
www.tradingview.com
www.tradingview.com
Recommend using the below DMI and PSAR indicators in conjunction with this script to fully visualize and understand how entry and exit conditions are chosen. Variable inputs should correlate between the scripts for uniformity and visual compatibility.
THANKS to LazyBear and his Momentum Squeeze script for helping me quickly develop a momentum state model for coloring the Chop line by trend.
Strategy Description
---------------------------
CHOP produces values that determine whether the market is choppy or trending . The closer the value is to 100 , the higher the choppiness levels , while the closer it is to 0 , the stronger the market is trending . Territories for both levels, and their associated upper and lower thresholds, are popularly defined using the Fibonacci Retracements, 61.8 and 38.2.
Basic Use
---------------------------
CHOP is often used to confirm the market condition to help you stay out of sideways markets and only enter when there is movement or imminent explosions. When readings are above the upper threshold, continued sideways movement may be expected, while readings below the lower threshold are typically indicative of a continuing trend. It is also used to anticipate upcoming trendiness changes, with the general belief that extended periods of consolidation (sideways movement) are followed by extended periods of strong, trending, directional movement, and vice versa.
One limitation in this index is that you must be cautious in deciding whether the range or trend will likely continue, or if it will reverse.
Confidence in price action and trend is higher when two or more indicators are in agreement -- while this strategy combines CHOP with both DMI and PSAR, we would still recommend pairing with other indicators to determine entry or exit trade opportunities.
Recommend also choosing 'Once Per Bar Close' when creating alerts.
Inputs
---------------------------
Strategy Direction - an option to only trade Short, Long, Both, or only in the direction of the Trend (Follow Trend is the Default).
Sensitivity - an incremental variable to test whether the past n candles are in the same trend state before triggering a delayed long or short alert (1 is the Default). Can help filter out noise and reduces active alerts.
Show Chop Index - two visual styles are provided for user preference, a visible Chop line with a background overlay, or a compact column and label only view.
Chop Lookback Period - the time period to be used in calculating CHOP (14 is the Default).
Chop Offset - changing this number will move the CHOP either forwards or backwards relative to the current market (0 is the Default).
Smooth Chop Line and Length - if enabled, the entered time period will be used in calculating a smooth average of the index (Enabled and 4 are the Defaults).
Color Line to Trend Direction - toggles whether the index line is colored to visually depict the current trend direction (Enabled is the Default).
Color Background - toggles the visibility of a background color based on the index state (Enabled is the Default).
Enable DMI Option - if enabled, then entry will be confirmed by and dependent on the ADX Key Level, with any close or reversal confirmed by both ADX and +/-DI to determine whether there is a strong trend present or not (Enabled is the Default).
ADX Smoothing - the time period to be used in calculating the ADX which has a smoothing component (14 is the Default).
DI Length - the time period to be used in calculating the DI (14 is the Default).
ADX Key Level - any trade with the ADX above the key level is a strong indicator that it is trending (23 to 25 is the suggested setting).
Enable PSAR Option - enables trailing stop loss orders (Enabled is the Default).
PSAR Start - the starting value for the Acceleration Force (0.015 is our chosen Default, 0.02 is more common).
PSAR Increment - the increment in which the Acceleration Force will move (0.001 is our chosen Default, 0.02 is more common).
PSAR Max Value - the maximum value of the Acceleration Factor (0.2 is the Default).
Color Candles Option - an option to transpose the CHOP condition levels to the main candle bars. Note that the outer red and green border will still be distinguished by whether each individual candle is bearish or bullish during the specified timeframe.
Note too that if both DMI and PSAR are deselected, then close determinations will default to a CHOP reversal strategy (e.g., close long when below 38.2 and close short when above 61.8). Though if either DMI or PSAR are enabled, then the CHOP reversal for close determination will automatically be disabled.
Indicator Visuals
---------------------------
For the candle colors, black indicates tight chop (45 to 55), yellow is loose chop (38.2 to 45 and 55 to 61.8), dark purple is trending down (< 38.2), and dark blue is trending up (> 61.8).
The background color has additional shades to differentiate a wider range of more levels…
• < 30 is dark purple
• 30 to 38.2 is purple
• 38.2 to 45 is light purple
• 45 to 55 is black
• 55 to 61.8 is light blue
• 61.8 to 70 is blue
• > 70 is dark blue
Long, Short, Close, and Reverse labels are plotted on the Chop line, which itself can be colored based on the trend. The chop line can also be hidden for a clean and compact, columnar view, which is my preferred option (see example image below).
Visual cues are intended to improve analysis and decrease interpretation time during trading, as well as to aid in understanding the purpose of this strategy and how its inclusion can benefit a comprehensive trading plan.
DMI and Trend Strength
---------------------------
To analyze trend strength, the focus should be on the ADX line and not the +DI or -DI lines. An ADX reading above 25 indicates a strong trend , while a reading below 20 indicates a weak or non-existent trend . A reading between those two values would be considered indeterminable. Though what is truly a strong trend or a weak trend depends on the financial instrument being examined; historical analysis can assist in determining appropriate values.
DMI exits trade when ADX is below the user selected key level (e.g., default is 25) and when the +/- DI lines cross (e.g., -DI > +DI exits long position and +DI > -DI exits short position).
PSAR and Trailing Stop
---------------------------
PSAR is a time and price based indicator that excels at measuring direction and duration, though not the actual strength of a trend, which is why we use this in conjunction with DMI. It is also included in this script as a trailing stop option to maximize gains during strong trends and to mitigate any false ADX strengthening signals.
This creates a parabola that is located below the candle during a Bullish trend and above during a Bearish trend. A buy or reversal is signaled when the price crosses above or below the Parabolic SAR.
Long/Short Entry
---------------------------
1. CHOP must be over 61.8 (long) or under 38.2 (short).
2. If DMI is enabled, then the ADX signal line must be above the user selected Key Level (default is 25).
3. If Sensitivity is selected, then that past candle must meet the criteria in step 1, as well as all the intermediate candles in between.
4. If "Follow Trend" is selected and PSAR is enabled, then a long position can only open when the momentum and PSAR are in an uptrend, or short when both are in a downtrend, to include all intermediate candles if the Sensitivity option is set on a past candle.
Close/Reverse
---------------------------
1. If DMI is enabled, then a close flag will be raised when the ADX signal drops below the Key Level (of 25), and -DI crosses over +DI (if long), or +DI crosses over -DI (if short).
2. If PSAR is enabled, then a close flag will be raised when the current trend state is opposite the last state.
3. If both DMI and PSAR are disabled, then a close flag will be raised if the Chop line drops under 38.2 (if long) or goes over 61.8 (if short).
4. If a Long or Short Entry is triggered on the same candle as any of the above close flags, then the position will be reversed, else the position will be closed.
Strategy Alerts
---------------------------
1. Long Entry
2. Short Entry
3. Reverse
4. Close
The provided backtest result is based on a position sizing of 10% equity with 100k initial capital. When testing SPX, disabling the DMI performed the best, but EURUSD performed poorly without it enabled, and TSLA had a small reduction in net profit. Timeframe likewise differed between commodities with TSLA performing best at 30M, SPX at 15M, and EURUSD at 4H. I do not plan on using this as a standalone strategy, but I also was expecting better results with the inclusion of EMI and PSAR to compliment the CHOP. Key elements of this script will likely be included in future, more holistic strategies.
Disclaimer
---------------------------
Past performance may not be indicative of future results. Due to various factors, including changing market conditions, the strategy may no longer perform as well as in historical backtesting. This post and the script are not intended to provide any financial advice. Trade at your own risk.
No known repainting, though there may be if an offset is introduced in the Inputs. I did my best not to code any other variables that repaint, but cannot fully attest to this fact.

Madstrat Strategy - Dual TF# Madstrat Strategy - Dual TF: Complete User Guide
## Overview
The Madstrat Strategy indicator is a comprehensive forex trading system that identifies high-probability trade setups based on a day-counting methodology combined with multi-timeframe EMA alignment analysis. It generates two primary signal types:
1. **Day 3 Signals** - Based on the GSD/RSD (Green Setup Day/Red Setup Day) counting system
2. **Pure Price Action (PA) Signals** - Based on EMA alignment across multiple timeframes with EQ rejection
The indicator operates on **two timeframe combinations simultaneously**:
- **15-minute / 1-hour** combo
- **30-minute / 2-hour** combo
---
## Section 1: Timeframe Signals
### Settings
| Input | Default | Description |
|-------|---------|-------------|
| Show 15m/1hr Signals | ✓ Enabled | Displays signals from the 15-minute LTF with 1-hour HTF confirmation |
| Show 30m/2hr Signals | ✓ Enabled | Displays signals from the 30-minute LTF with 2-hour HTF confirmation |
| Trade Levels Source | Most Recent | Determines which combo draws SL/TP levels |
### How It Works
Each timeframe combination operates independently with its own:
- Signal spacing rules (4 bars for 15m, 2 bars for 30m = both equal ~1 hour)
- Daily signal limits (3 Day 3 signals + 3 Pure PA signals per combo per day)
- EMA alignment checks on both LTF and HTF
**Trade Levels Source Options:**
- **15m/1hr** - Only 15m/1hr signals draw trade levels
- **30m/2hr** - Only 30m/2hr signals draw trade levels
- **Most Recent** - Whichever signal fires most recently draws levels (15m/1hr takes priority if both fire simultaneously)
---
## Section 2: Signal Colors
Customize the appearance of each signal type for each timeframe combination:
### 15m/1hr Combo
| Signal Type | Default Color |
|-------------|---------------|
| Day 3 Buy | Blue |
| Day 3 Sell | Red |
| Pure PA Buy | Aqua |
| Pure PA Sell | Fuchsia |
### 30m/2hr Combo
| Signal Type | Default Color |
|-------------|---------------|
| Day 3 Buy | Teal |
| Day 3 Sell | Orange |
| Pure PA Buy | Lime |
| Pure PA Sell | Maroon |
---
## Section 3: Enhanced FBR Rules
### What is FBR?
**FBR (Failed Breakout Retest)** occurs when price breaks below the previous week's low (or above the previous week's high) but fails to close outside the range, closing back inside instead. This signals a potential reversal and resets the day count to "Day 1" of a new setup sequence.
### Settings
| Input | Default | Description |
|-------|---------|-------------|
| Enable Enhanced FBR Rule | ✓ Enabled | Prevents FBR detection after a clean breakout |
| Show Clean Breakout Labels | ✓ Enabled | Displays labels when clean breakouts occur |
| Bull Breakout Label Color | Blue (25% transparent) | Background color for bullish breakout labels |
| Bear Breakout Label Color | Red (25% transparent) | Background color for bearish breakout labels |
### How Enhanced FBR Works
1. **Clean Breakout Detection**: A clean breakout occurs when price breaks AND closes outside the previous week's range
2. **FBR Blocking**: Once a clean breakout occurs in a week, FBR detection is disabled for the remainder of that week
3. **Weekly Reset**: Both clean breakout and FBR flags reset at the start of each new trading week (Sunday rollover)
### Label Types
- **"CLEAN BULL BO"** - Price broke above previous week high and closed above it
- **"CLEAN BEAR BO"** - Price broke below previous week low and closed below it
- **"FBR Day 1"** - Failed breakout retest detected, count reset to Day 1
---
## Section 4: Real-Time Day Labels
### Purpose
The real-time label shows a **live projection** of what today's day classification will be, updating throughout the trading session as price action develops.
### Settings
| Input | Default | Description |
|-------|---------|-------------|
| Enable Real-Time Day Labels | ✓ Enabled | Shows dynamic label that updates during trading |
| Real-Time Label Position | Right | Position of label relative to current candle |
| Real-Time Label Background | Yellow (20% transparent) | Background color |
| Real-Time Label Text | White | Text color |
### Label Text Meanings
| Label | Meaning |
|-------|---------|
| LIVE: GSD Day X | Projected Green Setup Day (after 2+ red days) |
| LIVE: GD Day X | Projected Green Day (continuing green trend) |
| LIVE: RSD Day X | Projected Red Setup Day (after 2+ green days) |
| LIVE: RD Day X | Projected Red Day (continuing red trend) |
| LIVE: INSIDE DAY | Price range is entirely within previous day's range |
| LIVE: FBR - GSD Day 1 | Bullish failed breakout retest detected |
| LIVE: FBR - RSD Day 1 | Bearish failed breakout retest detected |
| LIVE: ... CLEAN BULL BO | Clean bullish breakout detected |
| LIVE: ... CLEAN BEAR BO | Clean bearish breakout detected |
---
## Section 5: Daily Session Definition
### Instrument Presets
| Preset | Sunday Open | Friday Close | Rollover | Use Case |
|--------|-------------|--------------|----------|----------|
| Forex (FX Pairs) | 17:05 ET | 16:59 ET | 17:00 ET | EUR/USD, GBP/USD, etc. |
| Metals (XAU/XAG) | 18:05 ET | 16:59 ET | 17:00 ET | Gold, Silver |
| Custom | User-defined | User-defined | User-defined | Other instruments |
### Why This Matters
The indicator uses **OANDA-style daily rollover** (5 PM Eastern) rather than UTC midnight. This ensures:
- Accurate day counting for forex markets
- Correct GSD/RSD classification
- Proper weekly level calculations
### Session Break Line
| Input | Default | Description |
|-------|---------|-------------|
| Show Session Break Line | ✓ Enabled | Draws vertical line at daily rollover |
| Session Break Line Color | Black | Line color |
| Width | 2 | Line thickness (1-5) |
| Style | Solid | Solid, dashed, or dotted |
---
## Section 6: Day Labels (GSD/RSD System)
### The Core Day Counting Methodology
This is the foundation of the Madstrat Strategy:
1. **Green Day (GD)**: Daily candle closes higher than it opened
2. **Red Day (RD)**: Daily candle closes lower than it opened
3. **Green Setup Day (GSD)**: A green day that follows 2 or more consecutive red days
4. **Red Setup Day (RSD)**: A red day that follows 2 or more consecutive green days
### The Day 3 Signal
**Day 3** is when the setup is "mature" and ready for a trade:
- **GSD Day 3**: Third consecutive green day after a red sequence of 2+ days
- **RSD Day 3**: Third consecutive red day after a green sequence of 2+ days
### Settings
| Input | Default | Description |
|-------|---------|-------------|
| Max Historical Labels | 60 | Number of day labels to retain on chart |
| Show Day of Week Labels | ✓ Enabled | Shows M O N, T U E, etc. |
| Label Position | Top | Top or bottom of chart |
| Label Hour | 6 | Hour (0-23) when day labels appear |
| GSD/GD Label Background | Blue (25% transparent) | Green day label color |
| RSD/RD Label Background | Red (25% transparent) | Red day label color |
| Inside Day Label Background | Gray (25% transparent) | Inside day label color |
### Important Notes
- **Inside Days** do not increment the count - they are neutral
- **FBR events** reset the count to Day 1 and establish a new trend direction
- **Clean Breakouts** also reset to Day 1 but block further FBR detection that week
---
## Section 7: Daily Levels
Displays the previous day's key price levels:
### Available Levels
| Level | Default | Description |
|-------|---------|-------------|
| Previous Day's High (PDH) | ✓ Enabled, Blue | Highest price of previous session |
| Previous Day's Low (PDL) | ✓ Enabled, Green | Lowest price of previous session |
| Previous Day's EQ | ✓ Enabled, Black | Equilibrium (midpoint of PDH/PDL) |
| 75% Level | ✗ Disabled | 75% of previous day's range |
| 25% Level | ✗ Disabled | 25% of previous day's range |
### EQ Rejection (Critical for Signals)
The **EQ (Equilibrium)** level is crucial for signal generation:
- **Bullish EQ Rejection**: Price wicks down to touch EQ, then closes above it
- **Bearish EQ Rejection**: Price wicks up to touch EQ, then closes below it
The indicator tracks these rejections throughout the day and uses them as a key filter for both Day 3 and Pure PA signals.
---
## Section 8: Weekly Levels
### Previous Week Levels
| Level | Description |
|-------|-------------|
| PWH (Previous Week High) | Highest price of the completed previous week |
| PWL (Previous Week Low) | Lowest price of the completed previous week |
| PWEQ (Previous Week EQ) | Midpoint of PWH and PWL |
### Current Week Levels
| Level | Description |
|-------|-------------|
| WH (Week High) | Running high of the current week |
| WL (Week Low) | Running low of the current week |
| WEQ (Week EQ) | Running midpoint of current week |
### Settings
| Input | Default | Description |
|-------|---------|-------------|
| Show Weekly Levels | ✓ Enabled | Master toggle for all weekly levels |
| Show Previous Week High/Low/EQ | ✓ Enabled | PWH, PWL, PWEQ lines |
| Previous Week Line Color | Black | Color for PW levels |
| Previous Week Line Width | 2 | Thickness of PW lines |
| Show Current Week High/Low | ✓ Enabled | WH, WL lines (dashed) |
| Current Week Line Color | Blue | Color for current week levels |
| Show Weekly Level Labels | ✓ Enabled | Text labels at line ends |
| Weekly Label Size | Normal | Tiny to Huge |
| Lines & Labels End Day | Friday | Extend lines to which day |
---
## Section 9: Session Overlays
Visual boxes showing major forex trading sessions:
### Available Sessions
| Session | Default Times (ET) | Default State |
|---------|-------------------|---------------|
| Sydney | 18:00 - 02:00 | ✗ Disabled |
| Asian | 19:00 - 04:15 | ✓ Enabled |
| London | 01:00 - 11:15 | ✓ Enabled |
| New York | 07:30 - 17:15 | ✓ Enabled |
### Customization Options
For each session:
- Start/End Hour and Minute
- Timezone
- Background color (with transparency)
- Border color
- Border style (solid, dashed, dotted)
- Border width
### General Session Settings
| Input | Default | Description |
|-------|---------|-------------|
| Show Session Overlays | ✓ Enabled | Master toggle |
| Show Session Names on Boxes | ✓ Enabled | Display "Sydney", "Asia", etc. |
| Session Box Border Width | 1 | Border thickness |
| Session Name Text Color | Black | Label text color |
| Session Name Size | Normal | Tiny to Huge |
---
## Section 10: Chart Visuals (Moving Averages)
### Available Moving Averages
| MA | Default | Default Color | Purpose |
|----|---------|---------------|---------|
| 9 EMA | ✓ Shown | Green | Fast trend |
| 18 EMA | ✓ Shown | Orange | Medium trend |
| 50 EMA | ✓ Shown | Blue | Slow trend |
| 50 SMA | ✓ Shown | Purple | Alternative slow trend |
| 200 EMA | ✗ Hidden | Red | Long-term trend |
### EMA Alignment Requirement
For signals to fire, the EMAs must be properly "stacked":
**Bullish Alignment:**
```
Price > 9 EMA > 18 EMA > 50 EMA
```
**Bearish Alignment:**
```
Price < 9 EMA < 18 EMA < 50 EMA
```
This alignment must be present on **both** the LTF (15m or 30m) **and** the HTF (1hr or 2hr) for a signal to generate.
---
## Section 11: Signal Filters
### EQ Rejection Recency
| Input | Default | Description |
|-------|---------|-------------|
| EQ Rejection Recency (bars) | 4 | EQ rejection must occur within this many bars |
On a 15-minute chart, 4 bars = 1 hour. This ensures the EQ rejection is "fresh" and relevant.
### Session Filter
| Input | Default | Description |
|-------|---------|-------------|
| Enable Session Filter | ✗ Disabled | Only allow signals during selected sessions |
| Allow Sydney Session Signals | ✓ Enabled | (Only applies if filter enabled) |
| Allow Asian Session Signals | ✓ Enabled | |
| Allow London Session Signals | ✓ Enabled | |
| Allow New York Session Signals | ✓ Enabled | |
### ADX Filter
| Input | Default | Description |
|-------|---------|-------------|
| Enable ADX Filter | ✓ Enabled | Require minimum trend strength |
| ADX Threshold | 20.0 | Minimum ADX value (5.0 - 50.0) |
The ADX (Average Directional Index) measures trend strength. Values above 20-25 indicate a trending market suitable for directional trades.
---
## Section 12: Signal Types Explained
### Day 3 Signals (Primary)
Day 3 signals come in two forms:
#### Day 3 Detected (Live)
Fires when the **current day is projected** to become Day 3 based on real-time price action. This is an early signal that may change if the daily candle reverses before close.
#### Day 3 Confirmed
Fires when Day 3 has been **officially confirmed** by the previous day's close. This is a more reliable signal as the day count is locked in.
**Requirements for Day 3 Buy:**
1. GSD Count = 3 (confirmed) OR Projected GSD Count = 3 (live)
2. Not an inside day (current or previous)
3. Recent bullish EQ rejection (within recency bars)
4. Bullish EMA alignment on LTF
5. Bullish EMA alignment on HTF
6. Adequate candle body (not all wick)
7. ADX above threshold (if enabled)
8. Within allowed session (if filter enabled)
9. Signal spacing requirement met
10. Less than 3 Day 3 signals already today for this combo
**Day 3 Sell** - Same requirements but bearish (RSD Count = 3, bearish alignment, bearish EQ rejection)
### Pure PA Signals (Secondary)
Pure PA signals also come in two forms:
#### Pure PA Detected (LTF Only)
Fires when the **lower timeframe conditions** are met but HTF confirmation is still pending. This is an early warning that a full signal may be imminent.
#### Pure PA Confirmed (LTF + HTF)
Fires when **both LTF and HTF** conditions are aligned. This is the full confirmation signal.
**Requirements for Pure PA Buy:**
1. Recent bullish EQ rejection
2. Bullish EMA alignment on LTF (Price > 9 > 18 > 50)
3. Bullish EMA alignment on HTF (Price > 9 > 18 > 50)
4. Adequate candle body ratio (≥30%)
5. ADX above threshold on LTF
6. Not currently an inside day
7. Signal spacing requirement met
8. Less than 3 Pure PA signals already today for this combo
9. Within allowed session (if filter enabled)
**Pure PA Sell** - Same requirements but bearish
---
## Section 13: Trade Levels
When a signal fires, the indicator can draw:
| Level | Style | Description |
|-------|-------|-------------|
| Stop Loss (SL) | Red dashed | Entry price ± (ATR × 1.5) |
| Take Profit 1 | Green dashed | 1:1 Risk/Reward |
| Take Profit 2 | Green dotted | 2:1 Risk/Reward |
| Take Profit 3 | Green dotted | 3:1 Risk/Reward |
These levels use a 14-period ATR for the stop loss calculation.
---
## Section 14: Debug Table
Enable **Show Debug Table** to display real-time diagnostic information:
### Information Displayed
| Category | Variables |
|----------|-----------|
| Day Counting | GSD Count, RSD Count, Projected GSD, Projected RSD |
| Day State | Is Projected D3?, Currently Inside?, Week Has FBR?, Clean Breakout (Week)? |
| 15m/1hr Combo | LTF Bull/Bear Positioning, HTF Bull/Bear Positioning, D3/PA Signals Today, Signal Spacing OK |
| 30m/2hr Combo | LTF Bull/Bear Positioning, HTF Bull/Bear Positioning, D3/PA Signals Today, Signal Spacing OK |
| Shared | EQ Rejection Recent (Bull/Bear), Session Filter OK, 15m ADX, 30m ADX, Trade Levels Source |
Green cells = condition met (true)
Red cells = condition not met (false)
Gray cells = informational values
---
## Section 15: Alert Settings
The indicator features a comprehensive **enhanced alert system** with granular control over when and how alerts fire.
### Alert Settings Inputs
| Input | Default | Description |
|-------|---------|-------------|
| Enable Dynamic Alerts | ✓ Enabled | Master toggle for all dynamic alerts with detailed messages |
| Day 3 Detected (Live) | ✓ Enabled | Alert when Day 3 is projected based on current price action |
| Day 3 Confirmed | ✓ Enabled | Alert when Day 3 is officially confirmed |
| Pure PA Detected (LTF) | ✓ Enabled | Alert when LTF conditions are met (early warning) |
| Pure PA Confirmed (LTF+HTF) | ✓ Enabled | Alert when both LTF and HTF conditions align |
### Alert Message Format
All dynamic alerts follow a standardized format for easy parsing:
```
TYPE | SYMBOL @ PRICE | DAY_CLASS | SESSION | DIRECTION | COMBO
```
**Example alerts:**
```
D3 DETECTED | EURUSD @ 1.08542 | GSD Day 3 | London | BUY | 15m/1hr
D3 CONFIRMED | GBPJPY @ 192.456 | RSD Day 3 | New York | SELL | 30m/2hr
PA DETECTED | XAUUSD @ 2345.67 | GSD Day 2 | Asian | BUY | 15m/1hr (LTF only)
PA CONFIRMED | EURJPY @ 164.123 | RSD Day 1 | London | SELL | 30m/2hr
```
### Alert Types Explained
| Alert Type | Meaning | Use Case |
|------------|---------|----------|
| **D3 DETECTED** | Day 3 projected based on current candle | Early entry opportunity; may invalidate if candle reverses |
| **D3 CONFIRMED** | Day 3 locked in from previous close | Higher confidence entry; day count is confirmed |
| **PA DETECTED** | LTF alignment met, waiting for HTF | Heads-up alert; prepare for potential entry |
| **PA CONFIRMED** | Both LTF and HTF aligned | Full confirmation; ready to execute |
### TradingView Alert Dialog Options
When creating an alert in TradingView, you'll see these condition options in the dropdown:
#### Day 3 Detected (Live Projection)
- D3 Detected: Buy 15m/1hr
- D3 Detected: Sell 15m/1hr
- D3 Detected: Buy 30m/2hr
- D3 Detected: Sell 30m/2hr
#### Day 3 Confirmed
- D3 Confirmed: Buy 15m/1hr
- D3 Confirmed: Sell 15m/1hr
- D3 Confirmed: Buy 30m/2hr
- D3 Confirmed: Sell 30m/2hr
#### Pure PA Detected (LTF Only)
- PA Detected: Buy 15m/1hr
- PA Detected: Sell 15m/1hr
- PA Detected: Buy 30m/2hr
- PA Detected: Sell 30m/2hr
#### Pure PA Confirmed (LTF + HTF)
- PA Confirmed: Buy 15m/1hr
- PA Confirmed: Sell 15m/1hr
- PA Confirmed: Buy 30m/2hr
- PA Confirmed: Sell 30m/2hr
#### Combined Alerts (Any Combo)
- D3 Detected: Any Buy
- D3 Detected: Any Sell
- D3 Confirmed: Any Buy
- D3 Confirmed: Any Sell
- PA Confirmed: Any Buy
- PA Confirmed: Any Sell
#### Master Alerts
- ALL Day 3: Any Buy
- ALL Day 3: Any Sell
- ALL PA: Any Buy
- ALL PA: Any Sell
### Setting Up Alerts
1. **Click the Alert icon** in TradingView (or press Alt+A)
2. **Select the indicator** "Madstrat Strategy - Dual TF"
3. **Choose the condition** from the dropdown (e.g., "D3 Confirmed: Any Buy")
4. **Configure notification options** (popup, email, webhook, etc.)
5. **Set alert name** and click "Create"
### Recommended Alert Configurations
**Conservative Approach:**
- Enable only "Day 3 Confirmed" and "PA Confirmed" alerts
- These fire after full confirmation on both timeframes
**Aggressive Approach:**
- Enable all alert types including "Detected" alerts
- Get early warnings but verify manually before entry
**Session-Specific:**
- Create separate alerts for each session you trade
- Use the session filter to limit when signals can fire
---
## Section 16: Signal Identification on Chart
| Shape | Text | Meaning |
|-------|------|---------|
| ▲ Triangle Up | D3-15 | Day 3 Buy from 15m/1hr combo |
| ▲ Triangle Up | D3-30 | Day 3 Buy from 30m/2hr combo |
| ▼ Triangle Down | D3-15 | Day 3 Sell from 15m/1hr combo |
| ▼ Triangle Down | D3-30 | Day 3 Sell from 30m/2hr combo |
| ◆ Diamond | PA-15 | Pure PA signal from 15m/1hr combo |
| ◆ Diamond | PA-30 | Pure PA signal from 30m/2hr combo |
---
## Quick Start Guide
### Recommended Setup for Forex
1. **Timeframe**: Apply indicator to a 15-minute chart
2. **Instrument Preset**: Select "Forex (FX Pairs)"
3. **Enable both** 15m/1hr and 30m/2hr signals initially
4. **Trade Levels Source**: "Most Recent"
5. **ADX Filter**: Enabled with threshold 20
6. **Alerts**: Enable "D3 Confirmed" and "PA Confirmed" for reliable signals
### Reading Signals
1. Look for **Day 3 signals** (triangles) as primary entries
2. Use **Pure PA signals** (diamonds) as supplementary entries
3. Check the debug table to understand why signals did/didn't fire
4. Reference the real-time day label to anticipate upcoming Day 3 opportunities
### Alert Strategy
**For active monitoring:**
- Enable "Detected" alerts as early warnings
- Manually verify conditions before entry
**For set-and-forget:**
- Enable only "Confirmed" alerts
- Trust the full confirmation system
---
## Troubleshooting
### No Signals Appearing?
Check the debug table for:
1. **EQ Rejection Recent** - Is there a recent EQ rejection?
2. **LTF/HTF Positioning** - Are EMAs properly aligned?
3. **GSD/RSD Count** - Is it actually Day 3?
4. **Currently Inside?** - Inside days block signals
5. **Signal Spacing OK** - Has enough time passed since last signal?
6. **ADX value** - Is it above the threshold?
### Day Labels Not Matching Expected Count?
- Verify **Instrument Preset** matches your trading instrument
- Check if an **FBR** or **Clean Breakout** reset the count
- **Inside days** don't increment the count
- Week resets occur at **Sunday 5 PM ET** for forex
### Alerts Not Firing?
1. Ensure **Enable Dynamic Alerts** is checked
2. Verify the specific alert type is enabled (D3 Detected, D3 Confirmed, etc.)
3. Check that the alert condition is properly set up in TradingView
4. Confirm signal filters (session, ADX) aren't blocking the signal
### Understanding Detected vs Confirmed
| Scenario | Detected Alert | Confirmed Alert |
|----------|----------------|-----------------|
| Current day projected to be Day 3, candle still open | ✓ Fires | ✗ Won't fire |
| Previous day closed as Day 3, conditions met today | ✓ May fire | ✓ Fires |
| LTF aligned, HTF not yet aligned | ✓ PA Detected fires | ✗ PA Confirmed won't fire |
| Both LTF and HTF aligned | ✓ May fire | ✓ PA Confirmed fires |
---
## Glossary
| Term | Definition |
|------|------------|
| **GSD** | Green Setup Day - Green day following 2+ red days |
| **RSD** | Red Setup Day - Red day following 2+ green days |
| **GD** | Green Day - Regular green day (not a setup) |
| **RD** | Red Day - Regular red day (not a setup) |
| **FBR** | Failed Breakout Retest - Price breaks weekly level but closes back inside |
| **EQ** | Equilibrium - Midpoint of previous day's range |
| **LTF** | Lower Timeframe (15m or 30m) |
| **HTF** | Higher Timeframe (1hr or 2hr) |
| **PWH/PWL** | Previous Week High/Low |
| **PDH/PDL** | Previous Day High/Low |
| **Clean Breakout** | Price breaks AND closes outside previous week's range |
---
This documentation covers the complete functionality of the Madstrat Strategy - Dual TF indicator including the enhanced alert system. For further assistance with specific scenarios or edge cases, enable the debug table and analyse the real-time variable states.

Market Outlook Score (MOS)Overview
The "Market Outlook Score (MOS)" is a custom technical indicator designed for TradingView, written in Pine Script version 6. It provides a quantitative assessment of market conditions by aggregating multiple factors, including trend strength across different timeframes, directional movement (via ADX), momentum (via RSI changes), volume dynamics, and volatility stability (via ATR). The MOS is calculated as a weighted score that ranges typically between -1 and +1 (though it can exceed these bounds in extreme conditions), where positive values suggest bullish (long) opportunities, negative values indicate bearish (short) setups, and values near zero imply neutral or indecisive markets.
This indicator is particularly useful for traders seeking a holistic "outlook" score to gauge potential entry points or market bias. It overlays on a separate pane (non-overlay mode) and visualizes the score through horizontal threshold lines and dynamic labels showing the numeric MOS value along with a simple trading decision ("Long", "Short", or "Neutral"). The script avoids using the plot function for compatibility reasons (e.g., potential TradingView bugs) and instead relies on hline for static lines and label.new for per-bar annotations.
Key features:
Multi-Timeframe Analysis: Incorporates slope data from 5-minute, 15-minute, and 30-minute charts to capture short-term trends.
Trend and Strength Integration: Uses ADX to weight trend bias, ensuring stronger signals in trending markets.
Momentum and Volume: Includes RSI momentum impulses and volume deviations for added confirmation.
Volatility Adjustment: Factors in ATR changes to assess market stability.
Customizable Inputs: Allows users to tweak periods for lookback, ADX, and ATR.
Decision Labels: Automatically classifies the MOS into actionable categories with visual labels.
This indicator is best suited for intraday or swing trading on volatile assets like stocks, forex, or cryptocurrencies. It does not generate buy/sell signals directly but can be combined with other tools (e.g., moving averages or oscillators) for comprehensive strategies.
Inputs
The script provides three user-configurable inputs via TradingView's input panel:
Lookback Period (lookback):
Type: Integer
Default: 20
Range: Minimum 10, Maximum 50
Purpose: Defines the number of bars used in slope calculations for trend analysis. A shorter lookback makes the indicator more sensitive to recent price action, while a longer one smooths out noise for longer-term trends.
ADX Period (adxPeriod):
Type: Integer
Default: 14
Range: Minimum 5, Maximum 30
Purpose: Sets the smoothing period for the Average Directional Index (ADX) and its components (DI+ and DI-). Standard value is 14, but shorter periods increase responsiveness, and longer ones reduce false signals.
ATR Period (atrPeriod):
Type: Integer
Default: 14
Range: Minimum 5, Maximum 30
Purpose: Determines the period for the Average True Range (ATR) calculation, which measures volatility. Adjust this to match your trading timeframe—shorter for scalping, longer for positional trading.
These inputs allow customization without editing the code, making the indicator adaptable to different market conditions or user preferences.
Core Calculations
The MOS is computed through a series of steps, blending trend, momentum, volume, and volatility metrics. Here's a breakdown:
Multi-Timeframe Slopes:
The script fetches data from higher timeframes (5m, 15m, 30m) using request.security.
Slope calculation: For each timeframe, it computes the linear regression slope of price over the lookback period using the formula:
textslope = correlation(close, bar_index, lookback) * stdev(close, lookback) / stdev(bar_index, lookback)
This measures the rate of price change, where positive slopes indicate uptrends and negative slopes indicate downtrends.
Variables: slope5m, slope15m, slope30m.
ATR (Average True Range):
Calculated using ta.atr(atrPeriod).
Represents average volatility over the specified period. Used later to derive volatility stability.
ADX (Average Directional Index):
A detailed, manual implementation (not using built-in ta.adx for customization):
Computes upward movement (upMove = high - high ) and downward movement (downMove = low - low).
Derives +DM (Plus Directional Movement) and -DM (Minus Directional Movement) by filtering non-relevant moves.
Smooths true range (trur = ta.rma(ta.tr(true), adxPeriod)).
Calculates +DI and -DI: plusDI = 100 * ta.rma(plusDM, adxPeriod) / trur, similarly for minusDI.
DX: dx = 100 * abs(plusDI - minusDI) / max(plusDI + minusDI, 0.0001).
ADX: adx = ta.rma(dx, adxPeriod).
ADX values above 25 typically indicate strong trends; here, it's normalized (divided by 50) to influence the trend bias.
Volume Delta (5m Timeframe):
Fetches 5m volume: volume_5m = request.security(syminfo.tickerid, "5", volume, lookahead=barmerge.lookahead_on).
Computes a 12-period SMA of volume: avgVolume = ta.sma(volume_5m, 12).
Delta: (volume_5m - avgVolume) / avgVolume (or 0 if avgVolume is zero).
This measures relative volume spikes, where positive deltas suggest increased interest (bullish) and negative suggest waning activity (bearish).
MOS Components and Final Calculation:
Trend Bias: Average of the three slopes, normalized by close price and scaled by 100, then weighted by ADX influence: (slope5m + slope15m + slope30m) / 3 / close * 100 * (adx / 50).
Emphasizes trends in strong ADX conditions.
Momentum Impulse: Change in 5m RSI(14) over 1 bar, divided by 50: ta.change(request.security(syminfo.tickerid, "5", ta.rsi(close, 14), lookahead=barmerge.lookahead_on), 1) / 50.
Captures short-term momentum shifts.
Volatility Clarity: 1 - ta.change(atr, 1) / max(atr, 0.0001).
Measures ATR stability; values near 1 indicate low volatility changes (clearer trends), while lower values suggest erratic markets.
MOS Formula: Weighted average:
textmos = (0.35 * trendBias + 0.25 * momentumImpulse + 0.2 * volumeDelta + 0.2 * volatilityClarity)
Weights prioritize trend (35%) and momentum (25%), with volume and volatility at 20% each. These can be adjusted in code for experimentation.
Trading Decision:
A variable mosDecision starts as "Neutral".
If mos > 0.15, set to "Long".
If mos < -0.15, set to "Short".
Thresholds (0.15 and -0.15) are hardcoded but can be modified.
Visualization and Outputs
Threshold Lines (using hline):
Long Threshold: Horizontal dashed green line at +0.15.
Short Threshold: Horizontal dashed red line at -0.15.
Neutral Line: Horizontal dashed gray line at 0.
These provide visual reference points for MOS interpretation.
Dynamic Labels (using label.new):
Placed at each bar's index and MOS value.
Text: Formatted MOS value (e.g., "0.2345") followed by a newline and the decision (e.g., "Long").
Style: Downward-pointing label with gray background and white text for readability.
This replaces a traditional plot line, showing exact values and decisions per bar without cluttering the chart.
The indicator appears in a separate pane below the main price chart, making it easy to monitor alongside price action.
Usage Instructions
Adding to TradingView:
Copy the script into TradingView's Pine Script editor.
Save and add to your chart via the "Indicators" menu.
Select a symbol and timeframe (e.g., 1-minute for intraday).
Interpretation:
Long Signal: MOS > 0.15 – Consider bullish positions if supported by other indicators.
Short Signal: MOS < -0.15 – Potential bearish setups.
Neutral: Between -0.15 and 0.15 – Avoid trades or wait for confirmation.
Watch for MOS crossings of thresholds for momentum shifts.
Combine with price patterns, support/resistance, or volume for better accuracy.
Limitations and Considerations:
Lookahead Bias: Uses barmerge.lookahead_on for multi-timeframe data, which may introduce minor forward-looking bias in backtesting (use with caution).
No Alerts Built-In: Add custom alerts via TradingView's alert system based on MOS conditions.
Performance: Tested for compatibility; may require adjustments for illiquid assets or extreme volatility.
Backtesting: Use TradingView's strategy tester to evaluate historical performance, but remember past results don't guarantee future outcomes.
Customization: Edit weights in the MOS formula or thresholds to fit your strategy.
This indicator distills complex market data into a single score, aiding decision-making while encouraging users to verify signals with additional analysis. If you need modifications, such as restoring plot functionality or adding features, provide details for further refinement.

Malama's Dashboard with HeikinMalama's Dashboard with Heikin is a comprehensive trading indicator designed to provide traders with a consolidated view of market sentiment across multiple technical indicators. It combines Ichimoku Cloud, RSI, ADX, Choppiness Index, volume analysis, momentum, divergence detection, and multi-timeframe (MTF) MACD and volume trends to generate a composite sentiment score. The indicator displays these metrics in a visually intuitive table, enabling traders to quickly assess market conditions and make informed decisions. Optionally, it supports Heikin Ashi candles to smooth price data and reduce noise, aiding in trend identification. The script solves the problem of information overload by presenting key indicators in a single, trader-friendly dashboard, reducing the need for multiple charts or indicators.
Originality and Usefulness
This script is a unique mashup of several well-known technical indicators, integrated into a cohesive dashboard with a composite sentiment score. Unlike standalone indicators like RSI or Ichimoku, this script synthesizes signals from Ichimoku Cloud, RSI, ADX, Choppiness, volume, momentum, divergence, and MTF analysis into a unified sentiment metric. The inclusion of Heikin Ashi candles as an optional input adds flexibility for traders preferring smoothed price action. The composite score, derived from weighted contributions of each indicator, provides a novel way to gauge overall market direction, which is not commonly found in public open-source scripts. While individual components like RSI or Ichimoku are widely available, the script’s originality lies in its integrated approach, clear table visualization, and customizable settings, making it a practical tool for traders seeking a holistic market view.
Detailed Methodology ("How It Works")
The script processes multiple technical indicators and aggregates their signals into a composite sentiment score, displayed in a table. Below is a breakdown of its core components and logic:
Heikin Ashi Candles:
Logic: Optionally applies Heikin Ashi calculations to smooth price data. Heikin Ashi candles are computed using formulas for open, high, low, and close prices, reducing market noise and emphasizing trends.
Usage: When enabled, all subsequent calculations (Ichimoku, RSI, ADX, etc.) use Heikin Ashi prices instead of regular OHLC data, potentially improving trend clarity.
Ichimoku Cloud:
Logic: Calculates the Conversion Line (9-period high/low average), Base Line (26-period high/low average), Leading Span A (average of Conversion and Base Lines), and Leading Span B (52-period high/low average).
Signals: Bullish if the close price is above both Leading Spans; bearish if below; neutral otherwise.
Average Directional Index (ADX):
Logic: Computes ADX using a 14-period (default) directional movement index, measuring trend strength. PlusDI and MinusDI are calculated from price movements, and ADX is derived from their difference.
Signals: Bullish if PlusDI > MinusDI; bearish otherwise. ADX value indicates trend strength but is not used directly in sentiment scoring.
Relative Strength Index (RSI):
Logic: Calculates RSI over a 21-period (default) using the closing price. Overbought (>75) and oversold (<25) levels are user-defined.
Signals: Bullish if RSI > 50; bearish if RSI < 50. Overbought/oversold conditions are displayed but not used in the composite score.
Momentum:
Logic: Measures the difference between the current close and the close 10 periods ago (default).
Signals: Bullish if momentum > 0; bearish if < 0; neutral if 0.
Choppiness Index:
Logic: Calculates choppiness over a 14-period (default) using ATR and price range, normalized to a 0–100 scale. Values >61.8 indicate a sideways market; <38.2 indicate a trending market.
Signals: Bullish if choppiness < 38.2; bearish otherwise.
Volume Analysis:
Logic: Compares current volume to a 21-period (default) simple moving average (SMA). Bullish or bearish pressure is determined by whether the close is above or below the open.
Signals: Bullish if volume > 1.2x SMA and bullish pressure dominates; bearish if bearish pressure dominates; neutral otherwise.
Divergence Detection:
Logic: Identifies RSI divergences over a 5-period lookback. A bullish divergence occurs when price makes a lower low, but RSI makes a higher low; bearish divergence is the opposite.
Signals: Bullish or bearish based on divergence detection; neutral if no divergence.
Multi-Timeframe (MTF) Analysis:
Logic: Retrieves daily MACD (12, 26, 9) and volume SMA (21-period) from a higher timeframe. MACD is bullish if the MACD line > signal line; volume is bullish if current volume > daily SMA.
Signals: Bullish or bearish based on MACD and volume trends.
Composite Sentiment Score:
Logic: Aggregates signals from Ichimoku (±2), RSI (±1), ADX (±1), momentum (±1), choppiness (±1), divergence (±1), MTF MACD (±1), and MTF volume (±1). The score ranges from -8 to +8.
Signals: Bullish if score > 0; bearish if < 0; neutral if 0.
Alert Condition:
Triggers an alert when the composite sentiment flips (e.g., from bullish to bearish).
Strategy Results and Risk Management
This script is an indicator, not a strategy, and does not include backtesting or automated trade signals. However, the composite sentiment score can guide trading decisions. Assumptions for practical use include:
Commission and Slippage: Traders should account for realistic trading costs (e.g., 0.1% per trade) when acting on signals, though the script does not model these.
Risk Limits: Traders are advised to risk 5–10% of equity per trade, depending on their strategy and the strength of the composite score (e.g., higher scores may justify larger positions).
Trade Frequency: The script’s signals are based on multiple indicators, ensuring sufficient trade opportunities across trending and ranging markets.
Customization: Traders can adjust risk by modifying input parameters (e.g., RSI overbought/oversold levels or lookback periods) to align with their risk tolerance. For example, tightening RSI thresholds may reduce signal frequency but increase precision.
User Settings and Customization
The script offers several user-configurable inputs, allowing traders to tailor its behavior:
Use Heikin Ashi Candles (Boolean, default: false): Enables/disables Heikin Ashi smoothing for all calculations, affecting trend clarity.
ADX Length (Integer, default: 14, min: 1): Sets the period for ADX calculations, influencing trend strength sensitivity.
RSI Length (Integer, default: 21, min: 1): Adjusts RSI calculation period, impacting overbought/oversold detection.
RSI Overbought Level (Integer, default: 75, min: 1): Sets the RSI overbought threshold.
RSI Oversold Level (Integer, default: 25, min: 1): Sets the RSI oversold threshold.
Volatility Length (Integer, default: 21, min: 1): Controls the ATR period for volatility (used in Choppiness).
Volume MA Length (Integer, default: 21, min: 1): Sets the SMA period for volume analysis.
Momentum Length (Integer, default: 10, min: 1): Defines the lookback for momentum calculations.
Choppiness Length (Integer, default: 14, min: 1): Sets the period for Choppiness Index calculations.
These settings allow traders to adjust the indicator’s sensitivity to market conditions. For example, shorter RSI or ADX periods increase responsiveness but may generate more noise, while longer periods smooth signals but may lag.
Visualizations and Chart Setup
The script plots a table in the top-right corner of the chart, summarizing the following:
Header: Displays “MALAMA’S DASHBOARD” in white text on a black background.
Indicator Rows: Each row corresponds to an indicator (Ichimoku, RSI, ADX, Choppiness, Volume, Momentum, Divergence, MTF MACD, MTF Volume, Composite).
Columns:
Indicator: Lists the indicator name.
Value: Shows the calculated value (e.g., RSI value, composite score) and sentiment (e.g., Bullish, Bearish, Neutral).
Color Coding: Bullish signals are green, bearish signals are red, and neutral signals are gray, all with 85% transparency for readability.
Composite Sentiment: The final row displays the composite score and sentiment, providing a quick summary of market direction.
No trend lines, signal markers, or additional overlays are plotted, ensuring the chart remains uncluttered and focused on the dashboard’s insights.

Smart Trend Lines [The_lurker]
Smart Trend Lines
A multi-level trend classifier that detects bullish and bearish conditions using a methodology based on drawing trend lines—main, intermediate, and short-term—by identifying peaks and troughs. The tool highlights trend strength by applying filters such as the Average Directional Index (ADX) (A), Relative Strength Index (RSI) (R), and Volume (V), making it easier to interpret trend strength. The filter markers (V, A, R) in the Smart Trend Lines indicator are powerful tools for assessing the reliability of breakouts. Breakouts containing are the most reliable, as they indicate strong volume support, trend strength, and favorable momentum. Breakouts with partial filters (such as or ) require additional confirmation, while breakouts without filters ( ) should be avoided unless supported by other strong signals. By understanding the meaning of each filter and the market context.
Core Functionality
1. Trend Line Types
The indicator generates three distinct trend line categories, each serving a specific analytical purpose:
Main Trend Lines: These are long-term trend lines designed to capture significant market trends. They are calculated based on pivot points over a user-defined period (default: 50 bars). Main trend lines are ideal for identifying macro-level support and resistance zones.
Mid Trend Lines: These are medium-term trend lines (default: 21 bars) that focus on intermediate price movements. They provide a balance between short-term fluctuations and long-term trends, suitable for swing trading strategies.
Short Trend Lines: These are short-term trend lines (default: 9 bars) that track rapid price changes. They are particularly useful for scalping or day trading, highlighting immediate support and resistance levels.
Each trend line type can be independently enabled or disabled, allowing traders to tailor the indicator to their preferred timeframes.
2. Breakout Detection
The indicator employs a robust breakout detection system that identifies when the price crosses a trend line, signaling a potential trend reversal or continuation. Breakouts are validated using the following filters:
ADX Filter: The Average Directional Index (ADX) measures trend strength. A user-defined threshold (default: 20) ensures that breakouts occur during strong trends, reducing false signals in range-bound markets.
RSI Filter: The Relative Strength Index (RSI) identifies overbought or oversold conditions. Breakouts are filtered based on RSI thresholds (default: 65 for overbought, 35 for oversold) to avoid signals in extreme market conditions.
Volume Filter: Breakouts are confirmed only when trading volume exceeds a moving average (default: 20 bars) and aligns with the breakout direction (e.g., higher volume on bullish breakouts when the candle closes higher).
Breakout events are marked with labels on the chart, indicating the type of trend line broken (Main, Mid, or Short) and the filters satisfied (Volume, ADX, RSI). Alerts are triggered for each breakout, providing real-time notifications.
3. Customization Options
The indicator offers extensive customization through input settings, organized into logical groups for ease of use:
Main Trend Line Settings
Length: Defines the number of bars used to calculate pivot points (default: 50).
Bullish Color: Color for upward-sloping (bullish) main trend lines (default: green).
Bearish Color: Color for downward-sloping (bearish) main trend lines (default: red).
Style: Line style options include solid, dashed, or dotted (default: solid).
Mid Trend Line Settings
Length: Number of bars for mid-term pivot points (default: 21).
Show/Hide: Toggle visibility of mid trend lines (default: enabled).
Bullish Color: Color for bullish mid trend lines (default: lime).
Bearish Color: Color for bearish mid trend lines (default: maroon).
Style: Line style (default: dashed).
Short Trend Line Settings
Length: Number of bars for short-term pivot points (default: 9).
Show/Hide: Toggle visibility of short trend lines (default: enabled).
Bullish Color: Color for bullish short trend lines (default: teal).
Bearish Color: Color for bearish short trend lines (default: purple).
Style: Line style (default: dotted).
General Display Settings
Break Check Price: Selects the price type for breakout detection (Close, High, or Low; default: Close).
Show Previous Trendlines: Option to display historical main trend lines (default: disabled).
Label Size: Size of breakout labels (Tiny, Small, Normal, Large, Huge; default: Small).
Filter Settings
ADX Threshold: Minimum ADX value for trend strength confirmation (default: 25).
Volume MA Period: Period for the volume moving average (default: 20).
RSI Filter: Enable/disable RSI filtering (default: enabled).
RSI Upper Threshold: Upper RSI limit for overbought conditions (default: 65).
RSI Lower Threshold: Lower RSI limit for oversold conditions (default: 35).
4. Technical Calculations
The indicator relies on several technical calculations to ensure accuracy:
Pivot Points: Pivot highs and lows are detected using the ta.pivothigh and ta.pivotlow functions, with separate lengths for Main, Mid, and Short trend lines.
Slope Calculation: The slope of each trend line is calculated as the change in price divided by the change in bar index between two pivot points.
ADX Calculation: ADX is computed using a 14-period Directional Movement Index (DMI), with smoothing over 14 bars.
RSI Calculation: RSI is calculated over a 14-period lookback using the ta.rsi function.
Volume Moving Average: A simple moving average (SMA) of volume is used to determine if current volume exceeds the average.
5. Strict Mode Validation
To ensure the reliability of trend lines, the indicator employs a strict mode check:
For bearish trend lines, all prices between pivot points must remain below the projected trend line.
For bullish trend lines, all prices must remain above the projected trend line.
Post-pivot break checks ensure that no breakouts occur between pivot points, enhancing the validity of the trend line.
6. Trend Line Extension
Trend lines are dynamically extended forward until a breakout occurs. The extension logic:
Projects the trend line using the calculated slope.
Continuously validates the extension using strict mode checks.
Stops extension upon a breakout, fixing the trend line at the breakout point.
7. Alerts and Labels
Labels: Breakout labels are placed above (for bearish breakouts) or below (for bullish breakouts) the price bar. Labels include:
A prefix indicating the trend line type (B for Main, M for Mid, S for Short).
A suffix showing satisfied filters (e.g., for Volume, ADX, and RSI).
Alerts: Each breakout triggers a one-time alert per bar close, with a descriptive message indicating the trend line type and filters met.
Detailed Code Breakdown
1. Initialization and Inputs
The script begins by defining the indicator with indicator('Smart Trend Lines ', overlay = true), ensuring it overlays on the price chart. Input settings are grouped into categories (Main, Mid, Short, General Display, Filters) for user convenience. Each input includes a tooltip in both English and Arabic, enhancing accessibility.
2. Technical Indicator Calculations
Volume MA: Calculated using ta.sma(volume, volPeriod) to compare current volume against the average.
ADX: Computed using custom dirmov and adx functions, which calculate the Directional Movement Index and smooth it over 14 periods.
RSI: Calculated with ta.rsi(close, rsiPeriod) over 14 periods.
Price Selection: The priceToCheck function selects the price type (Close, High, or Low) for breakout detection.
3. Pivot Detection
Pivot points are detected using ta.pivothigh and ta.pivotlow for each trend line type. The lookback period is set to the respective trend line length (e.g., 50 for Main, 21 for Mid, 9 for Short).
4. Trend Line Logic
For each trend line type (Main, Mid, Short):
Bearish Trend Lines: Identified when two consecutive pivot highs form a downward slope. The script validates the trend line using strict mode and post-pivot break checks.
Bullish Trend Lines: Identified when two consecutive pivot lows form an upward slope, with similar validation.
Trend lines are drawn using line.new, with separate lines for the initial segment (between pivots) and the extended segment (from the second pivot forward).
5. Breakout Detection and Labeling
Breakouts are detected when the selected price crosses the trend line level. The script checks:
Volume conditions (above average and aligned with candle direction).
ADX condition (above threshold).
RSI condition (within thresholds if enabled). Labels are created with label.new, and alerts are triggered with alert.
6. Trend Line Extension
The extendTrendline function dynamically updates the trend line’s endpoint unless a breakout occurs. It uses strict mode checks to ensure the trend line remains valid.
7. Previous Trend Lines
If enabled, previous main trend lines are stored in arrays (previousBearishStartLines, previousBullishTrendLines, etc.) and displayed on the chart, providing historical context.
Disclaimer:
The information and publications are not intended to be, nor do they constitute, financial, investment, trading, or other types of advice or recommendations provided or endorsed by TradingView.

Smart Liquidity Wave [The_lurker]"Smart Liquidity Wave" هو مؤشر تحليلي متطور يهدف لتحديد نقاط الدخول والخروج المثلى بناءً على تحليل السيولة، قوة الاتجاه، وإشارات السوق المفلترة. يتميز المؤشر بقدرته على تصنيف الأدوات المالية إلى أربع فئات سيولة (ضعيفة، متوسطة، عالية، عالية جدًا)، مع تطبيق شروط مخصصة لكل فئة تعتمد على تحليل الموجات السعرية، الفلاتر المتعددة، ومؤشر ADX.
فكرة المؤشر
الفكرة الأساسية هي الجمع بين قياس السيولة اليومية الثابتة وتحليل ديناميكي للسعر باستخدام فلاتر متقدمة لتوليد إشارات دقيقة. المؤشر يركز على تصفية الضوضاء في السوق من خلال طبقات متعددة من التحليل، مما يجعله أداة ذكية تتكيف مع الأدوات المالية المختلفة بناءً على مستوى سيولتها.
طريقة عمل المؤشر
1- قياس السيولة:
يتم حساب السيولة باستخدام متوسط حجم التداول على مدى 14 يومًا مضروبًا في سعر الإغلاق، ويتم ذلك دائمًا على الإطار الزمني اليومي لضمان ثبات القيمة بغض النظر عن الإطار الزمني المستخدم في الرسم البياني.
يتم تصنيف السيولة إلى:
ضعيفة: أقل من 5 ملايين (قابل للتعديل).
متوسطة: من 5 إلى 20 مليون.
عالية: من 20 إلى 50 مليون.
عالية جدًا: أكثر من 50 مليون.
هذا الثبات في القياس يضمن أن تصنيف السيولة لا يتغير مع تغير الإطار الزمني، مما يوفر أساسًا موثوقًا للإشارات.
2- تحليل الموجات السعرية:
يعتمد المؤشر على تحليل الموجات باستخدام متوسطات متحركة متعددة الأنواع (مثل SMA، EMA، WMA، HMA، وغيرها) يمكن للمستخدم اختيارها وتخصيص فتراتها ، يتم دمج هذا التحليل مع مؤشرات إضافية مثل RSI (مؤشر القوة النسبية) وMFI (مؤشر تدفق الأموال) بوزن محدد (40% للموجات، 30% لكل من RSI وMFI) للحصول على تقييم شامل للاتجاه.
3- الفلاتر وطريقة عملها:
المؤشر يستخدم نظام فلاتر متعدد الطبقات لتصفية الإشارات وتقليل الضوضاء، وهي من أبرز الجوانب المخفية التي تعزز دقته:
الفلتر الرئيسي (Main Filter):
يعمل على تنعيم التغيرات السعرية السريعة باستخدام معادلة رياضية تعتمد على تحليل الإشارات (Signal Processing).
يتم تطبيقه على السعر لاستخراج الاتجاهات الأساسية بعيدًا عن التقلبات العشوائية، مع فترة زمنية قابلة للتعديل (افتراضي: 30).
يستخدم تقنية مشابهة للفلاتر عالية التردد (High-Pass Filter) للتركيز على الحركات الكبيرة.
الفلتر الفرعي (Sub Filter):
يعمل كطبقة ثانية للتصفية، مع فترة أقصر (افتراضي: 12)، لضبط الإشارات بدقة أكبر.
يستخدم معادلات تعتمد على الترددات المنخفضة للتأكد من أن الإشارات الناتجة تعكس تغيرات حقيقية وليست مجرد ضوضاء.
إشارة الزناد (Signal Trigger):
يتم تطبيق متوسط متحرك على نتائج الفلتر الرئيسي لتوليد خط إشارة (Signal Line) يُقارن مع عتبات محددة للدخول والخروج.
يمكن تعديل فترة الزناد (افتراضي: 3 للدخول، 5 للخروج) لتسريع أو تبطيء الإشارات.
الفلتر المربع (Square Filter):
خاصية مخفية تُفعّل افتراضيًا تعزز دقة الفلاتر عن طريق تضييق نطاق التذبذبات المسموح بها، مما يقلل من الإشارات العشوائية في الأسواق المتقلبة.
4- تصفية الإشارات باستخدام ADX:
يتم استخدام مؤشر ADX كفلتر نهائي للتأكد من قوة الاتجاه قبل إصدار الإشارة:
ضعيفة ومتوسطة: دخول عندما يكون ADX فوق 40، خروج فوق 50.
عالية: دخول فوق 40، خروج فوق 55.
عالية جدًا: دخول فوق 35، خروج فوق 38.
هذه العتبات قابلة للتعديل، مما يسمح بتكييف المؤشر مع استراتيجيات مختلفة.
5- توليد الإشارات:
الدخول: يتم إصدار إشارة شراء عندما تنخفض خطوط الإشارة إلى ما دون عتبة محددة (مثل -9) مع تحقق شروط الفلاتر، السيولة، وADX.
الخروج: يتم إصدار إشارة بيع عندما ترتفع الخطوط فوق عتبة (مثل 109 أو 106 حسب الفئة) مع تحقق الشروط الأخرى.
تُعرض الإشارات بألوان مميزة (أزرق للدخول، برتقالي للضعيفة والمتوسطة، أحمر للعالية والعالية جدًا) وبثلاثة أحجام (صغير، متوسط، كبير).
6- عرض النتائج:
يظهر مستوى السيولة الحالي في جدول في أعلى يمين الرسم البياني، مما يتيح للمستخدم معرفة فئة الأصل بسهولة.
7- دعم التنبيهات:
تنبيهات فورية لكل فئة سيولة، مما يسهل التداول الآلي أو اليدوي.
%%%%% الجوانب المخفية في الكود %%%%%
معادلات الفلاتر المتقدمة: يستخدم المؤشر معادلات رياضية معقدة مستوحاة من معالجة الإشارات لتنعيم البيانات واستخراج الاتجاهات، مما يجعله أكثر دقة من المؤشرات التقليدية.
التكيف التلقائي: النظام يضبط نفسه داخليًا بناءً على التغيرات في السعر والحجم، مع عوامل تصحيح مخفية (مثل معامل التنعيم في الفلاتر) للحفاظ على الاستقرار.
التوزيع الموزون: الدمج بين الموجات، RSI، وMFI يتم بأوزان محددة (40%، 30%، 30%) لضمان توازن التحليل، وهي تفاصيل غير ظاهرة مباشرة للمستخدم لكنها تؤثر على النتائج.
الفلتر المربع: خيار مخفي يتم تفعيله افتراضيًا لتضييق نطاق الإشارات، مما يقلل من التشتت في الأسواق ذات التقلبات العالية.
مميزات المؤشر
1- فلاتر متعددة الطبقات: تضمن تصفية الضوضاء وإنتاج إشارات موثوقة فقط.
2- ثبات السيولة: قياس السيولة اليومي يجعل التصنيف متسقًا عبر الإطارات الزمنية.
3- تخصيص شامل: يمكن تعديل حدود السيولة، عتبات ADX، فترات الفلاتر، وأنواع المتوسطات المتحركة.
4- إشارات مرئية واضحة: تصميم بصري يسهل التفسير مع تنبيهات فورية.
5- تقليل الإشارات الخاطئة: الجمع بين الفلاتر وADX يعزز الدقة ويقلل من التشتت.
إخلاء المسؤولية
لا يُقصد بالمعلومات والمنشورات أن تكون، أو تشكل، أي نصيحة مالية أو استثمارية أو تجارية أو أنواع أخرى من النصائح أو التوصيات المقدمة أو المعتمدة من TradingView.
#### **What is the Smart Liquidity Wave Indicator?**
"Smart Liquidity Wave" is an advanced analytical indicator designed to identify optimal entry and exit points based on liquidity analysis, trend strength, and filtered market signals. It stands out with its ability to categorize financial instruments into four liquidity levels (Weak, Medium, High, Very High), applying customized conditions for each category based on price wave analysis, multi-layered filters, and the ADX (Average Directional Index).
#### **Concept of the Indicator**
The core idea is to combine a stable daily liquidity measurement with dynamic price analysis using sophisticated filters to generate precise signals. The indicator focuses on eliminating market noise through multiple analytical layers, making it an intelligent tool that adapts to various financial instruments based on their liquidity levels.
#### **How the Indicator Works**
1. **Liquidity Measurement:**
- Liquidity is calculated using the 14-day average trading volume multiplied by the closing price, always based on the daily timeframe to ensure value consistency regardless of the chart’s timeframe.
- Liquidity is classified as:
- **Weak:** Less than 5 million (adjustable).
- **Medium:** 5 to 20 million.
- **High:** 20 to 50 million.
- **Very High:** Over 50 million.
- This consistency in measurement ensures that liquidity classification remains unchanged across different timeframes, providing a reliable foundation for signals.
2. **Price Wave Analysis:**
- The indicator relies on wave analysis using various types of moving averages (e.g., SMA, EMA, WMA, HMA, etc.), which users can select and customize in terms of periods.
- This analysis is integrated with additional indicators like RSI (Relative Strength Index) and MFI (Money Flow Index), weighted specifically (40% waves, 30% RSI, 30% MFI) to provide a comprehensive trend assessment.
3. **Filters and Their Functionality:**
- The indicator employs a multi-layered filtering system to refine signals and reduce noise, a key hidden feature that enhances its accuracy:
- **Main Filter:**
- Smooths rapid price fluctuations using a mathematical equation rooted in signal processing techniques.
- Applied to price data to extract core trends away from random volatility, with an adjustable period (default: 30).
- Utilizes a technique similar to high-pass filters to focus on significant movements.
- **Sub Filter:**
- Acts as a secondary filtering layer with a shorter period (default: 12) for finer signal tuning.
- Employs low-frequency-based equations to ensure resulting signals reflect genuine changes rather than mere noise.
- **Signal Trigger:**
- Applies a moving average to the main filter’s output to generate a signal line, compared against predefined entry and exit thresholds.
- Trigger period is adjustable (default: 3 for entry, 5 for exit) to speed up or slow down signals.
- **Square Filter:**
- A hidden feature activated by default, enhancing filter precision by narrowing the range of permissible oscillations, reducing random signals in volatile markets.
4. **Signal Filtering with ADX:**
- ADX is used as a final filter to confirm trend strength before issuing signals:
- **Weak and Medium:** Entry when ADX exceeds 40, exit above 50.
- **High:** Entry above 40, exit above 55.
- **Very High:** Entry above 35, exit above 38.
- These thresholds are adjustable, allowing the indicator to adapt to different trading strategies.
5. **Signal Generation:**
- **Entry:** A buy signal is triggered when signal lines drop below a specific threshold (e.g., -9) and conditions for filters, liquidity, and ADX are met.
- **Exit:** A sell signal is issued when signal lines rise above a threshold (e.g., 109 or 106, depending on the category) with all conditions satisfied.
- Signals are displayed in distinct colors (blue for entry, orange for Weak/Medium, red for High/Very High) and three sizes (small, medium, large).
6. **Result Display:**
- The current liquidity level is shown in a table at the top-right of the chart, enabling users to easily identify the asset’s category.
7. **Alert Support:**
- Instant alerts are provided for each liquidity category, facilitating both automated and manual trading.
#### **Hidden Aspects in the Code**
- **Advanced Filter Equations:** The indicator uses complex mathematical formulas inspired by signal processing to smooth data and extract trends, making it more precise than traditional indicators.
- **Automatic Adaptation:** The system internally adjusts based on price and volume changes, with hidden correction factors (e.g., smoothing coefficients in filters) to maintain stability.
- **Weighted Distribution:** The integration of waves, RSI, and MFI uses fixed weights (40%, 30%, 30%) for balanced analysis, a detail not directly visible but impactful on results.
- **Square Filter:** A hidden option, enabled by default, narrows signal range to minimize dispersion in high-volatility markets.
#### **Indicator Features**
1. **Multi-Layered Filters:** Ensures noise reduction and delivers only reliable signals.
2. **Liquidity Stability:** Daily liquidity measurement keeps classification consistent across timeframes.
3. **Comprehensive Customization:** Allows adjustments to liquidity thresholds, ADX levels, filter periods, and moving average types.
4. **Clear Visual Signals:** User-friendly design with easy-to-read visuals and instant alerts.
5. **Reduced False Signals:** Combining filters and ADX enhances accuracy and minimizes clutter.
#### **Disclaimer**
The information and publications are not intended to be, nor do they constitute, financial, investment, trading, or other types of advice or recommendations provided or endorsed by TradingView.

Trend Strength Momentum Indicator (TSMI)Introducing the Trend Strength Momentum Indicator (TSMI)
With over two decades of experience, I've found that no single indicator can consistently predict market movements. The key lies in combining multiple indicators to capture different market dimensions—trend, momentum, and volume. With this in mind, I present the Trend Strength Momentum Indicator (TSMI), a comprehensive tool designed to spot emerging uptrends and downtrends in cryptocurrency and other asset markets.
1. Overview of TSMI
The TSMI amalgamates three critical market aspects:
Trend Direction and Strength: Utilizing Moving Averages (MA) and the Average Directional Index (ADX).
Momentum: Incorporating the Moving Average Convergence Divergence (MACD) and the Relative Strength Index (RSI).
Volume Confirmation: Employing the On-Balance Volume (OBV) indicator.
By combining these elements, TSMI aims to provide a robust signal that not only indicates the direction of the trend but also confirms its strength and sustainability through momentum and volume analysis.
2. Components and Calculations
A. Trend Component
Exponential Moving Averages (EMA):
50-day EMA: Captures the short to medium-term trend.
200-day EMA: Reflects the long-term trend.
Average Directional Index (ADX):
Measures the strength of the trend regardless of its direction.
A value above 25 indicates a strong trend, while below 20 suggests a weak or non-trending market.
B. Momentum Component
Moving Average Convergence Divergence (MACD):
Calculated by subtracting the 26-day EMA from the 12-day EMA.
The MACD line crossing above the signal line (9-day EMA of MACD) indicates bullish momentum; crossing below suggests bearish momentum.
Relative Strength Index (RSI):
Oscillates between 0 and 100.
Readings above 70 indicate overbought conditions; below 30 suggest oversold conditions.
C. Volume Component
On-Balance Volume (OBV):
Cumulatively adds volume on up days and subtracts volume on down days.
A rising OBV alongside rising prices confirms an uptrend; divergence may signal a reversal.
3. TSMI Calculation Steps
Step 1: Trend Analysis
EMA Crossover:
Identify if the 50-day EMA crosses above the 200-day EMA (Golden Cross), indicating a potential uptrend.
Conversely, if the 50-day EMA crosses below the 200-day EMA (Death Cross), it may signal a downtrend.
ADX Confirmation:
Confirm the strength of the trend. An ADX value above 25 supports the EMA crossover signal.
Step 2: Momentum Assessment
MACD Evaluation:
Look for MACD crossing above its signal line for bullish momentum or below for bearish momentum.
RSI Check:
Ensure RSI is not in overbought (>70) or oversold (<30) territory to avoid potential reversals against the trend.
Step 3: Volume Verification
OBV Direction:
Confirm that OBV is moving in the same direction as the price trend.
Rising OBV with rising prices strengthens the bullish signal; falling OBV with falling prices strengthens the bearish signal.
Step 4: Composite Signal Generation
Bullish Signal:
50-day EMA crosses above 200-day EMA (Golden Cross).
ADX above 25, indicating a strong trend.
MACD crosses above its signal line.
RSI is between 30 and 70, avoiding overbought conditions.
OBV is rising.
Bearish Signal:
50-day EMA crosses below 200-day EMA (Death Cross).
ADX above 25.
MACD crosses below its signal line.
RSI is between 30 and 70, avoiding oversold conditions.
OBV is falling.
4. How to Use the TSMI
A. Entry Points
Buying into an Uptrend:
Wait for the bullish signal criteria to align.
Enter the position after the 50-day EMA crosses above the 200-day EMA, supported by positive momentum (MACD and RSI) and volume (OBV).
Selling or Shorting into a Downtrend:
Look for the bearish signal criteria.
Initiate the position after the 50-day EMA crosses below the 200-day EMA, with confirming momentum and volume indicators.
B. Exit Strategies
Protecting Profits:
Monitor RSI for overbought or oversold conditions, which may indicate potential reversals.
Watch for MACD divergences or crossovers against your position.
Use trailing stops based on the ATR (Average True Range) to allow profits to run while protecting against sharp reversals.
C. Risk Management
Position Sizing:
Use the ADX value to adjust position sizes. A stronger trend (higher ADX) may justify a larger position, whereas a weaker trend suggests caution.
Avoiding False Signals:
Be cautious during sideways markets where EMAs may whipsaw.
Confirm signals with multiple indicators before acting.
5. Examples
Example 1: Spotting an Emerging Uptrend in Bitcoin
Date: Let's assume on March 1st.
Observations:
EMA Crossover: The 50-day EMA crosses above the 200-day EMA.
ADX: Reading is 28, indicating a strong trend.
MACD: Crosses above the signal line and moves into positive territory.
RSI: Reading is 55, comfortably away from overbought levels.
OBV: Shows a rising trend, confirming increasing buying pressure.
Action:
Enter a long position in Bitcoin.
Set a stop-loss below recent swing lows.
Outcome:
Over the next few weeks, Bitcoin's price continues to rise, validating the TSMI signal.
Example 2: Identifying a Downtrend in Ethereum
Date: Let's assume on July 15th.
Observations:
EMA Crossover: The 50-day EMA crosses below the 200-day EMA.
ADX: Reading is 30, confirming a strong trend.
MACD: Crosses below the signal line into negative territory.
RSI: Reading is 45, not yet oversold.
OBV: Declining, indicating selling pressure.
Action:
Initiate a short position or exit long positions in Ethereum.
Place a stop-loss above recent resistance levels.
Outcome:
Ethereum's price declines over the following weeks, confirming the downtrend.
6. When to Use the TSMI
Trending Markets: TSMI is most effective in markets exhibiting clear trends, whether bullish or bearish.
Avoiding Sideways Markets: In range-bound markets, EMAs and momentum indicators may provide false signals. ADX readings below 20 suggest it's best to stay on the sidelines.
Volatile Assets: Particularly useful in cryptocurrency markets, which are known for their volatility and extended trends.
7. Limitations and Considerations
Lagging Indicators: Moving averages and ADX are lagging by nature. Rapid reversals may not be immediately captured.
False Signals: No indicator is foolproof. Always confirm signals with multiple components of TSMI.
Market Conditions: External factors like news events can significantly impact prices. Consider combining TSMI with fundamental analysis.
8. Enhancing TSMI
Customization: Adjust EMA periods (e.g., 20-day and 100-day) based on the asset's volatility and your trading timeframe.
Additional Indicators: Incorporate Bollinger Bands to gauge volatility or Fibonacci retracement levels to identify potential support and resistance.
Conclusion
The Trend Strength Momentum Indicator (TSMI) offers a holistic approach to spotting emerging trends by combining trend direction, momentum, and volume. By synthesizing the strengths of various traditional indicators while mitigating their individual limitations, TSMI provides traders with a powerful tool to navigate the complex landscape of cryptocurrency and other asset markets.
Key Benefits of TSMI:
Comprehensive Analysis: Integrates multiple market dimensions for well-rounded insights.
Early Trend Identification: Aims to spot trends early for optimal entry points.
Risk Management: Helps in making informed decisions, thereby reducing exposure to false signals.
By applying TSMI diligently and complementing it with sound risk management practices, traders can enhance their ability to capitalize on market trends and improve their overall trading performance.

GC Strategy with Trend Filter and Sudden Move Profit TakingBYBIT:BTCUSDT.P 15M
Situation Assessment with Three Moving Averages
The strategy uses the crossover of the 5SMA and 25SMA as entry signals.
Additionally, the 75SMA is used as a filter. Long entries are only allowed when the price is above the 75SMA, and short entries are only allowed when the price is below the 75SMA.
ADX Filter
The Average Directional Index (ADX) is used to check the strength of the trend. Entry signals are only activated when the ADX is above 20. This ensures that trades are only executed when the trend is strong.
Sudden Move Detection
The strategy detects sudden price movements. If a sudden move occurs, the position is closed to lock in profits.
Entry
Long Entry: When the 5SMA crosses above the 25SMA, the price is above the 75SMA, and the ADX is above 20.
Short Entry: When the 5SMA crosses below the 25SMA, the price is below the 75SMA, and the ADX is above 20.
Exit
Positions are closed if a sudden move occurs. Positions are also closed if an opposing entry signal is generated.
This strategy aims to confirm the strength of the trend using moving average crossovers and ADX and to lock in profits based on sudden price movements.
3本の移動平均線による状況判断
5SMAと25SMA のクロスオーバーをエントリーシグナルとして使用します。
さらに、75SMAをフィルターとして使用し、価格が75SMAの上にある場合のみロングエントリーを許可し、75SMAの下にある場合のみショートエントリーを許可します。
ADXフィルター
ADX(平均方向性指数)を使ってトレンドの強さを確認します。
ADXが20より大きい場合のみ、エントリーシグナルを有効にします。これにより、トレンドが強い時にのみ取引を行うことができます。
急激な変動検知
価格の急激な変動を検出します。
急激な変動があった場合には、ポジションをクローズして利益を確定します。
エントリー
ロングエントリー
5SMAが25SMAを上にクロスし、価格が75SMAの上にあり、ADXが20を超えているとき。
ショートエントリー
5SMAが25SMAを下にクロスし、価格が75SMAの下にあり、ADXが20を超えているとき。
エグジット
急激な変動があった場合、ポジションをクローズします。
反対のエントリーシグナルが発生した場合にも、ポジションをクローズします。
このストラテジーは、移動平均のクロスオーバーとADXを使ってトレンドの強さを確認し、急激な変動に基づいて利益を確定することを目的としています。
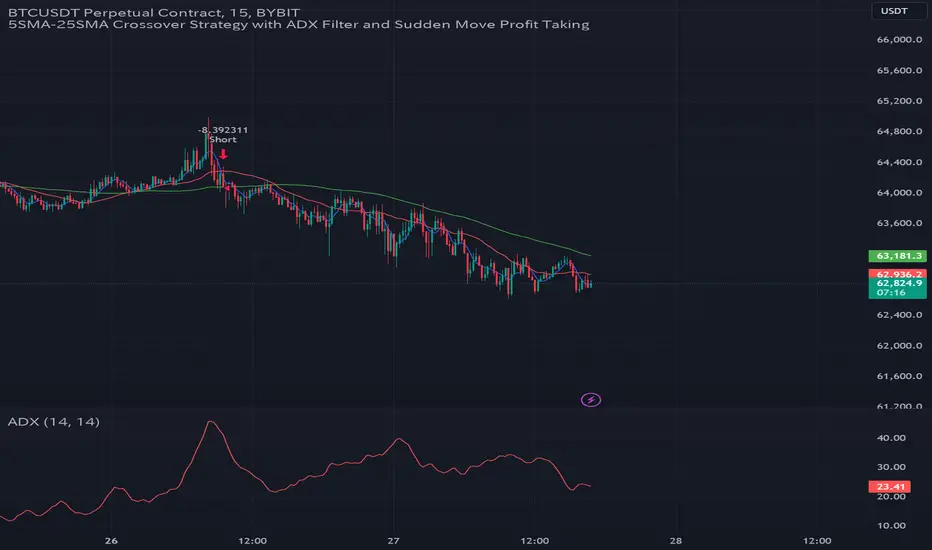
BITMEX Bybit binance bitstamp Coinbase HUOBI BTC ETH TRENDBITMEX Bybit binance bitstamp Coinbase HUOBI BTC ETH TREND
This is a very effective trend strategy.
Strategy principle
Constructs the trailing ATR stop above or below the price, and switches directions when the source price breaks the ATR stop.
Uses the Average Directional Index (ADX) to switch between ATR multipliers. The higher multiplier is used when the ADX is rising, and the lower ATR multiplier is used with the ADX is falling.
This ADX criteria further widens the gap between the source price and the trailing ATR stop when the price is trending,and lessens the gap between the ATR and the price when then price is not trending.
The ATR-ADX stop is effectively a double adapative stop that trails the price,by both adapting to the true range of the price, and the average directional change.
HOW TO USE
set long position when a green arrow appears in the chart.
When the stop is below the price (long trade) the value never decreases until the price intersects the stop, and it reverses to being above the price (short trade)。
set short position when a red arrow appears in the chart.
When the stop is above the price it will never increase until it is intersected by the price. As the true range and ADX change, the stop will move more quickly or more slowly.
For the long position and the short direction, you can set the stop profit & stop loss or trailing profit stop & trailing stop loss respectively.
When a purple arrow appears to close a position, an aggressive trader can go in the opposite direction when it is purple.
Strategy applicability
The default setting is for bitmex perpetual swap contract XBTUSD , bybit BTCUSD perpetual futures contract ,binance btcusdt Spot,Bitfinex BTCUSD Spot,bitflyer BTCJPY Spot,bithumb BTCKRW Spot,bitso BTCMXN Spot, bitstamp BTCUSD Spot,bittrex BTCUSDT Spot,Coinbase BTCUSD spot, deribit BTCPERP perpetual futures contract,gemini BTCUSD Spot,Hitbit BTCUSDT Spot,huobi BTCUSDT Spot KRAKEN XBTUSD spot,OKCOIN OKEX BTCUSD3M BTCUSD BTCUSD2W,Poloniex BTCUSDT Spot etc btc symbol with 2 hour timeframe.
This indicator has broad applicability and can be applied to multiple different symbols.
This indicator also applies to the ETHUSD ETHBTC EOSBTC BNBBTC symbol etc, just adjust the default configuration.
Using the alert of the indicator, it can work well on the trading robot like Gunbot,autoview, without repaint false signals.
这是非常有效的趋势策略。
策略原理
在价格之上或之下构造追踪的支撑压力位并在源价格突破压力位时的切换操作方向,使用平均趋向指数(ADX)与ATR系数之间切换。
当ADX上升时使用上升的ATR系数,而ADX时下降时使用下降的ATR系数。
当价格趋势变化时,ADX参数在价格趋向变大时使源价格止损点与后续ATR进一步扩大,并在价格趋向平缓时减小了ATR与价格之间的差距。
如何使用
ATR-ADX压力线通过适应价格的真实波动范围和平均趋向变动达到跟随价格的双适应性止损目的。当做多时,止损线低于价格,并随价格升高,直到止损线与价格相交,然后反转至高于价格,此时启动空头交易;
在图表中出现绿色箭头就做多。
当做空时,止损线高于价格,并随价格降低,直到止损线与价格相交,然后反转至低于价格,此时启动多头交易;在图表中出现红色箭头就做空。随着真实波动和ADX的变化,止损线将移动得更快或更慢。
对于多头头寸和空头方向,您可以分别设置止损和止损或尾随利润止损和尾随止损;当出现紫色箭头时平仓,激进的交易者,可以在紫色时就做反方向。
策略适用性
默认设置是针对bitmex交易所 XBTUSD永久掉期合约,BYBIT交易所 BTCUSD永续期货合约,binance币安交易所 btcusdt现货,Bitfinex交易所 BTCUSD现货,bitflyer交易所 BTCJPY现货,bithumb交易所 BTCKRW现货,bitso交易所 BTCMXN现货,bitstamp交易所 BTCUSD现货,bittrex交易所 BTCUSDT现货,Coinbase交易所 BTCUSD现货,deribit交易所 BTCPERP永续期货合约,gemini双子星交易所 BTCUSD现货,Hitbit交易所 BTCUSDT现货,huobi火币交易所 BTCUSDT现货,KRAKEN交易所 XBTUSD现货,OKCOIN OKEX交易所 BTCUSD3M OK BTC季度合约 BTCUSD BTCUSD2W OK BTC次周合约,Poloniex BTCUSDT现货等2小时区间的btc交易。
Bitmex XBTUSD 2H 比特币合约
Binance币安 BTCUSDT 2H 比特币现货
Bitfinex BTCUSD 2H 比特币现货
Bitstamp BTCUSD 2H 比特币现货
COINBASE BTCUSD 2H 比特币现货
HUOBI火币 BTCUSDT 2H 比特币现货
OKEX BTCUSD3M 2H 比特币季度合约
Bybit BTCUSD 2H 比特币合约
这个指标具有广泛的适用性,可以适用多个不同交易品种。
该指标还适用于ETHUSD ETHBTC EOSBTC BNBBTC交易品种等,只需调整默认配置即可。
bitmex ETHUSD 2H期货
binance ETHUSDT 2H现货
Bybit ETHUSD 2H合约
HUOBI火币 ETHUSDT 2H现货
OKCOIN ETHUSD1W 2H期货
binance币安EOSBTC 2H
Binance币安 ETHBTC 2H
使用该指标的警报设置,它可以在自动交易机器人上很好地工作,而无重绘错误的信号。
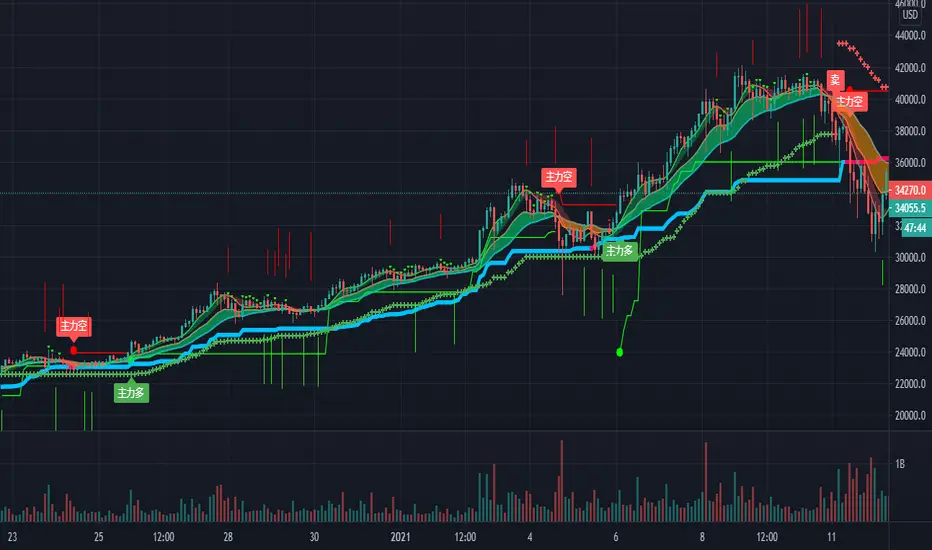

PEAD ScreenerPEAD Screener - Post-Earnings Announcement Drift Scanner
═══════════════════════════════════════════════════════════════
WHY EARNINGS ANNOUNCEMENTS CREATE OPPORTUNITY
═══════════════════════════════════════════════════════════════
The days immediately following an earnings announcement are among the noisiest periods for any stock. Within hours, the market must digest new information about a company's profits, revenue, and future outlook. Analysts scramble to update their models. Institutions rebalance positions. Retail traders react to headlines.
This chaos creates a well-documented phenomenon called Post-Earnings Announcement Drift (PEAD): stocks that beat expectations tend to keep rising, while those that miss tend to keep falling - often for weeks after the initial announcement. Academic research has confirmed this pattern persists across decades and markets.
But not every earnings surprise is equal. A company that beats estimates by 5 cents might move very differently than one that beats by 5 cents with unusually high volume, or one where both earnings AND revenue exceeded expectations. Raw numbers alone don't tell the full story.
═══════════════════════════════════════════════════════════════
HOW "STANDARDIZED UNEXPECTED" METRICS CUT THROUGH THE NOISE
═══════════════════════════════════════════════════════════════
This screener uses a statistical technique to measure how "surprising" a result truly is - not just whether it beat or missed, but how unusual that beat or miss was compared to the company's own history.
The core idea: convert raw surprises into Z-scores.
A Z-score answers the question: "How many standard deviations away from normal is this result?"
- A Z-score of 0 means the result was exactly average
- A Z-score of +2 means the result was unusually high (better than ~95% of historical results)
- A Z-score of -2 means the result was unusually low
By standardizing surprises this way, we can compare apples to apples. A small-cap biotech's $0.02 beat might actually be more significant than a mega-cap's $0.50 beat, once we account for each company's typical variability.
This screener applies this standardization to three dimensions: earnings (SUE), revenue (SURGE), and volume (SUV).
═══════════════════════════════════════════════════════════════
THE 9 SCREENING CRITERIA
═══════════════════════════════════════════════════════════════
─────────────────────────────────────────
1. SUE (Standardized Unexpected Earnings)
─────────────────────────────────────────
WHAT IT IS:
SUE measures how surprising an earnings result was, adjusted for the company's historical forecast accuracy.
Calculation: Take the earnings surprise (actual EPS minus analyst estimate), then divide by the standard deviation of past forecast errors. This uses a rolling window of the last 8 quarters by default.
Formula: SUE = (Actual EPS - Estimated EPS) / Standard Deviation of Past Errors
HOW TO INTERPRET:
- SUE > +2.0: Strongly positive surprise - earnings beat expectations by an unusually large margin. These stocks often continue drifting higher.
- SUE between 0 and +2.0: Modest positive surprise - beat expectations, but within normal range.
- SUE between -2.0 and 0: Modest negative surprise - missed expectations, but within normal range.
- SUE < -2.0: Strongly negative surprise - significant miss. These stocks often continue drifting lower.
For long positions, look for SUE values above +2.0, ideally combined with positive SURGE.
─────────────────────────────────────────
2. SURGE (Standardized Unexpected Revenue)
─────────────────────────────────────────
WHAT IT IS:
SURGE applies the same standardization technique to revenue surprises. While earnings can be manipulated through accounting choices, revenue is harder to fake - it represents actual sales.
Calculation: Take the revenue surprise (actual revenue minus analyst estimate), then divide by the standard deviation of past revenue forecast errors.
Formula: SURGE = (Actual Revenue - Estimated Revenue) / Standard Deviation of Past Errors
HOW TO INTERPRET:
- SURGE > +1.5: Strongly positive revenue surprise - the company sold significantly more than expected.
- SURGE between 0 and +1.5: Modest positive surprise.
- SURGE < 0: Revenue missed expectations.
The most powerful signals occur when BOTH SUE and SURGE are positive and elevated (ideally SUE > 2.0 AND SURGE > 1.5). This indicates the company beat on both profitability AND top-line growth - a much stronger signal than either alone.
When SUE and SURGE diverge significantly (e.g., high SUE but negative SURGE), treat with caution - the earnings beat may have come from cost-cutting rather than genuine growth.
─────────────────────────────────────────
3. SUV (Standardized Unexpected Volume)
─────────────────────────────────────────
WHAT IT IS:
SUV detects unusual trading volume after accounting for how volatile the stock is. More volatile stocks naturally have higher volume, so raw volume comparisons can be misleading.
Calculation: This uses regression analysis to model the expected relationship between price volatility and volume. The "unexpected" volume is the residual - how much actual volume deviated from what the model predicted. This residual is then standardized into a Z-score.
In plain terms: SUV asks "Given how much this stock typically moves, is today's volume unusually high or low?"
HOW TO INTERPRET:
- SUV > +2.0: Exceptionally high volume relative to the stock's volatility. This often signals institutional activity - big players moving in or out.
- SUV between +1.0 and +2.0: Elevated volume - above normal interest.
- SUV between -1.0 and +1.0: Normal volume range.
- SUV < -1.0: Unusually quiet - less activity than expected.
High SUV combined with positive price movement suggests accumulation (buying). High SUV combined with negative price movement suggests distribution (selling).
─────────────────────────────────────────
4. % From D0 Close
─────────────────────────────────────────
WHAT IT IS:
This measures how far the current price has moved from the closing price on its initial earnings reaction day (D0). The "reaction day" is the first trading day that fully reflects the earnings news - typically the day after an after-hours announcement, or the announcement day itself for pre-market releases.
Calculation: ((Current Price - D0 Close) / D0 Close) × 100
HOW TO INTERPRET:
- Positive values: Stock has gained ground since earnings. The higher the percentage, the stronger the post-earnings drift.
- 0% to +5%: Modest positive drift - earnings were received well but momentum is limited.
- +5% to +15%: Strong drift - buyers continue accumulating.
- > +15%: Exceptional drift - significant institutional interest likely.
- Negative values: Stock has given back gains or extended losses since earnings. May indicate the initial reaction was overdone, or that sentiment is deteriorating.
This metric is most meaningful within the first 5-20 trading days after earnings. Extended drift (maintaining gains over 2+ weeks) is a stronger signal than a quick spike that fades.
─────────────────────────────────────────
5. # Pocket Pivots
─────────────────────────────────────────
WHAT IT IS:
Pocket Pivots are a volume-based pattern developed by Chris Kacher and Gil Morales. They identify days where institutional buyers are likely accumulating shares without causing obvious breakouts.
Calculation: A Pocket Pivot occurs when:
- The stock closes higher than it opened (up day)
- The stock closes higher than the previous day's close
- Today's volume exceeds the highest down-day volume of the prior 10 trading sessions
The screener counts how many Pocket Pivots have occurred since the earnings announcement.
HOW TO INTERPRET:
- 0 Pocket Pivots: No detected institutional accumulation patterns since earnings.
- 1-2 Pocket Pivots: Some institutional buying interest - worth monitoring.
- 3+ Pocket Pivots: Strong accumulation signal - institutions appear to be building positions.
Pocket Pivots are most significant when they occur:
- Immediately following earnings announcements
- Near moving average support (10-day, 21-day, or 50-day)
- On above-average volume
- After a period of price consolidation
Multiple Pocket Pivots in a short period suggest sustained institutional demand, not just a one-day event.
─────────────────────────────────────────
6. ADX/DI (Trend Strength and Direction)
─────────────────────────────────────────
WHAT IT IS:
ADX (Average Directional Index) measures trend strength regardless of direction. DI (Directional Indicator) shows whether the trend is bullish or bearish.
Calculation: ADX uses a 14-period lookback to measure how directional (trending) price movement is. Values range from 0 to 100. The +DI and -DI components compare upward and downward movement.
The screener shows:
- ADX value (trend strength)
- Direction indicator: "+" for bullish (price trending up), "-" for bearish (price trending down)
HOW TO INTERPRET:
- ADX < 20: Weak trend - the stock is moving sideways, choppy. Not ideal for momentum trading.
- ADX 20-25: Trend is emerging - potentially starting a directional move.
- ADX 25-40: Strong trend - clear directional movement. Good for momentum plays.
- ADX > 40: Very strong trend - powerful move in progress, but may be extended.
The direction indicator (+/-) tells you which way:
- "25+" means ADX of 25 with bullish direction (uptrend)
- "25-" means ADX of 25 with bearish direction (downtrend)
For post-earnings plays, ideal setups show ADX rising above 25 with positive direction, confirming the earnings reaction is developing into a sustained trend rather than a one-day spike.
─────────────────────────────────────────
7. Institutional Buying PASS
─────────────────────────────────────────
WHAT IT IS:
This proprietary composite indicator detects patterns consistent with institutional accumulation at three stages after earnings:
EARLY (Days 0-4): Looks for "large block" buying on the earnings reaction day (exceptionally high volume with a close in the upper half of the day's range) combined with follow-through buying on the next day.
MID (Days 5-9): Checks for sustained elevated volume (averaging 1.5x the 20-day average) combined with positive drift and consistent upward price movement (more up days than down days).
LATE (Days 10+): Detects either visible accumulation (positive drift with high volume) OR stealth accumulation (positive drift with unusually LOW volume - suggesting smart money is quietly building positions without attracting attention).
HOW TO INTERPRET:
- Check mark/value of '1': Institutional buying pattern detected. The stock shows characteristics consistent with large players accumulating shares.
- X mark/value of '0': No institutional buying pattern detected. This doesn't mean institutions aren't buying - just that the typical footprints aren't visible.
A passing grade here adds conviction to other bullish signals. Institutions have research teams, information advantages, and long time horizons. When their footprints appear in the data, it often precedes sustained moves.
Important: This is a pattern detection tool, not a guarantee. Always combine with other analysis.
─────────────────────────────────────────
8. Strong ATR Drift PASS
─────────────────────────────────────────
WHAT IT IS:
This measures whether the stock has drifted significantly relative to its own volatility. Instead of asking "did it move 10%?", it asks "did it move more than 1.5 ATRs?"
ATR (Average True Range) measures a stock's typical daily movement. A volatile stock might move 5% daily, while a stable stock might move 0.5%. Using ATR normalizes for this difference.
Calculation:
ATR Drift = (Current Close - D0 Close) / D0 ATR in dollars
The indicator passes when ATR Drift exceeds 1.5 AND at least 5 days have passed since earnings.
HOW TO INTERPRET:
- Check mark/value of '1': The stock has drifted more than 1.5 times its average daily range since earnings - a statistically significant move that suggests genuine momentum, not just noise.
- X mark/value of '0': The drift (if any) is within normal volatility bounds - could just be random fluctuation.
Why wait 5 days? The immediate post-earnings reaction (days 0-2) often includes gap fills and noise. By day 5, if the stock is still extended beyond 1.5 ATRs from the earnings close, it suggests real buying pressure, not just a reflexive gap.
A passing grade here helps filter out stocks that "beat earnings" but haven't actually moved meaningfully. It focuses attention on stocks where the market is voting with real capital.
─────────────────────────────────────────
9. Days Since D0
─────────────────────────────────────────
WHAT IT IS:
Simply counts the number of trading days since the earnings reaction day (D0).
HOW TO INTERPRET:
- Days 0-5 (Green): Fresh earnings - the information is new, institutional repositioning is active, and momentum trades are most potent. This is the "sweet spot" for PEAD strategies.
- Days 6-10 (Neutral): Mid-period - some edge remains but diminishing. Good for adding to winning positions, less ideal for new entries.
- Days 11+ (Red): Extended period - most of the post-earnings drift has typically played out. Higher risk that momentum fades or reverses.
Research shows PEAD effects are strongest in the first 5-10 days after earnings, then decay. Beyond 20-30 days, the informational advantage of the earnings surprise is largely priced in.
Use this to prioritize: focus on stocks with strong signals that are still in the early window, and be more selective about entries as days accumulate.
═══════════════════════════════════════════════════════════════
PUTTING IT ALL TOGETHER
═══════════════════════════════════════════════════════════════
You can use this screener in the chart view or in the Screener.
One combination of the above filters to develop a shortlist of positive drift candidates may be:
- SUE > 2.0 (significant earnings beat)
- SURGE > 1.5 (significant revenue beat)
- Positive % From D0 Close (price confirming the good news)
- Institutional Buying PASS (big players accumulating)
- Strong ATR Drift PASS (statistically significant movement)
- Days Since D0 < 10 (still in the active drift window)
No single indicator is sufficient. The power comes from convergence - when multiple independent measures all point the same direction.
═══════════════════════════════════════════════════════════════
SETTINGS
═══════════════════════════════════════════════════════════════
Key adjustable parameters:
- SUE Method: "Analyst-based" uses consensus estimates; "Time-series" uses year-over-year comparison
- Window Size: Number of quarters used for standardization (default: 8)
- ATR Drift Threshold: Minimum ATR multiple for "strong" classification (default: 1.5)
- Institutional Buying thresholds: Adjustable volume and CLV parameters
═══════════════════════════════════════════════════════════════
DISCLAIMER
═══════════════════════════════════════════════════════════════
This screener is a research tool, not financial advice. Past patterns do not guarantee future results. Always conduct your own due diligence and manage risk appropriately. Post-earnings trading involves significant uncertainty and volatility. The 'SUE' in this indicator does not represent a real person; any similarity to actual Sue's (or Susans for that matter) living or dead is quite frankly ridiculous, not to mention coincidental.

Neural Fusion ProNeural Fusion Pro
Overview
Neural Fusion Pro is a multi-factor scoring system that combines numerous technical analysis methods into a single unified score. Rather than requiring traders to monitor multiple indicators separately, this system synthesizes trend strength, momentum oscillators, volume confirmation, price structure, and price action quality into one composite reading that adapts to current market conditions.
The Scoring System
At the heart of this indicator is a weighted scoring algorithm that produces a value between -1.0 and +1.0. Positive scores indicate bullish conditions across the measured factors, while negative scores suggest bearish conditions. The magnitude of the score reflects the strength of conviction across indicators.
The score is calculated from five distinct components, each capturing a different aspect of market behavior. Users can adjust the weight given to each component based on their trading style and market preferences.
Component 1: Trend Strength and Direction
This component uses the Average Directional Index to measure trend strength and the Directional Movement indicators to determine trend direction. When ADX exceeds the trending threshold, indicating a directional market, the component contributes a positive score if the positive directional indicator leads, or a negative score if the negative directional indicator leads. In ranging markets where ADX is low, this component contributes minimally to avoid false trend signals.
Component 2: Multi-Factor Momentum
Rather than relying on a single oscillator, this component synthesizes readings from RSI, MACD histogram, Stochastic, CCI, and Rate of Change. Each oscillator is normalized to a common scale and weighted according to its reliability characteristics. RSI readings are compared against dynamic thresholds that adjust based on trend state, making the indicator more forgiving in uptrends and more demanding in downtrends.
The component also includes divergence detection. When price makes a higher high but RSI makes a lower high (bearish divergence), or when price makes a lower low but RSI makes a higher low (bullish divergence), the divergence score adjusts the momentum component accordingly.
Component 3: Volume Confirmation
Volume provides crucial confirmation of price movements. This component analyzes On-Balance Volume relative to its moving average and measures the slope of OBV to determine whether volume is supporting the price trend. Additionally, it monitors relative volume by comparing current volume to its recent average, adding confirmation when volume spikes accompany price movements.
Component 4: Price Structure and Volatility
This component evaluates where price sits within the dynamic bands and considers the current volatility regime. When price is near the lower band, the component contributes a bullish score, suggesting potential support. When price is near the upper band, it contributes a bearish score, suggesting potential resistance.
The volatility regime assessment uses ATR percentile ranking. Low volatility periods often precede significant moves, while extremely high volatility may indicate unsustainable conditions.
Component 5: Price Action Quality
This component examines the character of recent candles by tracking the ratio of bullish to bearish candles over a lookback period. Consistent bullish price action contributes a positive score, while consistent bearish action contributes negatively. This helps filter signals by confirming that price behavior aligns with other factors.
Dynamic Bands
The indicator plots adaptive bands around a central basis line. The basis can be configured as either a simple or exponential moving average. Band width is determined by ATR multiplied by a dynamic factor that incorporates both ADX (expanding bands in trending markets) and the Chaikin Oscillator (expanding bands during strong accumulation or distribution).
These bands serve multiple purposes: they provide visual context for price position, they define signal trigger zones, and they help identify overextended conditions.
Trend State Detection
The indicator classifies market conditions into three states that affect signal generation and threshold levels.
Strong Uptrend is identified when ADX is rising, ADX exceeds the strong trend threshold, and the positive directional indicator exceeds the negative. This state triggers the most aggressive buy settings, allowing entries on shallow pullbacks.
Downtrend is identified when the negative directional indicator exceeds positive DI and ADX confirms directional movement. This state applies the most conservative buy settings, requiring deep oversold conditions before generating buy signals.
Neutral applies when neither trend condition is met, using moderate threshold settings appropriate for range-bound or transitional markets.
Dynamic RSI Thresholds
A key innovation is the automatic adjustment of RSI thresholds based on trend state. In a strong uptrend, the buy RSI threshold might be set to 50, allowing entries when RSI merely pulls back to neutral rather than requiring oversold conditions. The sell threshold rises to 72, keeping traders in positions longer during favorable conditions.
In downtrends, the buy RSI threshold drops to 25, ensuring buys only trigger on genuine capitulation. The sell threshold drops to 64, making exits easier to trigger.
In neutral markets, traditional oversold and overbought levels apply, with buy triggers around RSI 30 and sell triggers around RSI 68.
This adaptive approach prevents the common problem of indicators that work well in one market environment but fail in others.
Dynamic Cooldown
The signal cooldown period adjusts based on trend strength. During normal conditions, a standard cooldown prevents signal clustering. When ADX exceeds the strong trend threshold and is rising, indicating a powerful trend, the cooldown period extends. This helps traders stay in winning positions longer by reducing the frequency of counter-trend signals.
Cascade Protection
The indicator includes protection mechanisms to prevent overtrading and averaging down into losing positions.
The BBWP (Bollinger Band Width Percentile) monitor tracks current volatility relative to historical levels. When BBWP exceeds a threshold, indicating a volatility spike often associated with sharp moves, all buy signals are frozen. This protects against entering during panic selloffs or blow-off tops.
The consecutive buy counter tracks how many buy signals have occurred without an intervening sell. After reaching the maximum (default 3), no additional buy signals are generated until a sell occurs. This prevents the destructive pattern of repeatedly buying a declining asset.
Both protection mechanisms are displayed in the information panel, allowing traders to understand why signals may or may not be firing.
Signal Generation
Buy signals require price to touch or penetrate the lower band, RSI to be below the dynamic threshold, and the market to be in a trending state (when that filter is enabled). Additionally, the cooldown period must have elapsed and cascade protection must not be blocking buys.
Sell signals require price to touch or penetrate the upper band, RSI to be above the dynamic threshold, and the cooldown to have elapsed.
Signal labels display the entry price, signal type (shallow dip, capitulation, extended, bounce sell, or neutral), and the current position in the consecutive buy count.
Visual Components
The indicator provides multiple layers of visual feedback.
Cloud shading between the bands changes based on whether the composite score is in a buy zone or sell zone. Green clouds indicate bullish score readings, while red clouds indicate bearish readings.
Background coloring reflects the overall market regime. Green background indicates a bullish regime (positive DI leadership with volume confirmation), red indicates bearish regime, and white indicates neutral conditions.
An ADX bar at the bottom of the chart uses color coding: white for ranging (very low ADX), orange for flat, and blue for trending conditions.
The information panel displays the composite score with color coding, current trend state, active RSI thresholds, divergence status, BBWP freeze status, buy counter, market regime, ADX value with trend indicator, current cooldown setting, and live RSI reading color-coded against the active thresholds.
A debug panel can be enabled to show the individual component scores, helping users understand what is driving the composite reading.
How to Use
Monitor the composite score in the information panel. Readings above the buy threshold combined with price near the lower band represent potential long entries. Readings below the sell threshold with price near the upper band suggest exit opportunities.
Pay attention to the trend state. In strong uptrends, be more willing to buy dips and more patient with holding positions. In downtrends, require stronger confirmation before entering and be quicker to take profits on bounces.
Watch the cascade protection status. If BBWP shows frozen or the buy counter is approaching maximum, exercise additional caution regardless of other signals.
Use the dynamic RSI thresholds as context. When the panel shows buy RSI threshold at 50 (strong uptrend), even a pullback to RSI 45 is a potential entry. When the threshold shows 25 (downtrend), wait for genuine capitulation conditions.
Component Weight Adjustment
The relative importance of each scoring component can be adjusted through the settings. The default weights emphasize trend strength (30%) and momentum (25%), with volume (20%), price structure (15%), and price action (10%) providing confirmation.
For trend-following strategies, consider increasing trend and momentum weights. For mean-reversion approaches, increase the price structure weight to emphasize band position. The weights should sum to approximately 1.0 for proper score scaling.
Settings Guidance
The default settings are calibrated for cryptocurrency markets on lower timeframes. For traditional markets or longer timeframes, consider adjusting the ADX trending threshold (lower values for less volatile assets), the dynamic RSI levels for each trend state, and the cascade protection parameters.
The Heikin Ashi option for band calculation can provide smoother bands but may introduce slight lag. The default setting uses standard price data for better real-time accuracy.
