Strategy Stats [presentTrading]Hello! it's another weekend. This tool is a strategy performance analysis tool. Looking at the TradingView community, it seems few creators focus on this aspect. I've intentionally created a shared version. Welcome to share your idea or question on this.
█ Introduction and How it is Different
Strategy Stats is a comprehensive performance analytics framework designed specifically for trading strategies. Unlike standard strategy backtesting tools that simply show cumulative profits, this analytics suite provides real-time, multi-timeframe statistical analysis of your trading performance.
Multi-timeframe analysis: Automatically tracks performance metrics across the most recent time periods (last 7 days, 30 days, 90 days, 1 year, and 4 years)
Advanced statistical measures: Goes beyond basic metrics to include Information Coefficient (IC) and Sortino Ratio
Real-time feedback: Updates performance statistics with each new trade
Visual analytics: Color-coded performance table provides instant visual feedback on strategy health
Integrated risk management: Implements sophisticated take profit mechanisms with 3-step ATR and percentage-based exits
BTCUSD Performance
The table in the upper right corner is a comprehensive performance dashboard showing trading strategy statistics.
Note: While this presentation uses Vegas SuperTrend as the underlying strategy, this is merely an example. The Stats framework can be applied to any trading strategy. The Vegas SuperTrend implementation is included solely to demonstrate how the analytics module integrates with a trading strategy.
⚠️ Timeframe Limitations
Important: TradingView's backtesting engine has a maximum storage limit of 10,000 bars. When using this strategy stats framework on smaller timeframes such as 1-hour or 2-hour charts, you may encounter errors if your backtesting period is too long.
Recommended Timeframe Usage:
Ideal for: 4H, 6H, 8H, Daily charts and above
May cause errors on: 1H, 2H charts spanning multiple years
Not recommended for: Timeframes below 1H with long history
█ Strategy, How it Works: Detailed Explanation
The Strategy Stats framework consists of three primary components: statistical data collection, performance analysis, and visualization.
🔶 Statistical Data Collection
The system maintains several critical data arrays:
equityHistory: Tracks equity curve over time
tradeHistory: Records profit/loss of each trade
predictionSignals: Stores trade direction signals (1 for long, -1 for short)
actualReturns: Records corresponding actual returns from each trade
For each closed trade, the system captures:
float tradePnL = strategy.closedtrades.profit(tradeIndex)
float tradeReturn = strategy.closedtrades.profit_percent(tradeIndex)
int tradeType = entryPrice < exitPrice ? 1 : -1 // Direction
🔶 Performance Metrics Calculation
The framework calculates several key performance metrics:
Information Coefficient (IC):
The correlation between prediction signals and actual returns, measuring forecast skill.
IC = Correlation(predictionSignals, actualReturns)
Where Correlation is the Pearson correlation coefficient:
Correlation(X,Y) = (nΣXY - ΣXY) / √
Sortino Ratio:
Measures risk-adjusted return focusing only on downside risk:
Sortino = (Avg_Return - Risk_Free_Rate) / Downside_Deviation
Where Downside Deviation is:
Downside_Deviation = √
R_i represents individual returns, T is the target return (typically the risk-free rate), and n is the number of observations.
Maximum Drawdown:
Tracks the largest percentage drop from peak to trough:
DD = (Peak_Equity - Trough_Equity) / Peak_Equity * 100
🔶 Time Period Calculation
The system automatically determines the appropriate number of bars to analyze for each timeframe based on the current chart timeframe:
bars_7d = math.max(1, math.round(7 * barsPerDay))
bars_30d = math.max(1, math.round(30 * barsPerDay))
bars_90d = math.max(1, math.round(90 * barsPerDay))
bars_365d = math.max(1, math.round(365 * barsPerDay))
bars_4y = math.max(1, math.round(365 * 4 * barsPerDay))
Where barsPerDay is calculated based on the chart timeframe:
barsPerDay = timeframe.isintraday ?
24 * 60 / math.max(1, (timeframe.in_seconds() / 60)) :
timeframe.isdaily ? 1 :
timeframe.isweekly ? 1/7 :
timeframe.ismonthly ? 1/30 : 0.01
🔶 Visual Representation
The system presents performance data in a color-coded table with intuitive visual indicators:
Green: Excellent performance
Lime: Good performance
Gray: Neutral performance
Orange: Mediocre performance
Red: Poor performance
█ Trade Direction
The Strategy Stats framework supports three trading directions:
Long Only: Only takes long positions when entry conditions are met
Short Only: Only takes short positions when entry conditions are met
Both: Takes both long and short positions depending on market conditions
█ Usage
To effectively use the Strategy Stats framework:
Apply to existing strategies: Add the performance tracking code to any strategy to gain advanced analytics
Monitor multiple timeframes: Use the multi-timeframe analysis to identify performance trends
Evaluate strategy health: Review IC and Sortino ratios to assess predictive power and risk-adjusted returns
Optimize parameters: Use performance data to refine strategy parameters
Compare strategies: Apply the framework to multiple strategies to identify the most effective approach
For best results, allow the strategy to generate sufficient trade history for meaningful statistical analysis (at least 20-30 trades).
█ Default Settings
The default settings have been carefully calibrated for cryptocurrency markets:
Performance Tracking:
Time periods: 7D, 30D, 90D, 1Y, 4Y
Statistical measures: Return, Win%, MaxDD, IC, Sortino Ratio
IC color thresholds: >0.3 (green), >0.1 (lime), <-0.1 (orange), <-0.3 (red)
Sortino color thresholds: >1.0 (green), >0.5 (lime), <0 (red)
Multi-Step Take Profit:
ATR multipliers: 2.618, 5.0, 10.0
Percentage levels: 3%, 8%, 17%
Short multiplier: 1.5x (makes short take profits more aggressive)
Stop loss: 20%
Поиск скриптов по запросу "backtesting"

Template Trailing Strategy (Backtester)💭 Overview
+ Title: Template Trailing Strategy (Backtester)
+ Author: Iason Nikolas (jason5480)
+ License: CC BY-NC-SA 4.0
💢 What is the "Template Trailing Strategy (Backtester)" ❓
The "Template Trailing Strategy (Backtester)" (TTS) is a back-tester orchestration framework. It supercharges the implementation-test-evaluation lifecycle of new trading strategies, by making it possible to plug in your own trading idea.
While TTS offers a vast number of configuration settings, it primarily allows the trader to:
Test and evaluate your own trading logic that is described in terms of entry, exit, and cancellation conditions.
Define the entry and exit order types as well as their target prices when the limit, stop, or stop-limit order types are used.
Utilize a variety of options regarding the placement of the stop-loss and take-profit target(s) prices and support for well-known techniques like moving to breakeven and trailing.
Provide well-known quantity calculation methods to properly handle risk management and easily evaluate trading strategies and compare them.
Alert on each trading event or any related change through a robust and fully customizable messaging system.
All of the above makes TTS a practical toolkit: once you learn it, many repetitive tasks that strategy authors usually re-implement are eliminated. Using TradingView’s built-in backtesting engine makes testing and comparing ideas straightforward.
By utilizing the TTS one can easily swap "trading logic" by testing, evaluating, and comparing each trading idea and/or individual component of a strategy.
Finally, TTS, through its per-event alert management (and debugging) system, provides an automated solution that supports live trading with brokers via webhooks.
NOTE: The "Template Trailing Strategy (Backtester)" does not dictate how you can combine different indicator types. Thus, it should not be confused as a "Trading System", because it gives its user full flexibility on that end (for better or worse).
💢 What is a "Signal Indicator" ❓
"Signal Indicator" (SI) is an indicator that can output a "signal" that follows a specific convention so that the "Template Trailing Strategy (Backtester)" can "understand" and execute the orders accordingly. The SI realizes the core trading logic signaling to the TTS when to enter, exit, or cancel an order. A SI instructs the TTS "when" to enter or exit, and the TTS determines "how" to enter and exit the position once the Signal Indicator generates a signal.
A very simple example of a Signal Indicator might be a 200-day Simple Moving Average Signal. When the price of the security closes above the 200-day SMA, a SI would provide TTS with a "long entry signal". Once TTS receives the "long entry signal", the TTS will open a long position and send an alert or automated trade message via webhook to a broker, based on the Entry settings defined in TTS. If the TTS Entry settings specify a "Market" order type, then the open long position will be executed by TTS immediately. But if the TTS Entry settings specify a "Stop" order type with a 1% Stop Distance, then when the price of the security rises by 1% after the "long entry signal" occurs, the TTS will open a long position and the Long Entry alert or webhook to the broker will be sent.
🤔 How to Guide
💢 How to connect a "signal" from a "Signal Indicator" ❓
The "Template Trailing Strategy (Backtester)" was designed to receive external signals from a "Signal Indicator". In this way, a "new trading idea" can be developed, configured, and evaluated separately from the TTS. Similarly, the SI can be held constant, and the trading mechanics can change in the TTS settings and back-tested to answer questions such as, "Am I better with a different stop loss placement method, what if I used a limit order instead of a stop order to enter, what if I used 25% margin instead of trading spot market?"
To make that possible by connecting an external signal indicator to TTS, you should:
Add both your SI (e.g. "Two MA Signal Indicator" , "Click Signal Indicator" , "Signal Adapter" , "Signal Composer" ) and the TTS script to the same chart.
Open the script's Settings / Inputs dialog for the TTS.
In the 🛠️ STRATEGY group set 𝐃𝐞𝐚𝐥 𝐂𝐨𝐧𝐝𝐢𝐨𝐧𝐬 𝐌𝐨𝐝𝐞 to 🔨External (this makes TTS listen to an external signal source).
Still inside 🛠️ STRATEGY locate the 🔌𝐒𝐢𝐠𝐧𝐚𝐥 🛈 input and choose the plotted output of your SI. The option should look like: "<SI short title>:🔌Signal to TTS" .
Verbose troubleshooting & tips
If the SI does not appear in the 🔌Signal 🛈 selector, confirm both scripts are added to the same chart and the SI exposes a plotted series (title often "🔌Signal to TTS").
When using multiple SIs, pick the SI instance that actually outputs the "🔌Signal to TTS" plotted series.
Validate on the chart: when your SI changes state, the plotted "🔌Signal" series in the TTS (visible in the data window) should change accordingly.
The TTS accepts only signals that follow the tts_convention DealConditions structure. Do not attempt to feed arbitrary scalar series without using conv.getDealConditions / conv.DealConditions.
Make sure your SI composes a DealConditions value following the TTS convention (startLong, endLong, startShort, endShort — optional cancel fields). See the template below.
If the plot is present but TTS does not react, ensure the SI plot is non-repainting (or accept realtime/backtest limitations). Test on historical bars first.
Create alerts on the strategy (see the Alerts section). Use the {{strategy.order.alert_message}} placeholder in the Create Alert dialog to forward TTS messages.
💢 How to create a custom trading logic ❓
The "Template Trailing Strategy (Backtester)" provides two ways to plug in your custom trading logic. Both of them have their advantages and disadvantages.
✍️ Develop your own Customized "Signal Indicator" 💥
The first approach is meant to be used for relatively more complex trading logic. The advantages of this approach are the full control and customization you have over the trading logic and the relatively simple configuration setup by having two scripts only. The downsides are that you have to have some experience with pinescript or you are willing to learn and experiment. You should also know the exact formula for every indicator you will use since you have to write it by yourself. Copy-pasting from existing open-source indicators will get you started quite fast though.
The idea here is either to create a new indicator script from scratch or to copy an existing non-signal indicator and make it a "Signal Indicator". To create a new script, press the "Pine Editor" button below the chart to open the "Pine Editor" and then press the "Open" button to open the drop-down menu with the templates. Select the "New Indicator" option. Add it to your chart to copy an existing indicator and press the source code {} button. Its source code will be shown in the "Pine Editor" with a warning on top stating that this is a read-only script. Press the "create a working copy". Now you can give a descriptive title and a short title to your script, and you can work on (or copy-paste) the (other) indicators of your interest. Once you have the information needed to decide, define a DealConditions object and plot it like this:
import jason5480/tts_convention/ as conv
// Calculate the start, end, cancel start, cancel end conditions
dealConditions = conv.DealConditions.new(
startLongDeal = ,
startShortDeal = ,
endLongDeal = ,
endShortDeal = ,
cnlStartLongDeal = ,
cnlStartShortDeal = ,
cnlEndLongDeal = ,
cnlEndShortDeal = )
// Use this signal in scripts like "Template Trailing Strategy (Backtester)" and "Signal Composer" that can utilize its value
// Emit the current signal value according to the TTS framework convention
plot(series = conv.getSignal(dealConditions), title = '🔌Signal to TTS', color = #808000, editable = false, display = display.data_window + display.status_line, precision = 0)
You should import the latest version of the tts_convention library and write your deal conditions appropriately based on your trading logic and put them in the code section shown above by replacing the "…" part after "=". You can omit the conditions that are not relevant to your logic. For example, if you use only market orders for entering and exiting your positions the cnlStartLongDeal, cnlStartShortDeal, cnlEndLongDeal, and cnlEndShortDeal are irrelevant to your case and can be safely omitted from the DealConditions object. After successfully compiling your new custom SI script add it to the same chart with the TTS by pressing the "Add to chart" button. If all goes well, you will be able to connect your "signal" to the TTS as described in the "How to connect a "signal" from a "Signal Indicator"?" guide.
🧩 Adapt and Combine existing non-signal indicators 💥
The second approach is meant to be used for relatively simple trading logic. The advantages of this approach are the lack of pine script and coding experience needed and the fact that it can be used with closed-source indicators as long as the decision-making part is displayed as a line in the chart. The drawback is that you have to have a subscription that supports the "indicator on indicator" feature so you can connect the output of one indicator as an input to another indicator. Please check if your plan supports that feature here
To plug in your own logic that way you have to add your indicator(s) of preference in the chart and then add the "Signal Adapter" script in the same chart as well. This script is a "Signal Indicator" that can be used as a proxy to define your custom logic in the CONDITIONS group of the "Settings/Inputs" tab after defining your inputs from your preferred indicators in the VARIABLES group. Then a "signal" will be produced, if your logic is simple enough it can be directly connected to the TTS that is also added to the same chart for execution. Check the "How to connect a "signal" from a "Signal Indicator"?" in the "🤔 How to Guide" for more information.
If your logic is slightly more complicated, you can add a second "Signal Adapter" in your chart. Then you should add the "Signal Composer" in the same chart, go to the SIGNALS group of the "Settings/Inputs" tab, and connect the "signals" from the "Signal Adapters". "Signal Composer" is also a SI so its composed "signal" can be connected to the TTS the same way it is described in the "How to connect a "signal" from a "Signal Indicator"?" guide.
At this point, due to the composability of the framework, you can add an arbitrary number (bounded by your subscription of course) of "Signal Adapters" and "Signal Composers" before connecting the final "signal" to the TTS.
💢 How to set up ⏰Alerts ❓
The "Template Trailing Strategy (Backtester)" provides a fully customizable per-event alert mechanism. This means that you may have an entirely different message for entering and exiting into a position, hitting a stop-loss or a take-profit target, changing trailing targets, etc. There are no restrictions, and this gives you great flexibility.
First enable the events you want under the "🔔 ALERT MESSAGES" module. Each enabled event exposes a text area where you can craft the message using placeholders that TTS replaces with actual values when the event occurs.
The placeholder categories (exact names used by the script) are:
Chart & instrument:
{{ticker}}
{{base_currency}}
{{quote_currency}}
Entry / exit / stop / TP prices & offsets:
{{entry_price}}
{{exit_price}}
{{stop_loss_price}}
{{take_profit_price_1}} ... {{take_profit_price_5}}
{{entry+_price}}, {{entry-_price}}, {{exit+_price}}, {{exit-_price}} — Optional offset helpers (computed using "Offset Ticks")
Quantities, percents & derived quantities:
{{entry_base_quantity}} — base units at entry (e.g. BTC)
{{entry_quote_quantity}} — quote amount at entry (e.g. USD)
{{risk_perc}} — % of capital risked for that entry (multiplied by 100 when "Percentage Range " is enabled)
{{remaining_quantity_perc}} — % of the initial position remaining at close/SL
{{remaining_base_quantity}} — remaining base units at close/SL
{{take_profit_quantity_perc_1}} ... {{take_profit_quantity_perc_5}} — % sold/bought at each TP
{{take_profit_base_quantity_1}} ... {{take_profit_base_quantity_5}} — base units closed at each TP
❗ Important: the per-event alert text is injected into the Create Alert dialog using TradingView's strategy placeholder:
{{strategy.order.alert_message}}
During the creation of a strategy alert, make sure the placeholder {{strategy.order.alert_message}} exists in the "Message" box. TradingView will substitute the per-event text you configured and enabled in TTS Settings/Inputs before sending it via webhook/notification.
Tip: For webhook/broker execution, set the proper "Condition" in the Create Alert dialog (for changing-entry/exit/SL notifications use "Order fills and alert() function calls" or "alert() function calls only" as appropriate).
💢 How to execute my orders in a broker ❓
To execute your orders in a broker that supports webhook integration, you should enable the appropriate alerts in the "Template Trailing Strategy (Backtester)" first (see the "How to set up Alerts?" guide above). Then you should go to the "Create Alert/Notifications" tab check the "Webhook URL" and paste the URL provided by your broker. You have to read the documentation of your broker for more information on what messages are expected.
Keep in mind that some brokers have deep integration with TradingView so a per-event alert approach might be overkill.
📑 Definitions
This section tries to give some definitions in terms that appear in the "Settings/Inputs" tab of the "Template Trailing Strategy (Backtester)"
💢 What is Trailing ❓
Trailing is a technique where a price target follows another "barrier" price (usually high or low) by trying to keep a maximum distance from the "barrier" when it moves in only one direction (up or down). When the "barrier" moves in the other direction the price target will not change. There are as many types of trailing as price targets, which means that there are entry trailing, exit trailing, stop-loss trailing, and take-profit trailing techniques.
💢 What is a Moonbag ❓
A Moonbag in a trade is the quantity of the position that is reserved and will not be exited even if all take-profit targets defined in the strategy are hit, the quantity will be exited only if the stop-loss is hit or a close signal is received. This makes the stop-loss trailing technique in a trend-following strategy a good candidate to take advantage of a Moonbag.
💢 What is Distance ❓
Distance is the difference between two prices.
💢 What is Bias ❓
Bias is a psychological phenomenon where you make decisions based on market sentiment. For example, when you want to enter a long position you have a long bias, and when you want to exit from the long position you have a short bias. It is the other way around for the short position.
💢 What is the Bias Distance of a price target ❓
The Bias Distance of a price target is the distance that the target will deviate from its initial price. The direction of this deviation depends on the bias of the market. For example, suppose you are in a long position, and you set a take-profit target to the local highest high. In that case, adding a bias distance of five ticks will place your take-profit target 5 ticks below this local highest high because you have a short bias when exiting a long position. When the bias is long the bias distance will be added resulting in a higher target price and when you have a short bias the bias distance will be subtracted.
⚙️ Settings
In the "Settings/Inputs" tab of the "Template Trailing Strategy (Backtester)", you can find all the customizable settings that are provided by the framework. The variety of those settings is vast; hence we will only scratch the surface here. However, for every setting, there is an information icon 🛈 where you can learn more if you mouse over it. The "Settings/Inputs" tab is divided into ten main groups. Each one of them is responsible for one module of the framework. Every setting is part of a group that is named after the module it represents. So, to spot the module of a setting find the title that appears above it comes with an emoji and uppercase letters. Some settings might have the same name but belong to different modules e.g. "Tgt Dist Mtd" (Target Distance Method). Some settings are indented, which means that they are closely related to the non-indented setting above. Usually, indented settings provide further configuration for one or more options of the non-indented setting above. The groups that correspond to each module of the framework are the following:
🗺️ Quick Module Cross-Reference (use emojis to jump to setting groups)
📆 FILTERS — session, date & weekday filters
🛠️ STRATEGY — internal vs external deal-conditions; pick the signal source
🔧 STRATEGY – INTERNAL — built-in Two MA logic for demonstration purposes
🎢 VOLATILITY — ATR / StDev update modes
🔷 ENTRY — entry order types & trailing
🎯 TAKE PROFIT — multi-step TP and trailing rules
🛑 STOP LOSS — stop placement, move-to-breakeven, trailing
🟪 EXIT — exit order types & cancel logic
💰 QUANTITY/RISK MANAGEMENT — position sizing, moonbag, limits
📊 ANALYTICS — stats, streaks, seasonal tables
🔔 ALERT MESSAGES — per-event alert templates & placeholders
😲 Caveats
💢 Does "Template Trailing Strategy (Backtester)" have repainting behavior? ❓
The answer is that the "Template Trailing Strategy (Backtester)" does not repaint as long as the "Signal Indicator" that is connected also does not repaint. If you developed your own SI make sure that you understand and know how to prevent this behavior. The publication by @PineCoders here will give you a good idea on how to avoid most of the repainting cases.
⚠️ There is an exception though, when the "Enable Trail⚠️💹" checkbox is checked, the Take Profit trailing feature is enabled, and a tick-based approach is used, meaning that after a while, when the TradingView discards all the real-time data, assumptions will be made by the backtesting engine that will cause a form of repainting. To avoid making false assumptions please disable this feature in the early stages and evaluate its usefulness in your strategy later on, after first confirming the success of the logic without this feature. In this case, consider turning on the bar magnifier feature. This way you will get more accurate backtest results when the Take Profit trailing feature is enabled.
💢 Can "Template Trailing Strategy (Backtester)" satisfy all my trading strategies ❓
While this framework can satisfy quite a large number of trading strategies there are cases where it cannot do so. For example, if you have a custom logic for your stop-loss or take-profit placement, or if you want to dollar cost average, then it might be better to start a new strategy script from scratch.
⚠️ It is not recommended to copy the official TTS code and start developing unless you are a Pine wizard! Even in that case, there is a stiff learning curve that might not be worth your time. Last, you must consider that I do not offer support for customized versions of the TTS script and if something goes wrong in the process you are all alone.
💝 Support & Feedback
For feedback, bug reports, or feature requests, contact me via TradingView PM or use the script comments.
Note: The author's personal links and contact are available on the TradingView profile.
🤗 Thanks
Special thanks to the welcoming community members, who regularly gave feedback all those years and helped me to shape the framework as it is today! Thanks everyone who contributed by either filing a "defect report" or asking questions that helped me to understand what improvements were necessary to help traders.
Enjoy!
Jason

BO - Bar's direction Signal - BacktestingBO - Bar's direction Signal - Backtesting Options:
A. Factors Calculate probability of x bars same direction
1. Periods Counting: Data to count From day/month/year To day/month/year
2. Trading Time: only cases occurred in trading time were counted.
B. Timezone
1. Trading time depend on Time zone and specified chart.
2. Enable Highlight Trading Time to check your period time is correct
C. Date Backtesting
* Only cases occurred in Date Backtesting were reported.
D. Setup Options & Rule
1. Reversal after 2 bars same direction
* Probability of 3 bars same direction < 50
* 2 bars same direction is start of series
2. Reversal after 3 bars same direction
* Probability of 4 bars same direction < 50
* 3 bars same direction is start of series
3. Reversal after 4 bars same direction
* Probability of 4 bars same direction < 50
* 3 bars same direction is start of series
4. Reversal after 5 bars same direction
* Probability of 5 bars same direction < 50
* 4 bars same direction is start of series
5. Reversal after 6 bars same direction
* Probability of 6 bars same direction < 50
* 5 bars same direction is start of series

Aroon and ASH strategy - ETHERIUM [IkkeOmar]Intro:
This post introduces a Pine Script strategy, as an example if anyone needs a push to get started. This example is a strategy on ETH, obviously it isn't a good strategy, and I wouldn't share my own good strategies because of alpha decay. This strategy combines two technical indicators: Aroon and Absolute Strength Histogram (ASH).
Overview:
The strategy employs the Aroon indicator alongside the Absolute Strength Histogram (ASH) to determine market trends and potential trade setups. Aroon helps identify the strength and direction of a trend, while ASH provides insights into the strength of momentum. By combining these indicators, the strategy aims to capture profitable trading opportunities in Ethereum markets. Normally when developing strats using indicators, you want to find some good indicators, but you NEED to understand their strengths and weaknesses, other indicators can be incorporated to minimize the downs of another indicator. Try to look for synergy in your indicators!
Indicator settings:
Aroon Indicator:
- Two sets of parameters are used for the Aroon indicator:
- For Long Positions: Aroon periods are set to 56 (upper) and 20 (lower).
- For Short Positions: Aroon periods are set to 17 (upper) and 55 (lower).
Absolute Strength Histogram (ASH):
ASH is calculated with a length of 9 bars using the closing price as the data source.
Trading Conditions:
The strategy incorporates specific conditions to initiate and exit trades:
Start Date:
Traders can specify the start date for backtesting purposes.
Trade Direction:
Traders can select the desired trade direction: Long, Short, or Both.
Entry and Exit Conditions:
1. Long Position Entry: A long position is initiated when the Aroon indicator crosses over (crossover) the lower Aroon threshold, indicating a potential uptrend.
2. Long Position Exit: A long position is closed when the Aroon indicator crosses under (crossunder) the lower Aroon threshold.
3. Short Position Entry: A short position is initiated when the Aroon indicator crosses under (crossunder) the upper Aroon threshold, signaling a potential downtrend.
4. Short Position Exit: A short position is closed when the Aroon indicator crosses over (crossover) the upper Aroon threshold.
Disclaimer:
THIS ISN'T AN OPTIMAL STRATEGY AT ALL! It was just an old project from when I started learning pine script!
The backtest doesn't promise the same results in the future, always do both in-sample and out-of-sample testing when backtesting a strategy. And make sure you forward test it as well before implementing it!

Hulk Grid Algorithm V2 - The Quant ScienceIt's the latest proprietary grid algorithm developed by our team. This software represents a clearer and more comprehensive modernization of the deprecated Hulk Grid Algorithm. In this new release, we have optimized the source code architecture and investment logic, which we will describe in detail below.
Overview
Hulk Grid Algorithm V2 is designed to optimize returns in sideways market conditions. In this scenario, the algorithm divides purchases with long orders at each level of the grid. Unlike a typical grid algorithm, this version applies an anti-martingale model to mitigate volatility and optimize the average entry price. Starting from the lower level, the purchase quantity is increased at each new subsequent level until reaching the upper level. The initial quantity of the first order is fixed at 0.50% of the initial capital. With each new order, the initial quantity is multiplied by a value equal to the current grid level (where 1 is the lower level and 10 is the upper level).
Example: Let's say we have an initial capital of $10,000. The initial capital for the first order would be $50 * 1 = $50, for the second order $50 * 2 = $100, for the third order $50 * 3 = $150, and so on until reaching the upper level.
All previously opened orders are closed using a percentage-based stop-loss and take-profit, calculated based on the extremes of the grid.
Set Up
As mentioned earlier, the user's goal is to analyze this strategy in markets with a lack of trend, also known as sideways markets. After identifying a price range within which the asset tends to move, the user can choose to create the grid by placing the starting price at the center of the range. This way, they can consider trading the asset, if the backtesting generates a return greater than the Buy & Hold return.
Grid Configuration
To create the grid, it's sufficient to choose the starting price during the launch phase. This level will be the center of the grid from which the upper and lower levels will be calculated. The grid levels are computed using an arithmetic method, adding and subtracting a configurable fixed amount from the user interface (Grid Step $).
Example: Let's imagine choosing 1000 as the starting price and 50 as the Grid Step ($). The upper levels will be 1000, 1050, 1100, 1150, 1200. The lower levels will be 950, 900, 850, 800, and 750.
Markets
This software can be used in all markets: stocks, indices, commodities, cryptocurrencies, ETFs, Forex, etc.
Application
With this backtesting software, is possible to analyze the strategy and search for markets where it can generate better performance than Buy & Hold returns. There are no alerts or automatic investment mechanisms, and currently, the strategy can only be executed manually.
Design
Is possible to modify the grid style and customize colors by accessing the Properties section of the user interface.

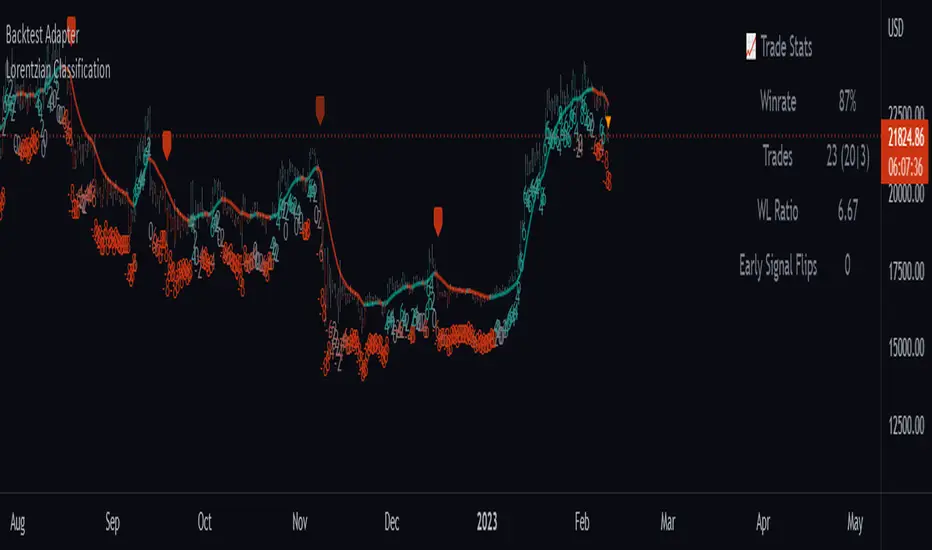
Backtest AdapterThis is a proof-of-concept Backtest Adapter that can be used with my recent publication "Machine Learning: Lorentzian Classification" located here:
This adapter is helpful because it enables interactive backtesting with TradingView's built-in "Strategy Tester" framework without the need to translate the logic from an "indicator" script to a "strategy" script.
To use this, one must have the "Machine Learning: Lorentzian Classification" script and this Backtest Adapter open simultaneously on the same chart. From there, simply change the "Source" setting of the Backtest Adapter to "Lorentzian Classification: Backtest Stream" to transfer the entry/exit signals stream to the Backtest Adapter.
For an example of how to implement your own backtest stream in your indicators, please refer to the "Backtesting" section in the source code of the "Machine Learning: Lorentzian Classification" script, which is shown below for convenience:
[MT] Strategy Backtest Template| Initial Release | | EN |
An update of my old script, this script is designed so that it can be used as a template for all those traders who want to save time when programming their strategy and backtesting it, having functions already programmed that in normal development would take you more time to program, with this template you can simply add your favorite indicator and thus be able to take advantage of all the functions that this template has.
🔴Stop Loss and 🟢Take Profit:
No need to mention that it is a Stop Loss and a Take Profit, within these functions we find the options of: fixed percentage (%), fixed price ($), ATR, especially for Stop Loss we find the Pivot Points, in addition to this, the price range between the entry and the Stop Loss can be converted into a trailing stop loss, instead, especially for the Take Profit we have an option to choose a 1:X ratio that complements very well with the Pivot Points.
📈Heikin Ashi Based Entries:
Heikin Ashi entries are trades that are calculated based on Heikin Ashi candles but their price is executed to Japanese candles, thus avoiding false results that occur in Heikin candlestick charts, this making in certain cases better results in strategies that are executed with this option compared to Japanese candlesticks.
📊Dashboard:
A more visual and organized way to see the results and necessary data produced by our strategy, among them we can see the dates between which our operations are made regardless if you have activated some time filter, usual data such as Profit, Win Rate, Profit factor are also displayed in this panel, additionally data such as the total number of operations, how many were gains and how many losses, the average profit and loss for each operation and finally the maximum profits and losses followed, which are data that will be very useful to us when we elaborate our strategies.
Feel free to use this template to program your own strategies, if you find errors or want to request a new feature let me know in the comments or through my social networks found in my tradingview profile.
| Update 1.1 | | EN |
➕Additions: '
Time sessions filter and days of the week filter added to the time filter section.
Option to add leverage to the strategy.
5 Moving Averages, RSI, Stochastic RSI, ADX, and Parabolic Sar have been added as indicators for the strategy.
You can choose from the 6 available indicators the way to trade, entry alert or entry filter.
Added the option of ATR for Take Profit.
Ticker information and timeframe are now displayed on the dashboard.
Added display customization and color customization of indicator plots.
Added customization of display and color plots of trades displayed on chart.
📝Changes:
Now when activating the time filter it is optional to add a start or end date and time, being able to only add a start date or only an end date.
Operation plots have been changed from plot() to line creation with line.new().
Indicator plots can now be controlled from the "plots" section.
Acceptable and deniable range of profit, winrate and profit factor can now be chosen from the "plots" section to be displayed on the dashboard.
Aesthetic changes in the section separations within the settings section and within the code itself.
The function that made the indicators give inputs based on heikin ashi candles has been changed, see the code for more information.
⚙️Fixes:
Dashboard label now projects correctly on all timeframes including custom timeframes.
Removed unnecessary lines and variables to take up less code space.
All code in general has been optimized to avoid the use of variables, unnecessary lines and avoid unnecessary calculations, freeing up space to declare more variables and be able to use fewer lines of code.
| Lanzamiento Inicial | | ES |
Una actualización de mi antiguo script, este script está diseñado para que pueda ser usado como una plantilla para todos aquellos traders que quieran ahorrar tiempo al programar su estrategia y hacer un backtesting de ella, teniendo funciones ya programadas que en el desarrollo normal te tomaría más tiempo programar, con esta plantilla puedes simplemente agregar tu indicador favorito y así poder aprovechar todas las funciones que tiene esta plantilla.
🔴Stop Loss y 🟢Take Profit:
No hace falta mencionar que es un Stop Loss y un Take Profit, dentro de estas funciones encontramos las opciones de: porcentaje fijo (%), precio fijo ($), ATR, en especial para Stop Loss encontramos los Pivot Points, adicionalmente a esto, el rango de precio entre la entrada y el Stop Loss se puede convertir en un trailing stop loss, en cambio, especialmente para el Take Profit tenemos una opción para elegir un ratio 1:X que se complementa muy bien con los Pivot Points.
📈Entradas Basadas en Heikin Ashi:
Las entradas Heikin Ashi son operaciones que son calculados en base a las velas Heikin Ashi pero su precio esta ejecutado a velas japonesas, evitando así́ los falsos resultados que se producen en graficas de velas Heikin, esto haciendo que en ciertos casos se obtengan mejores resultados en las estrategias que son ejecutadas con esta opción en comparación con las velas japonesas.
📊Panel de Control:
Una manera más visual y organizada de ver los resultados y datos necesarios producidos por nuestra estrategia, entre ellos podemos ver las fechas entre las que se hacen nuestras operaciones independientemente si se tiene activado algún filtro de tiempo, datos usuales como el Profit, Win Rate, Profit factor también son mostrados en este panel, adicionalmente se agregaron datos como el número total de operaciones, cuantos fueron ganancias y cuantos perdidas, el promedio de ganancias y pérdidas por cada operación y por ultimo las máximas ganancias y pérdidas seguidas, que son datos que nos serán muy útiles al elaborar nuestras estrategias.
Siéntete libre de usar esta plantilla para programar tus propias estrategias, si encuentras errores o quieres solicitar una nueva función házmelo saber en los comentarios o a través de mis redes sociales que se encuentran en mi perfil de tradingview.
| Actualización 1.1 | | ES |
➕Añadidos:
Filtro de sesiones de tiempo y filtro de días de la semana agregados al apartado de filtro de tiempo.
Opción para agregar apalancamiento a la estrategia.
5 Moving Averages, RSI, Stochastic RSI, ADX, y Parabolic Sar se han agregado como indicadores para la estrategia.
Puedes escoger entre los 6 indicadores disponibles la forma de operar, alerta de entrada o filtro de entrada.
Añadido la opción de ATR para Take Profit.
La información del ticker y la temporalidad ahora se muestran en el dashboard.
Añadido personalización de visualización y color de los plots de indicadores.
Añadido personalización de visualización y color de los plots de operaciones mostradas en grafica.
📝Cambios:
Ahora al activar el filtro de tiempo es opcional añadir una fecha y hora de inicio o fin, pudiendo únicamente agregar una fecha de inicio o solamente una fecha de fin.
Los plots de operaciones han cambiados de plot() a creación de líneas con line.new().
Los plots de indicadores ahora se pueden controlar desde el apartado "plots".
Ahora se puede elegir el rango aceptable y negable de profit, winrate y profit factor desde el apartado "plots" para mostrarse en el dashboard.
Cambios estéticos en las separaciones de secciones dentro del apartado de configuraciones y dentro del propio código.
Se ha cambiado la función que hacía que los indicadores dieran entradas en base a velas heikin ashi, mire el código para más información.
⚙️Arreglos:
El dashboard label ahora se proyecta correctamente en todas las temporalidades incluyendo las temporalidades personalizadas.
Se han eliminado líneas y variables innecesarias para ocupar menos espacio en el código.
Se ha optimizado todo el código en general para evitar el uso de variables, líneas innecesarias y evitar los cálculos innecesarios, liberando espacio para declarar más variables y poder utilizar menos líneas de código.

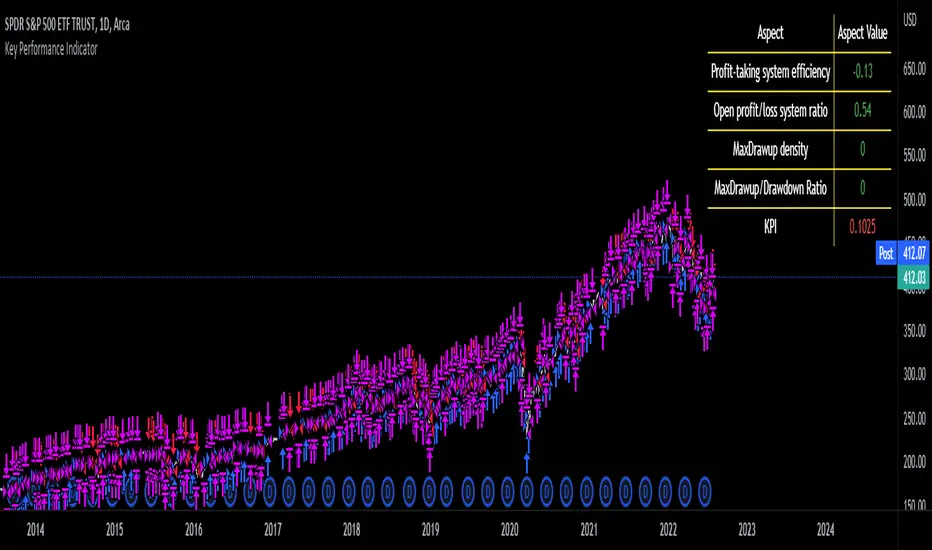
Key Performance IndicatorWe are happy to introduce the Key Performance Indicator by Detlev Matthes. This is an amazing tool to quantify the efficiency of a trading system and identify potential spots of improvement.
Abstract
A key performance indicator with high explanatory value for the quality of trading systems is introduced. Quality is expressed as an indicator and comprises the individual values of qualitative aspects. The work developing the KPI was submitted for the 2017 VTAD Award and won first prize.
Introduction
Imagine that you have a variety of stock trading systems from which to select. During backtesting, each trading system will deliver different results with regard to its indicators (depending on, inter alia, its parameters and the stock used). You will also get different forms of progression for profit development. It requires great experience to select the “best” trading system from this variety of information (provided by several indicators) and significantly varying equity progression forms. In this paper, an indicator will be introduced that expresses the quality of a trading system in just one figure. With such an indicator, you can view the results of one backtest at a glance and also more easily compare a variety of backtesting results with one another.
If you are interested in learning more about the calculations behind this indicator then I have included a link to the english version of his research paper.
Along with this, we now offer indicator development services. If you are interested in learning more then feel free to reach out to get a quote for your project.
**Please note that we have NOT inputted any real strategy into the code and therefore it is not producing any real value. Feel free to change the code as desired to test any strategy!**
drive.google.com
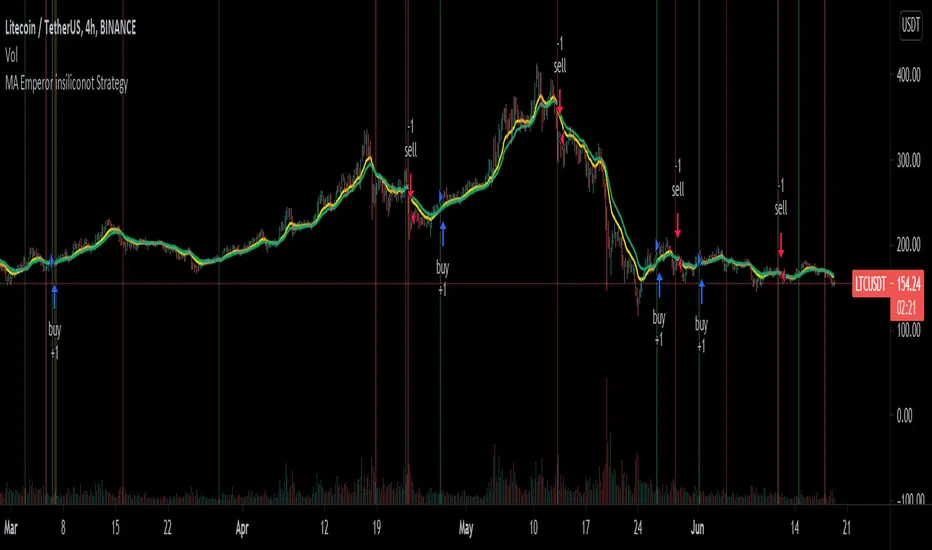
MA Emperor insiliconot StrategyConverted EmperorBTC's EMA crossover indicator for easy backtesting and added ability to:
Specify time period for backtesting
Specify order quantity
Toggle original indicators (default off)
Quoting EmperorBTC:
Entry is to be made when the
1. Cross over gives a P(Positive Sign) and the candle completely closes above the cross-over
2. When the Heikin Ashi turns green and the next green HA candle goes above the previous green HA candle.
3. The price should be at-least above the 0.236 Level from the Swing high.
Kindly note that the strategy only attempts to do check number 1, where it ensures the entry opens above the cross-over.
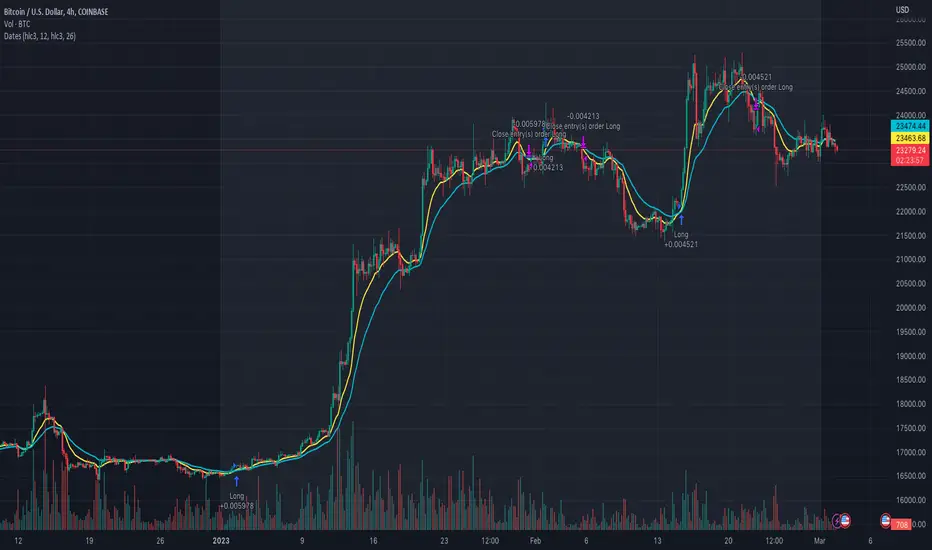
How To Set Backtest Date RangeExample how to select and set date range window to be backtested. Normally when you change chart period it changes the number of days being backtested which means as you increas the chart period (for example from 5min to 15min) you also increase the number of days traded, so you can not compare apples to apples for which period would yield best returns for your strategy. Now you can. Incorporate this code replacing buy and sell with your strategy, then simply input the From and To dates in Format -> Inputs, and then change the chart period to view updated results.
NOTE: There is a limit in backtesting to 2000 orders, so please be aware of this when setting your date ranges. If you set your range too high, you may be exceeding this limit on some periods and not on others, so this would yield incorrect comparison of returns per period. If you see in your backtesting results that you are nearing this limit for one of your periods you are testing, then reduce the date range to a smaller number of days.
Enjoy!
(Thanks to @Gesundheit "Adeel" for pointing me in the right direction on this!)
Mutanabby_AI | ONEUSDT_MR1
ONEUSDT Mean-Reversion Strategy | 74.68% Win Rate | 417% Net Profit
This is a long-only mean-reversion strategy designed specifically for ONEUSDT on the 1-hour timeframe. The core logic identifies oversold conditions following sharp declines and enters positions when selling pressure exhausts, capturing the subsequent recovery bounce.
Backtested Period: June 2019 – December 2025 (~6 years)
Performance Summary
| Metric | Value |
|--------|-------|
| Net Profit | +417.68% |
| Win Rate | 74.68% |
| Profit Factor | 4.019 |
| Total Trades | 237 |
| Sharpe Ratio | 0.364 |
| Sortino Ratio | 1.917 |
| Max Drawdown | 51.08% |
| Avg Win | +3.14% |
| Avg Loss | -2.30% |
| Buy & Hold Return | -80.44% |
Strategy Logic :
Entry Conditions (Long Only):
The strategy seeks confluence of three conditions that identify exhausted selling:
1. Prior Move Filter:*The price change from 5 bars ago to 3 bars ago must be ≥ -7% (ensures we're not entering during freefall)
2. Current Move Filter: The price change over the last 2 bars must be ≤ 0% (confirms momentum is stalling or reversing)
3. Three-Bar Decline: The price change from 5 bars ago to 3 bars ago must be ≤ -5% (confirms a significant recent drop occurred)
When all three conditions align, the strategy identifies a potential reversal point where sellers are exhausted.
Exit Conditions:
- Primary Exit: Close above the previous bar's high while the open of the previous bar is at or below the close from 9 bars ago (profit-taking on strength)
- Trailing Stop: 11x ATR trailing stop that locks in profits as price rises
Risk Management
- Position Sizing:Fixed position based on account equity divided by entry price
- Trailing Stop:11× ATR (14-period) provides wide enough room for crypto volatility while protecting gains
- Pyramiding:Up to 4 orders allowed (can scale into winning positions)
- **Commission:** 0.1% per trade (realistic exchange fees included)
Important Disclaimers
⚠️ This is NOT financial advice.
- Past performance does not guarantee future results
- Backtest results may contain look-ahead bias or curve-fitting
- Real trading involves slippage, liquidity issues, and execution delays
- This strategy is optimized for ONEUSDT specifically — results may differ on other pairs
- Always test before risking real capital
Recommended Usage
- Timeframe:*1H (as designed)
- Pair: ONEUSDT (Binance)
- Account Size: Ensure sufficient capital to survive max drawdown
Source Code
Feedback Welcome
I'm sharing this strategy freely for educational purposes. Please:
- Drop a comment with your backtesting results any you analysis
- Share any modifications that improve performance
- Let me know if you spot any issues in the logic
Happy trading
As a quant trader, do you think this strategy will survive in live trading?
Yes or No? And why?
I want to hear from you guys

Strategy Chameleon [theUltimator5]Have you ever looked at an indicator and wondered to yourself "Is this indicator actually profitable?" Well now you can test it out for yourself with the Strategy Chameleon!
Strategy Chameleon is a versatile, signal-agnostic trading strategy designed to adapt to any external indicator or trading system. Like a chameleon changes colors to match its environment, this strategy adapts to match any buy/sell signals you provide, making it the ultimate backtesting and automation tool for traders who want to test multiple strategies without rewriting code.
🎯 Key Features
1) Connects ANY external indicator's buy/sell signals
Works with RSI, MACD, moving averages, custom indicators, or any Pine Script output
Simply connect your indicator's signal output to the strategy inputs
2) Multiple Stop Loss Types:
Percentage-based stops
ATR (Average True Range) dynamic stops
Fixed point stops
3) Advanced Trailing Stop System:
Percentage trailing
ATR-based trailing
Fixed point trailing
4) Flexible Take Profit Options:
Risk:Reward ratio targeting
Percentage-based profits
ATR-based profits
Fixed point profits
5) Trading Direction Control
Long Only - Bull market strategies
Short Only - Bear market strategies
Both - Full market strategies
6) Time-Based Filtering
Optional trading session restrictions
Customize active trading hours
Perfect for day trading strategies
📈 How It Works
Signal Detection: The strategy monitors your connected buy/sell signals
Entry Logic: Executes trades when signals trigger during valid time periods
Risk Management: Automatically applies your chosen stop loss and take profit levels
Trailing System: Dynamically adjusts stops to lock in profits
Performance Tracking: Real-time statistics table showing win rate and performance
⚙️ Setup Instructions
0) Add indicator you want to test, then add the Strategy to your chart
Connect Your Signals:
imgur.com
Go to strategy settings → Signal Sources
1) Set "Buy Signal Source" to your indicator's buy output
2) Set "Sell Signal Source" to your indicator's sell output
3) Choose table position - This simply changes the table location on the screen
4) Set trading direction preference - Buy only? Sell only? Both directions?
imgur.com
5) Set your preferred stop loss type and level
You can set the stop loss to be either percentage based or ATR and fully configurable.
6) Enable trailing stops if desired
imgur.com
7) Configure take profit settings
8) Toggle time filter to only consider specific time windows or trading sessions.
🚀 Use Cases
Test various indicators to determine feasibility and/or profitability.
Compare different signal sources quickly
Validate trading ideas with consistent risk management
Portfolio Management
Apply uniform risk management across different strategies
Standardize stop loss and take profit rules
Monitor performance consistently
Automation Ready
Built-in alert conditions for automated trading
Compatible with trading bots and webhooks
Easy integration with external systems
⚠️ Important Notes
This strategy requires external signals to function
Default settings use 10% of equity per trade
Pyramiding is disabled (one position at a time)
Strategy calculates on bar close, not every tick
🔗 Integration Examples
Works perfectly with:
RSI strategies (connect RSI > 70 for sells, RSI < 30 for buys)
Moving average crossovers
MACD signal line crosses
Bollinger Band strategies
Custom oscillators and indicators
Multi-timeframe strategies
📋 Default Settings
Position Size: 10% of equity
Stop Loss: 2% percentage-based
Trailing Stop: 1.5% percentage-based (enabled)
Take Profit: Disabled (optional)
Trade Direction: Both long and short
Time Filter: Disabled

Alligator + MA Trend Catcher [TradeDots]The "Alligator + MA Trend Catcher" is a trading strategy that integrates the William Alligator indicator with a Moving Average (MA) to establish robust entry and exit conditions, optimized for capturing trends.
HOW IT WORKS
This strategy combines the traditional William Alligator set up with an additional Moving Average indicator for enhanced trend confirmation, creating a user-friendly backtesting tool for traders who prefer the Alligator method.
The original Alligator strategy can frequently present fluctuations, even in well-established trends, leading to potentially premature exits. To mitigate this, we incorporate a Moving Average as a secondary confirmation measure to ensure the market trend has indeed shifted.
Here’s the operational flow for long orders:
Entry Signal: When the price rises above the Moving Average, it confirms a bullish market state. Enter if Alligator spread in an upward direction. The trade remains active even if the Alligator indicator suggests a trend reversal.
Exit Signal: The position is closed when the price falls below the Moving Average, and the Alligator spreads in the downward direction. This setup helps traders to maintain positions through the entirety of the trend for maximum gain.
APPLICATION
This strategy is tailored for assets with significant, well-defined trends, such as Bitcoin and Ethereum, which are known for their high volatility and substantial price movements.
This strategy offers a low win-rate but high reward configuration, making asset selection critical for long-term profitability. If you choose assets that lack strong price momentum, there's a high chance that this strategy may not be effective.
For traders seeking to maximize gains from large trends without exiting prematurely, this strategy provides an aggressive yet controlled approach to riding out substantial market waves.
DEFAULT SETUP
Commission: 0.01%
Initial Capital: $10,000
Equity per Trade: 80%
RISK DISCLAIMER
Trading entails substantial risk, and most day traders incur losses. All content, tools, scripts, articles, and education provided by TradeDots serve purely informational and educational purposes. Past performances are not definitive predictors of future results.

Captain Backtest Model [TFO]Created by @imjesstwoone and @mickey1984, this trade model attempts to capture the expansion from the 10:00-14:00 EST 4h candle using just 3 simple steps. All of the information presented in this description has been outlined by its creators, all I did was translate it to Pine Script. All core settings of the trade model may be edited so that users can test several variations, however this description will cover its default, intended behavior using NQ 5m as an example.
Step 1 is to identify our Price Range. In this case, we are concerned with the highest high and the lowest low created from 6:00-10:00 EST.
Step 2 is to wait for either the high or low of said range to be taken out. Whichever side gets taken first determines the long/short bias for the remainder of the Trade Window (i.e. if price takes the range high, bias is long, and vice versa). Bias must be determined by 11:15 EST, otherwise no trades will be taken. This filter is intended to weed out "choppy" trading days.
Step 3 is to wait for a retracement and enter with a close through the previous candle's high (if long biased) or low (if short biased). There are a couple toggleable criteria that we use to define a retracement; one is checking for opposite close candles that indicate a pullback; another is checking if price took the previous candle's low (if long biased) or high (if short biased).
This trade model was initially tested for index futures, particularly ES and NQ, using a 5m chart, however this indicator allows us to backtest any symbol on any timeframe. Creators @imjesstwoone and @mickey1984 specified a 5 point stop loss on ES and a 25 point stop loss on NQ with their testing.
I've personally found some success in backtesting NQ 5m using a 25 point stop loss and 75 point profit target (3:1 R). Enabling the Use Fixed R:R parameter will ensure that these stops and targets are utilized, otherwise it will enter and hold the position until the close of the Trade Window.

HK Percentile Interpolation One
This script is designed to execute a trading strategy based on Heikin Ashi candlesticks, moving averages, and percentile levels.
Please note that you should keep your original chart in normal candlestick mode and not switch it to Heikin Ashi mode. The script itself calculates Heikin Ashi values from regular candlesticks. If your chart is already in Heikin Ashi mode, the script would be calculating Heikin Ashi values based on Heikin Ashi values, which would produce incorrect results.
The strategy begins trading from a start date that you can specify by modifying the `startDate` parameter. The format of the date is "YYYY MM DD". So, for example, to start the strategy from January 1, 2022, you would set `startDate = timestamp("2022 01 01")`.
The script uses Heikin Ashi candlesticks, which are plotted in the chart. This approach can be useful for spotting trends and reversals more easily than with regular candlestick charts. This is particularly useful when backtesting in TradingView's "Rewind" mode, as you can see how the Heikin Ashi candles behaved at each step of the strategy.
Buy and sell signals are generated based on two factors:
1. The crossing over or under of the Heikin Ashi close price and the 75th percentile price level.
2. The Heikin Ashi close price being above certain moving averages.
You have the flexibility to adjust several parameters in the script, including:
1. The stop loss and trailing stop percentages (`stopLossPercentage` and `trailStopPercentage`). These parameters allow the strategy to exit trades if the price moves against you by a certain percentage.
2. The lookback period (`lookback`) used to calculate percentile levels. This determines the range of past bars used in the percentile calculation.
3. The lengths of the two moving averages (`yellowLine_length` and `purplLine_length`). These determine how sensitive the moving averages are to recent price changes.
4. The minimum holding period (`holdPeriod`). This sets the minimum number of bars that a trade must be kept open before it can be closed.
Please adjust these parameters according to your trading preferences and risk tolerance. Happy trading!

Rocket Grid Algorithm - The Quant ScienceThe Rocket Grid Algorithm is a trading strategy that enables traders to engage in both long and short selling strategies. The script allows traders to backtest their strategies with a date range of their choice, in addition to selecting the desired strategy - either SMA Based Crossunder or SMA Based Crossover.
The script is a combination of trend following and short-term mean reversing strategies. Trend following involves identifying the current market trend and riding it for as long as possible until it changes direction. This type of strategy can be used over a medium- to long-term time horizon, typically several months to a few years.
Short-term mean reversing, on the other hand, involves taking advantage of short-term price movements that deviate from the average price. This type of strategy is usually applied over a much shorter time horizon, such as a few days to a few weeks. By rapidly entering and exiting positions, the strategy seeks to capture small, quick gains in volatile market conditions.
Overall, the script blends the best of both worlds by combining the long-term stability of trend following with the quick gains of short-term mean reversing, allowing traders to potentially benefit from both short-term and long-term market trends.
Traders can configure the start and end dates, months, and years, and choose the length of the data they want to work with. Additionally, they can set the percentage grid and the upper and lower destroyers to manage their trades effectively. The script also calculates the Simple Moving Average of the chosen data length and plots it on the chart.
The trigger for entering a trade is defined as a crossunder or crossover of the close price with the Simple Moving Average. Once the trigger is activated, the script calculates the total percentage of the side and creates a grid range. The grid range is then divided into ten equal parts, with each part representing a unique grid level. The script keeps track of each grid level, and once the close price reaches the grid level, it opens a trade in the specified direction.
The equity management strategy in the script involves a dynamic allocation of equity to each trade. The first order placed uses 10% of the available equity, while each subsequent order uses 1% less of the available equity. This results in the allocation of 9% for the second order, 8% for the third order, and so on, until a maximum of 10 open trades. This approach allows for risk management and can help to limit potential losses.
Overall, the Rocket Grid Algorithm is a flexible and powerful trading strategy that can be customized to meet the specific needs of individual traders. Its user-friendly interface and robust backtesting capabilities make it an excellent tool for traders looking to enhance their trading experience.

iMoku (Ichimoku Complete Tool) - The Quant Science iMoku™ is a professional all-in-one solution for the famous Ichimoku Kinko Hyo indicator.
The algorithm includes:
1. Backtesting spot
2. Visual tool
3. Auto-trading functions
With iMoku you can test four different strategies.
Strategy 1: Cross Tenkan Sen - Kijun Sen
A long position is opened with 100% of the invested capital ($1000) when "Tenkan Sen" crossover "Kijun Sen".
Closing the long position on the opposite condition.
There are 3 different strength signals for this strategy: weak, normal, strong.
Weak : the signal is weak when the condition is true and the price is above the 'Kumo'
Normal : the signal is normal when the condition is true and the price is within the 'Kumo'
Strong : the signal is strong when the condition is true and the price is below the 'Kumo'
Strategy 2: Cross Price - Kijun Sen
A long position is opened with 100% of the invested capital ($1000) when the price crossover the 'Kijun Sen'.
Closing the long position on the opposite condition.
There are 3 different strength signals for this strategy: weak, normal, strong.
Weak : the signal is weak when the condition is true and the price is above the 'Kumo'
Normal : the signal is normal when the condition is true and the price is inside the 'Kumo'
Strong : the signal is strong when the condition is true and the price is below the 'Kumo'
Strategy 3: Kumo Breakout
A long position is opened with 100% of the invested capital ($1000) when the price breakup the 'Kumo'.
Closing the long position with a percentage stop loss and take profit on the invested capital.
Strategy 4: Kumo Twist
A long position is opened with 100% of the invested capital ($1000) when the 'Kumo' goes from negative to positive (called "Twist").
Closing the long position on the opposite condition.
There are 2 different strength signals for this strategy: weak, and strong.
Weak : the signal is weak when the condition is true and the price is above the 'Kumo'
Strong : the signal is strong when the condition is true and the price is below the 'Kumo'
This script is compliant with algorithmic trading.
You can use this script with trading terminals such as 3Commas or CryptoHopper. Connecting this script is very easy.
1. Enter the user interface
2. Select and activate a strategy
3. Copy your bot's links into the dedicated fields
4. Create and activate alert
Disclaimer: algorithmic trading involves risk, the user should consider aspects such as slippage, liquidity and costs when evaluating an asset. The Quant Science is not responsible for any kind of damage resulting from use of this script. By using this script you take all the responsibilities and risks.

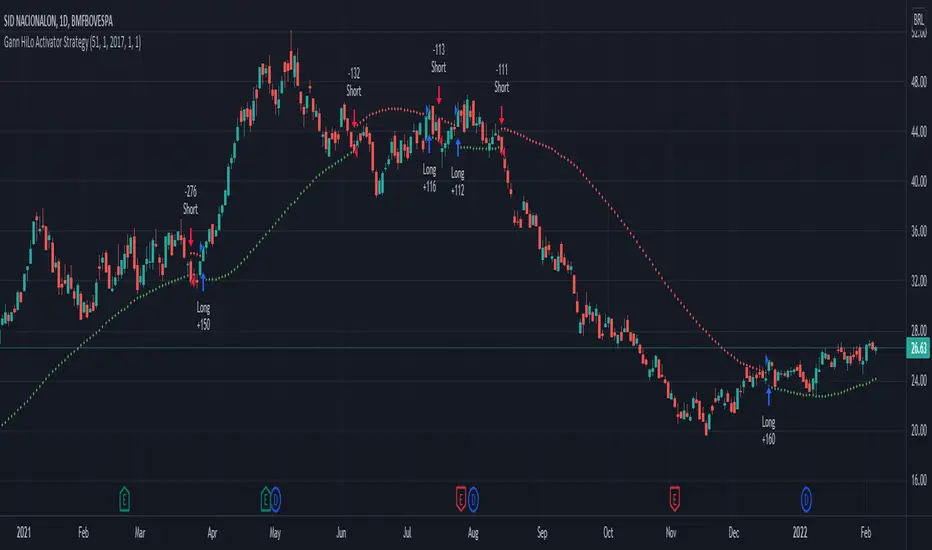
Gann HiLo Activator Strategy█ OVERVIEW
Strategy based on the Gann Hilo Activator . This is a trend following strategy, which means it will go long (and close the previous short position) once the price closes above the high SMA, and go short (and close the previous long position) once the price closes below the low SMA.
█ PARAMETERS
- Length
- Displace (or offset): default is 1
- Begin from start: strategy will run since the beggining
- From year, month, day: Choose an specific date to start backtesting (must disable the parameter above to work)
█ HOW TO USE
After choosing the start date to run the strategy, you can change the length field and look at the backtest results to find the most optimal settings for the current symbol.
This strategy was tested on the stock and crypto market with good results. Hope you enjoy!
WhaleCrew BacktesterBacktesting indicators is easy , just add the following line of code to your script:
plot(longEntry ? 1 : shortEntry ? -1 : longTP ? 0.5 : shortTP ? -0.5 : 0, color=na, editable=false, title='Backtest')
These numbers are defined as constants in the backtester source-code.
After adding this indicator to your chart:
1. Open Settings
2. Select supported indicator to backtest
3. Select if you want to enter Longs and/or Shorts
4. Open the 'Strategy Tester' at the bottom to check the performance
Remember:
past performance is not indicative of future results
repainting indicators will create wrong/unrealistic results

EMR Strategy [H1 Backtesting]EMR Strategy base on EMA, MACD and RSI to supply signal on time frame H1.
Details of Rule as below:
===
1.EMA
+ Time frame: H1
+ Periods: 25, 100 (~ EMA 25 H4), 600 (~ EMA 25 D1)
===
2.MACD
+ Time frame: H1
+ Periods: 12,26,9
===
3.RSI
+ Time frame: H1
+ Periods: 14
===
4.Trading Rule
4.1.Long Position
+ MACD>0 and RSI>50 and close price moving above EMA 25
+ Close price crossed EMA 100 or crossed EMA 600 at the first time
4.2.Short Position
+ MACD<0 and RSI<50 and close price moving below EMA 25
+ Close price crossed EMA 100 or crossed EMA 600 at the first time
===
5.Money Management
+ This strategy concentrate into winrate.
+ So use trailing stop to protect your profits.
+ And use stoploss to avoid big loss on trades.

72s Strat: Backtesting Adaptive HMA+ pt.1This is a follow up to my previous publication of Adaptive HMA+ few months ago, as a mean to provide some kind of initial backtesting tools. Which can be use to explore many possible strategies, optimise its settings to better conform user's pair/tf, and hopefully able to help tweaking your general strategy.
If you haven't read the study or use the indicator, kindly go here first to get the overall idea.
The first strategy introduce in this backtest is one most basic already described in the study; buy/sell is when movement is there and everything is on the right side; When RSI has turned to other side, we can use it as exit point (if in profit of course, else just let it hit our TP/SL, why would we exit before profit). Also, base on RSI when we make entry, we can further differentiate type of signals. --Please check all comments in code directly where the signals , entries , and exits section are.
Second additional strategy to check; is when we also use second faster Adaptive HMA+ for exit. So this is like a double orders on a signal but with different exit-rule (/more on this on snapshots below). Alternatively, you can also work the code so to only use this type of exit.
There's also an additional feature which you can enable its visuals, the Distance Zone , is to help measuring price distance to our xHMA+. It's just a simple atr based envelope really, I already put the sample code in study's comment section, but better gonna update it there directly for non-coder too, after this.
In this sample I use Lot for order quantity size just because that's what I use on my broker. Also what few friends use while we forward-testing it since the study is published, so we also checked/compared each profit/loss report by real number. To use default or other unit of measurement, change the entry code accordingly.
If you change your order size, you should also change the commission in Properties Tab. My broker commission is 5 USD per order/lot, so in there with example order size 0.1 lot I put commission 0.5$ per order (I'll put 2.5$ for 0.5 lot, 10$ for 2 lot, and so on). Crypto usually has higher charge. --It is important that you should fill it base on your broker.
SETTINGS
I'm trying to keep it short. Please explore it further again. (Beginner should also first get acquaintance with terms use here.)
ORDERS:
Base Minimum Profit Before Exit:
The number is multiplier of ongoing ATR. Means that when basic exit condition is met, algo will check whether you're already in minimum profit or not, if not, let it still run to TP or SL, or until it meets subsequent exit condition, then it will check again.
Default Target Profit:
Multiplier of ATR at signal. If reached before any eligible exit condition is met, exit TP.
Base StopLoss Point:
You can change directly in code to use other like ATR Trailing SL, fix percent SL, or whatever. In the sample, 4 options provided.
Maximum StopLoss:
This is like a safety-net, that if at some point your chosen SL point from input above happens to be exceeding this maximum input that you can tolerate, then this max point is the one will be use as SL.
Activate 2nd order...:
The additional doubling of certain buy/sell with different exits as described above. If enable, you should also set pyramiding to at least: 2. If not, it does nothing.
ADAPTIVE HMA+ PERIOD
Many users already have their own settings for these. So in here I only sample the default as first presented in the study. Make it to your adaptive.
MARKET MOVEMENT
(1) Now you can check in realtime how much slope degree is best to define your specific pair/tf is out of congestion (yellow) area. And (2) also able to check directly what ATR lengths are more suitable defining your pair's volatility.
DISTANCE ZONE
Distance Multiplier. Each pair/tf has its own best distance zone (in xHMA+ perspective). The zone also determine whether a signal should appear or not. (Or what type of signal, if you wanna go more detail in constructing your strategy)
USAGE
(Provided you already have your own comfortable settings for minimum-maximum period of Adaptive HMA+. Best if you already have backtested it manually too and/or apply as an add-on to your working strategy)
1. In our experiences, first most important to define is both elements in the Market Movement Settings . These also tend to be persistent for whole season since it's kinda describing that pair/tf overall behaviour. Don't worry if you still get a low Profit Factor here, but by tweaking you should start to see positive changes in one of Max Drawdown and Net Profit, or Percent Profitable.
2. Afterwards, find your pair/tf Distance Zone . When optimising this, what we seek is just a "not to bad" equity curves to start forming. At least Max Drawdown should lessen more. Doesn't have to be great already, but should be better, no red in Net Profit.
3. Then go manage the "Trailing Minimum Profit", TP, SL, and max SL.
4. Repeat 1,2,3. 👻
5. Manage order size, commission, and/or enable double-order (need pyramiding) if you like. Check if your equity can handle max drawdown before margin call.
6. After getting an acceptable backtest result, go to List of Trades tab and find the biggest loss or when many sequencing loss in a row happened. Click on it to go to exact point on chart, observe why the signal failed and get at least general idea how it can be prevented . The rest is yours, you should know your pair/tf more than other.
You can also re-explore your minimum-maximum period for both Major and minor xHMA+.
Keep in mind that all numbers in Setting are conceptually in a form of range . You don't want to get superb equity curves but actually a "fragile" , means one can easily turn it to disaster just by changing only a fraction in one/two of the setting.
---
If you just wanna test the strength of the indicator alone, you can disable "Use StopLoss" temporarily while optimising settings.
Using no SL might be tempting in overall result data in some cases, but NOTE: It is not recommended to not using SL, don't forget that we deliberately enter when it's in high volatility. If want to add flexibility or trading for long-term, just maximise your SL. ie.: chose SL Point>ATR only and set it maximum. (Check your max drawdown after this).
I think this is quite important specially for beginners, so here's an example; Hypothetically in below scenario, because of some settings, the buy order after the loss sell signal didn't appear. Let's say if our initial capital only 1000$ using leverage and order size 0,5 lot (risky position sizing already), moreover if this happens at the beginning of your trading season, that's half of account gone already in one trade . Your max SL should've made you exit after that pumping bar.
The Trailing Minimum Profit is actually look like this. Search in the code if you want to plot it. I just don't like too many lines on chart.
To maximise profit we can try enabling double-order. The only added rule coded is: RSI should rising when buy and falling when sell. 2nd signal will appears above or below default buy/sell signal. (Of course it's also prone to double-loss, re-check your max drawdown after. Profit factor play its part in here for a long run). Snapshot in comparison:
Two default sell signals on left closed at RSI exit, the additional sell signal closed later on when price crossover minor xHMA+. On buy side, price haven't met our minimum profit when first crossunder minor xHMA+. If later on we hit SL on this "+buy" signal, at least we already profited from default buy signal. You can also consider/treat this as multiple TP points.
For longer-term trading, what you need to maximise is the Minimum Profit , so it won't exit whenever an exit condition happened, it can happen several times before reaching minimum profit. Hopefully this snapshot can explain:
Notice in comparison default sell and buy signal now close in average after 3 days. What's best is when we also have confirmation from higher TF. It's like targeting higher TF by entering from smaller TF.
As also mention in the study, we can still experiment via original HMA by putting same value for minimum-maximum period setting. This is experimental EU 1H with Major xHMA+: 144-144, Flat market 13, Distance multiplier 3.6, with 2nd order activated.
Kiwi was a bit surprising for me. It's flat market is effectively below 6, with quite far distance zone of 3.5. Probably because I'm using big numbers in adaptive period.
---
The result you see in strategy tester report below for EURUSD 15m is using just default settings you see in code, as follow:
0,1 lot for each order (which is the smallest allowed by my broker).
No pyramiding. Commission: 0.5 usd per order. Slippage: 3
Opening position is only using basic strategy #1 (RSI exit). Additional exit not activated.
Minimum Profit: 1. TP: 3.
SL use: Half-distance zone. Max SL: 4.5.
Major xHMA+: 172-233. minor xHMA+: 89-121
Distance Zone Multiplier: 2.7
RSI: Standard 14.
(From our forward-testing, the difference we get from net profit is because of the spread, our entry isn't exactly at the close/open price. Not so much though, but not the same. If somebody can direct me to any example where we can code our entry via current bid/ask price, that would be awesome!)
It's already a long post (sorry), think I'm gonna pause here. Check out the code :)
---
DISCLAIMER: Past performance is no guarantee of future results , and so on.. you know the drill ;)
Please read whole description first before using, don't take 1-2 paragraph and claim it's the whole logic, you are responsible of your own actions and understanding.

Flawless Victory Strategy - 15min BTC Machine Learning StrategyHello everyone, I am a heavy Python programmer bringing machine learning to TradingView. This 15 minute Bitcoin Long strategy was created using a machine learning library and 1 year of historical data in Python. Every parameter is hyper optimized to bring you the most profitable buy and sell signals for Bitcoin on the 15min chart. The historical Bitcoin data was gathered from Binance API, in case you want to know the best exchange to use this long strategy. It is a simple Bollinger Band and RSI strategy with two versions included in the tradingview settings. The first version has a Sharpe Ratio of 7.5 which is amazing, and the second version includes the best stop loss and take profit positions with a Sharpe Ratio of 2.5 . Let me talk a little bit more about how the strategy works. The buy signal is triggered when close price is less than lower Bollinger Band at Std Dev 1, and the RSI is greater than a certain value. The sell signal is triggered when close price is greater than upper Bollinger Band at Std Dev 1, and the RSI is greater than a certain value. What makes this strategy interesting is the parameters the Machine Learning library found when backtesting for the best Sharpe Ratio. I left my computer on for about 28 hours to fully backtest 5000 EPOCHS and get the results. I was able to create a great strategy that might be one of TradingView's best strategies out on the website today. I will continue to apply machine learning to all my strategies from here on forward. Please Let me know if you have any questions or certain strategies you would like me to hyper optimize for you. I'm always willing to create profitable strategies!
P.S. You can always pyramid this strategy for more gains! I just don't add pyramiding when creating my strategies because I want to show you the true win/loss ratio based buying one time and one selling one time. I feel like when creating a strategy that includes pyramiding right off the bat falsifies the win rate. This is my way of being transparent with you all. Have fun trading!

Ultimate Strategy TemplateHello Traders
As most of you know, I'm a member of the PineCoders community and I sometimes take freelance pine coding jobs for TradingView users.
Off the top of my head, users often want to:
- convert an indicator into a strategy, so as to get the backtesting statistics from TradingView
- add alerts to their indicator/strategy
- develop a generic strategy template which can be plugged into (almost) any indicator
My gift for the community today is my Ultimate Strategy Template
Step 1: Create your connector
Adapt your indicator with only 2 lines of code and then connect it to this strategy template.
For doing so:
1) Find in your indicator where are the conditions printing the long/buy and short/sell signals.
2) Create an additional plot as below
I'm giving an example with a Two moving averages cross.
Please replicate the same methodology for your indicator wether it's a MACD, ZigZag, Pivots, higher-highs, lower-lows or whatever indicator with clear buy and sell conditions
//@version=4
study(title='Moving Average Cross', shorttitle='Moving Average Cross', overlay=true, precision=6, max_labels_count=500, max_lines_count=500)
type_ma1 = input(title="MA1 type", defval="SMA", options= )
length_ma1 = input(10, title = " MA1 length", type=input.integer)
type_ma2 = input(title="MA2 type", defval="SMA", options= )
length_ma2 = input(100, title = " MA2 length", type=input.integer)
// MA
f_ma(smoothing, src, length) =>
iff(smoothing == "RMA", rma(src, length),
iff(smoothing == "SMA", sma(src, length),
iff(smoothing == "EMA", ema(src, length), src)))
MA1 = f_ma(type_ma1, close, length_ma1)
MA2 = f_ma(type_ma2, close, length_ma2)
// buy and sell conditions
buy = crossover(MA1, MA2)
sell = crossunder(MA1, MA2)
plot(MA1, color=color_ma1, title="Plot MA1", linewidth=3)
plot(MA2, color=color_ma2, title="Plot MA2", linewidth=3)
plotshape(buy, title='LONG SIGNAL', style=shape.circle, location=location.belowbar, color=color_ma1, size=size.normal)
plotshape(sell, title='SHORT SIGNAL', style=shape.circle, location=location.abovebar, color=color_ma2, size=size.normal)
/////////////////////////// SIGNAL FOR STRATEGY /////////////////////////
Signal = buy ? 1 : sell ? -1 : 0
plot(Signal, title="🔌Connector🔌", transp=100)
Basically, I identified my buy, sell conditions in the code and added this at the bottom of my indicator code
Signal = buy ? 1 : sell ? -1 : 0
plot(Signal, title="🔌Connector🔌", transp=100)
Important Notes
🔥 The Strategy Template expects the value to be exactly 1 for the bullish signal , and -1 for the bearish signal
Now you can connect your indicator to the Strategy Template using the method below or that one
Step 2: Connect the connector
1) Add your updated indicator to a TradingView chart
2) Add the Strategy Template as well to the SAME chart
3) Open the Strategy Template settings and in the Data Source field select your 🔌Connector🔌 (which comes from your indicator)
From then, you should start seeing the signals and plenty of other stuff on your chart
🔥 Note that whenever you'll update your indicator values, the strategy statistics and visual on your chart will update in real-time
Settings
- Color Candles : Color the candles based on the trade state (bullish, bearish, neutral)
- Close positions at market at the end of each session : useful for everything but cryptocurrencies
- Session time ranges : Take the signals from a starting time to an ending time
- Close Direction : Choose to close only the longs, shorts, or both
- Date Filter : Take the signals from a starting date to an ending date
- Set the maximum losing streak length with an input
- Set the maximum winning streak length with an input
- Set the maximum consecutive days with a loss
- Set the maximum drawdown (in % of strategy equity)
- Set the maximum intraday loss in percentage
- Limit the number of trades per day
- Limit the number of trades per week
- Stop-loss: None or Percentage or Trailing Stop Percentage or ATR
- Take-Profit: None or Percentage or ATR
- Risk-Reward based on ATR multiple for the Stop-Loss and Take-Profit
This script is open-source so feel free to use it, and optimize it as you want
Alerts
Maybe you didn't know it but alerts are available on strategy scripts.
I added them in this template - that's cool because:
- if you don't know how to code, now you can connect your indicator and get alerts
- you have now a cool template showing you how to create alerts for strategy scripts
Source: www.tradingview.com
I hope you'll like it, use it, optimize it and most importantly....make some optimizations to your indicators thanks to this Strategy template
Special Thanks
Special thanks to @JosKodify as I borrowed a few risk management snippets from his website: kodify.net
Additional features
I thought of plenty of extra filters that I'll add later on this week on this strategy template
Best
Dave
