[laoowai]BNB_USDT_3m_3Commas_Bollinger_MACD_RSI_StrategyBNB_USDT _3m
Release Notes:
Time: 3min
Pair: BNB_USDT
Use: {{strategy.order.alert_message}}
What's the difference with 3Commas Bollinger Strategy by tedwardd:
1. Initial capital: 1210 USDT (10$ Base order / 400$*3 Safety order), if you will change, please change JUST safety order volume or number of safety orders 2-3
2. Using just 2(3) safety order (original script 4)
3. More high-performance strategy for BNB_USDT
4. Using MACD to sell order (original script take profit by scale), thanks Drun30 .
5. Using RSI to analyze the market conditions.
Need to change:
bot_id = input(title="3Commas Bot ID", defval=" YOUR DATA ")
email_token = input(title="Bot Email Token", defval=" YOUR DATA ")
---------------------------------------------------------------------------------------------------------------------------------------------------------------------------------------------------
FAQ copy from tedwardd
---------------------------------------------------------------------------------------------------------------------------------------------------------------------------------------------------
This strategy is intended for use as a way of backtesting various parameters available on 3commas.
The primary inputs for the strategy are:
---------------------------------------------------------------------------------------------------------------------------------------------------------------------------------------------------
// USER INPUTS
Short MA Window - The length of the Short moving average
Long MA Window - The length of the Long moving average
Upper Band Offset - The offset to use for the upper bollinger offset
Lower Band Offset - The offset to use for the lower bollinger offset
Long Stop Loss % - The stop loss percentage to test
Long Take Profit % - The Take profit percentage to test
Initial SO Deviation % - The price deviation percentage required to place to first safety order
Safety Order Vol Step % - The volume scale to test
3Commas Bot ID - (self-explanatory)
Bot Email Token - Found in the deal start message for your bot (see link in the previous section for details)
3Commas Bot Trading Pair - The pair to include for composite bot start deals (should match the format of 3commas, not TradingView IE. USDT_BTC not BTCUSDT )
---------------------------------------------------------------------------------------------------------------------------------------------------------------------------------------------------
Start Date, Month, Year and End Date, Month, and Year all apply to the backtesting window. By default, it will use as much data as it can give the current period select (there is less historical data available for periods below 1H) back as far as 2016 (there appears to be no historical data on Trading view much before this). If you would like to test a different period of time, just change these values accordingly.
---------------------------------------------------------------------------------------------------------------------------------------------------------------------------------------------------
Composite bot using a Bollinger band type trading strategy. While its primary intention is to provide users a way of backtesting bot parameters, it can also be used to trigger a deal start by either using the {{strategy.order.alert_message}} field in your alert and providing the bot details in the configuration screen for the strategy or by including the usual deal start message provided by 3commas.
---------------------------------------------------------------------------------------------------------------------------------------------------------------------------------------------------
Original script:
1. 3Commas Bollinger Strategy by tedwardd
2. Momentum Strategy ( BTC /USDT; 1h) - MACD (with source code) by Drun30
Поиск скриптов по запросу "backtesting"

3Commas Bollinger StrategyThis strategy is intended for use as a way of backtesting various parameters available on 3commas.io composite bot using a bollinger band type trading strategy. While it's primary intention is to provide users a way of backtesting bot parameters, it can also be used to trigger a deal start by either using the {{strategy.open.alert_message}} field in your alert and providing the bot details in the configuration screen for the strategy or by including the usual deal start message provided by 3commas. You can find more information about how to do this from help.3commas.io
The primary inputs for the strategy are:
// USER INPUTS
Short MA Window - The length of the Short moving average
Long MA Window - The length of the Long moving average
Upper Band Offset - The offset to use for the upper bollinger offset
Lower Band Offset - The offset to use for the lower bollinger offset
Long Stop Loss % - The stop loss percentage to test
Long Take Profit % - The Take profit percentage to test
Initial SO Deviation % - The price deviation percentage required to place to first safety order
Safety Order Vol Step % - The volume scale to test
3Commas Bot ID - (self explanatory)
Bot Email Token - Found in the deal start message for your bot (see link in previous section for details)
3Commas Bot Trading Pair - The pair to include for composite bot start deals (should match format of 3commas, not TradingView IE. USDT_BTC not BTCUSDT)
Start Date, Month, Year and End Date, Month and Year all apply to the backtesting window. By default it will use as much data as it can given the current period select (there is less historical data available for periods below 1H) back as far as 2016 (there appears to be no historical data on Trading view much before this). If you would like to test a different period of time, just change these values accordingly.
Known Issues
Currently there are a couple of issues with this strategy that you should be aware of. I may fix them at some point in the future but they don't really bug me so this is more for informational purposes than a promise that they may one day be fixed.
Does not test trailing take profit
Number of safety orders and Safety Order Step Scale are currently not user configurable (must edit source code)
Using the user configuration to generate deal start message assumes you are triggering a composite bot, not a simple bot.

ML Adaptive SuperTrend Strategy [trade_crush]# ML Adaptive SuperTrend Strategy - User Guide
## Introduction
The **ML Adaptive SuperTrend Strategy** is a sophisticated trading tool that combines traditional trend-following logic with **Machine Learning (K-Means Clustering)** to dynamically adapt to market volatility. Unlike standard SuperTrend indicators that use a fixed ATR, this strategy analyzes historical volatility to categorize the current market into distinct clusters, providing more precise entries and exits.
>
> **Special Thanks:** This strategy is based on the innovative work of **AlgoAlpha**. You can explore their extensive library of high-quality indicators and strategies on TradingView: (www.tradingview.com).
---
## Machine Learning Engine (K-Means)
The core of this strategy is its ability to "learn" from recent market behavior.
- **K-Means Clustering**: The script takes the last $N$ bars of ATR data and runs an iterative clustering algorithm to find three "centroids" representing **High**, **Medium**, and **Low** volatility.
- **Adaptive ATR**: Based on the current volatility, the strategy selects the nearest centroid to use as the ATR value for the SuperTrend calculation. This ensures the trailing stop tightens during low volatility and widens during high volatility to avoid "noise".
---
## Key Features
### 1. Non-Repainting Signals
- **Confirm Signals**: When enabled, signals are only triggered after a bar closes. This ensures that the arrows and entries you see on the chart are permanent and reliable for backtesting.
### 2. Intelligent Risk Management
- **Multiple SL/TP Types**: Choose between **Percentage** based stops or **ATR** based stops for both Stop Loss and Take Profit.
- **Trailing Stop Loss (TSL)**:
- Supports both Percentage and ATR modes.
- **Activation Offset**: Only activates the trailing mechanism after the price has moved a certain percentage in your favor, protecting early-stage trades.
### 3. Risk-Based Position Sizing
- **Dynamic Quantity**: If enabled, the strategy automatically calculates the trade size based on your **Risk % Per Trade** and the distance to your **Stop Loss**. This ensures you never lose more than your defined risk on a single trade.
---
## User Input Guide
### SuperTrend & ML Settings
- **ATR Length**: The window used to calculate market volatility.
- **SuperTrend Factor**: The multiplier that determines the distance of the trailing stop from the price.
- **Use ML Adaptive ATR**: Toggle between the ML-enhanced logic and standard ATR.
- **Training Data Length**: How many historical bars the ML engine analyzes to find clusters.
### Risk Management
- **Stop Loss Type**: Set to Percentage, ATR, or None.
- **TS Activation Offset**: The profit buffer required before the trailing stop starts following the price.
- **Use Risk-Based Sizing**: Toggle this to let the script manage your position size automatically.
---
## How to Trade with This Strategy
1. **Monitor the Dashboard**: Check the top-right table to see which volatility cluster the market is currently in.
2. **Observe the Fills**: The adaptive fills (green/red) visualize the "breathing room" the strategy is giving the price.
3. **Execution**: The strategy enters on "ML Bullish" (Triangle Up) and "ML Bearish" (Triangle Down) signals.
4. **Exits**: The script will automatically exit based on your SL, TP, or Trailing Stop settings.
---
## Credits
Original Concept: **AlgoAlpha**
Strategy Conversion & Enhancements: **Antigravity AI**

Trend Pulse Channel StrategyOverview
Trend Pulse Channel Strategy is a long-only trend-following breakout strategy built around an adaptive multi-pole smoothing filter and a volatility-adjusted price channel.
The strategy is designed to participate in sustained directional moves by entering only when price confirms momentum strength beyond a dynamic upper boundary, while avoiding mean-reversion and low-quality consolidation phases.
This script is published as a strategy and includes realistic backtesting assumptions for position sizing, commissions, and slippage.
Core Concept
At the heart of the strategy is a multi-pole adaptive EMA-based filter, inspired by advanced digital signal smoothing techniques.
Using multiple poles allows the filter to reduce noise while preserving responsiveness to genuine trend changes.
To adapt the channel width to changing market conditions, the strategy applies the same filtering logic to True Range, producing a volatility-aware envelope rather than a static or fixed-percentage band.
This combination allows the strategy to:
Track directional bias using a smoothed central filter
Adjust channel width dynamically based on market volatility
Trigger entries only when price expansion confirms trend strength
Entry Logic
A long position is opened when:
Price crosses above the upper channel band
The signal occurs within the user-defined date range
This condition represents a volatility-confirmed breakout aligned with the prevailing directional filter.
Exit Logic
The long position is closed when:
Price crosses back below the upper band
This exit logic aims to stay in trending moves while exiting when upside momentum weakens.
The strategy does not open short positions by design.
Inputs and Defaults
The default inputs are selected to balance smoothness, responsiveness, and stability:
Source (HLC3): Reduces single-price noise by averaging high, low, and close
Period (144): Defines the primary smoothing horizon of the adaptive filter
Poles (4): Controls the smoothness vs. responsiveness trade-off
Range Multiplier (1.414): Scales the volatility envelope using filtered True Range
Reduced Lag (optional): Applies lag compensation to improve responsiveness
Fast Response (optional): Blends multi-pole and single-pole filters for quicker reaction at the cost of smoothness
All inputs are fully configurable and can be adjusted to suit different instruments and timeframes.
Risk Management & Position Sizing
The strategy uses:
Position size: 10% of equity per trade
No pyramiding
Long positions only
This sizing approach is intended to reflect sustainable risk exposure rather than aggressive capital deployment. Users may further adjust position size based on their own risk tolerance.
Backtesting Assumptions
The strategy is tested using :
Initial capital: 10,000
Commission: 0.1%
Slippage: 1 tick
Order fill model: Standard OHLC
These settings are chosen to provide more realistic performance estimates compared to idealized backtests.
This strategy is best suited for :
Trend-oriented markets
Higher timeframes where breakouts are more reliable
Users seeking systematic trend participation rather than frequent scalping
In sideways or range-bound market conditions, price may cross the channel boundaries frequently.
This can result in a higher number of entry and exit signals that do not develop into sustained trends.
For this reason, the strategy should be used with an understanding of basic technical analysis concepts, including market structure, trend identification, and consolidation behavior.
It is intended as a decision-support tool, not a standalone trading system.
Users—whether beginners or experienced traders—should avoid relying solely on this strategy and are encouraged to combine it with broader market context and additional analysis methods.
Disclaimer
This script is provided for educational and analytical purposes only. It does not constitute financial advice. Past performance does not guarantee future results.

Simple Candle Strategy# Candle Pattern Strategy - Pine Script V6
## Overview
A TradingView trading strategy script (Pine Script V6) that identifies candlestick patterns over a configurable lookback period and generates trading signals based on pattern recognition rules.
## Strategy Logic
The strategy analyzes the most recent N candlesticks (default: 5) and classifies their patterns into three categories, then generates buy/sell signals based on specific pattern combinations.
### Candlestick Pattern Classification
Each candlestick is classified as one of three types:
| Pattern | Definition | Formula |
|---------|-----------|---------|
| **Close at High** | Close price near the highest price of the candle | `(high - close) / (high - low) ≤ (1 - threshold)` |
| **Close at Low** | Close price near the lowest price of the candle | `(close - low) / (high - low) ≤ (1 - threshold)` |
| **Doji** | Opening and closing prices very close; long upper/lower wicks | `abs(close - open) / (high - low) ≤ threshold` |
### Trading Rules
| Condition | Action | Signal |
|-----------|--------|--------|
| Number of Doji candles ≥ 3 | **SKIP** - Market is too chaotic | No trade |
| "Close at High" count ≥ 2 + Last candle closes at high | **LONG** - Bullish confirmation | Buy Signal |
| "Close at Low" count ≥ 2 + Last candle closes at low | **SHORT** - Bearish confirmation | Sell Signal |
## Configuration Parameters
All parameters are adjustable in TradingView's "Settings/Inputs" tab:
| Parameter | Default | Range | Description |
|-----------|---------|-------|-------------|
| **K-line Lookback Period** | 5 | 3-20 | Number of candlesticks to analyze |
| **Doji Threshold** | 0.1 | 0.0-1.0 | Body size / Total range ratio for doji identification |
| **Doji Count Limit** | 3 | 1-10 | Number of dojis that triggers skip signal |
| **Close at High Proximity** | 0.9 | 0.5-1.0 | Required proximity to highest price (0.9 = 90%) |
| **Close at Low Proximity** | 0.9 | 0.5-1.0 | Required proximity to lowest price (0.9 = 90%) |
### Parameter Tuning Guide
#### Proximity Thresholds (Close at High/Low)
- **0.95 or higher**: Stricter - only very strong candles qualify
- **0.90 (default)**: Balanced - good for most market conditions
- **0.80 or lower**: Looser - catches more patterns, higher false signals
#### Doji Threshold
- **0.05-0.10**: Strict doji identification
- **0.10-0.15**: Standard doji detection
- **0.15+**: Includes near-doji patterns
#### Lookback Period
- **3-5 bars**: Fast, sensitive to recent patterns
- **5-10 bars**: Balanced approach
- **10-20 bars**: Slower, filters out noise
## Visual Indicators
### Chart Markers
- **Green Up Arrow** ▲: Long entry signal triggered
- **Red Down Arrow** ▼: Short entry signal triggered
- **Gray X**: Skip signal (too many dojis detected)
### Statistics Table
Located at top-right corner, displays real-time pattern counts:
- **Close at High**: Count of candles closing near the high
- **Close at Low**: Count of candles closing near the low
- **Doji**: Count of doji/near-doji patterns
### Signal Labels
- Green label: "✓ Long condition met" - below entry bar
- Red label: "✓ Short condition met" - above entry bar
- Gray label: "⊠ Too many dojis, skip" - trade skipped
## Risk Management
### Exit Strategy
The strategy includes built-in exit rules based on ATR (Average True Range):
- **Stop Loss**: ATR × 2
- **Take Profit**: ATR × 3
Example: If ATR is $10, stop loss is at -$20 and take profit is at +$30
### Position Sizing
Default: 100% of equity per trade (adjustable in strategy properties)
**Recommendation**: Reduce to 10-25% of equity for safer capital allocation
## How to Use
### 1. Copy the Script
1. Open TradingView
2. Go to Pine Script Editor
3. Create a new indicator
4. Copy the entire `candle_pattern_strategy.pine` content
5. Click "Add to Chart"
### 2. Apply to Chart
- Select your preferred timeframe (1m, 5m, 15m, 1h, 4h, 1d)
- Choose a trading symbol (stocks, forex, crypto, etc.)
- The strategy will generate signals on all historical bars and in real-time
### 3. Configure Parameters
1. Right-click the strategy on chart → "Settings"
2. Adjust parameters in the "Inputs" tab
3. Strategy will recalculate automatically
4. Backtest results appear in the Strategy Tester panel
### 4. Backtesting
1. Click "Strategy Tester" (bottom panel)
2. Set date range for historical testing
3. Review performance metrics:
- Win rate
- Profit factor
- Drawdown
- Total returns
## Key Features
✅ **Execution Model Compliant** - Follows official Pine Script V6 standards
✅ **Global Scope** - All historical references in global scope for consistency
✅ **Adjustable Sensitivity** - Fine-tune all pattern detection thresholds
✅ **Real-time Updates** - Works on both historical and real-time bars
✅ **Visual Feedback** - Clear signals with labels and statistics table
✅ **Risk Management** - Built-in ATR-based stop loss and take profit
✅ **No Repainting** - Signals remain consistent after bar closes
## Important Notes
### Before Trading Live
1. **Backtest thoroughly**: Test on at least 6-12 months of historical data
2. **Paper trading first**: Practice with simulated trades
3. **Optimize parameters**: Find the best settings for your trading instrument
4. **Manage risk**: Never risk more than 1-2% per trade
5. **Monitor performance**: Review trades regularly and adjust as needed
### Market Conditions
The strategy works best in:
- Trending markets with clear directional bias
- Range-bound markets with defined support/resistance
- Markets with moderate volatility
The strategy may underperform in:
- Highly choppy/noisy markets (many false signals)
- Markets with gaps or overnight gaps
- Low liquidity periods
### Limitations
- Works on chart timeframes only (not intrabar analysis)
- Requires at least 5 bars of history (configurable)
- Fixed exit rules may not suit all trading styles
- No trend filtering (will trade both directions)
## Technical Details
### Historical Buffer Management
The strategy declares maximum bars back to ensure enough historical data:
```pine
max_bars_back(close, 20)
max_bars_back(open, 20)
max_bars_back(high, 20)
max_bars_back(low, 20)
```
This prevents runtime errors when accessing historical candlestick data.
### Pattern Detection Algorithm
```
For each bar in lookback period:
1. Calculate (high - close) / (high - low) → close_to_high_ratio
2. If close_to_high_ratio ≤ (1 - threshold) → count as "Close at High"
3. Calculate (close - low) / (high - low) → close_to_low_ratio
4. If close_to_low_ratio ≤ (1 - threshold) → count as "Close at Low"
5. Calculate abs(close - open) / (high - low) → body_ratio
6. If body_ratio ≤ doji_threshold → count as "Doji"
Signal Generation:
7. If doji_count ≥ cross_count_limit → SKIP_SIGNAL
8. If close_at_high_count ≥ 2 AND last_close_at_high → LONG_SIGNAL
9. If close_at_low_count ≥ 2 AND last_close_at_low → SHORT_SIGNAL
```
## Example Scenarios
### Scenario 1: Bullish Signal
```
Last 5 bars pattern:
Bar 1: Closes at high (95%) ✓
Bar 2: Closes at high (92%) ✓
Bar 3: Closes at mid (50%)
Bar 4: Closes at low (10%)
Bar 5: Closes at high (96%) ✓ (last bar)
Result:
- Close at high count: 3 (≥ 2) ✓
- Last closes at high: ✓
- Doji count: 0 (< 3) ✓
→ LONG SIGNAL ✓
```
### Scenario 2: Skip Signal
```
Last 5 bars pattern:
Bar 1: Doji pattern ✓
Bar 2: Doji pattern ✓
Bar 3: Closes at mid
Bar 4: Doji pattern ✓
Bar 5: Closes at high
Result:
- Doji count: 3 (≥ 3)
→ SKIP SIGNAL - Market too chaotic
```
## Performance Optimization
### Tips for Better Results
1. **Use Higher Timeframes**: 15m or higher reduces false signals
2. **Combine with Indicators**: Add volume or trend filters
3. **Seasonal Adjustment**: Different parameters for different seasons
4. **Instrument Selection**: Test on liquid, high-volume instruments
5. **Regular Rebalancing**: Adjust parameters quarterly based on performance
## Troubleshooting
### No Signals Generated
- Check if lookback period is too large
- Verify proximity thresholds aren't too strict (try 0.85 instead of 0.95)
- Ensure doji limit allows for trading (try 4-5 instead of 3)
### Too Many False Signals
- Increase proximity thresholds to 0.95+
- Reduce lookback period to 3-4 bars
- Increase doji limit to 3-4
- Test on higher timeframes
### Strategy Tester Shows Losses
- Review individual trades to identify patterns
- Adjust stop loss and take profit ratios
- Change lookback period and thresholds
- Test on different market conditions
## References
- (www.tradingview.com)
- (www.tradingview.com)
- (www.investopedia.com)
- (www.investopedia.com)
## Disclaimer
**This strategy is provided for educational and research purposes only.**
- Not financial advice
- Past performance does not guarantee future results
- Always conduct thorough backtesting before live trading
- Trading involves significant risk of loss
- Use proper risk management and position sizing
## License
Created: December 15, 2025
Version: 1.0
---
**For updates and modifications, refer to the accompanying documentation files.**

Trend Following $BTC - Multi-Timeframe Structure + ReversTREND FOLLOWING STRATEGY - MULTI-TIMEFRAME STRUCTURE BREAKOUT SYSTEM
Strategy Overview
This is an enhanced Turtle Trading system designed for cryptocurrency spot trading. It combines Donchian Channel breakouts with multi-timeframe structure filtering and ATR-based dynamic risk management. The strategy trades both long and short positions using reverse signal exits to maximize trend capture.
Core Features
Multi-Timeframe Structure Filtering
The strategy uses Swing High/Low analysis to identify market structure trends. You can customize the structure timeframe (default: 3 minutes) to match your trading style. Only enters trades aligned with the identified trend direction, avoiding counter-trend positions that often lead to losses.
Reverse Signal Exit System
Instead of using fixed stop-losses or time-based exits, this strategy exits positions only when a reverse entry signal triggers. This approach maximizes trend profits and reduces premature exits during normal market retracements.
ATR Dynamic Pyramiding
Automatically adds positions when price moves 0.5 ATR in your favor. Supports up to 2 units maximum (adjustable). This pyramid scaling enhances profitability during strong trends while maintaining disciplined risk management.
Complete Risk Management
Fixed position sizing at 5000 USD per unit. Includes realistic commission fees of 0.06% (Binance spot rate). Initial capital set at 10,000 USD. All backtest parameters reflect real-world trading conditions.
Trading Logic
Entry Conditions
Long Entry: Close price breaks above the 20-period high AND structure trend is bullish (price breaks above Swing High)
Short Entry: Close price breaks below the 20-period low AND structure trend is bearish (price breaks below Swing Low)
Position Scaling
Long positions: Add when price rises 0.5 ATR or more
Short positions: Add when price falls 0.5 ATR or more
Maximum 2 units including initial entry
Exit Conditions
Long Exit: Triggers when short entry signal appears (price breaks 20-period low + structure turns bearish)
Short Exit: Triggers when long entry signal appears (price breaks 20-period high + structure turns bullish)
Default Parameters
Channel Settings
Entry Channel Period: 20 (Donchian Channel breakout period)
Exit Channel Period: 10 (reserved parameter)
ATR Settings
ATR Period: 20
Stop Loss ATR Multiplier: 2.0
Add Position ATR Multiplier: 0.5
Structure Filter
Swing Length: 300 (Swing High/Low calculation period)
Structure Timeframe: 3 minutes
Adjust these based on your trading timeframe and asset volatility
Position Management
Maximum Units: 2 (including initial entry)
Capital Per Unit: 5000 USD
Visualization Features
Background Colors
Light Green: Bullish market structure
Light Red: Bearish market structure
Dark Green: Long position entry
Dark Red: Short position entry
Optional Display Elements (Default: OFF)
Entry and exit channel lines
Structure high/low reference lines
ATR stop-loss indicator
Next position add level
Entry/exit labels
Alert Message Format
The strategy sends notifications with the following format:
Entry: "5m Long EP:90450.50"
Add Position: "15m Add Long 2/2 EP:91000.25"
Exit: "5m Close Long Reverse Signal"
Where the first part shows your current chart timeframe and EP indicates Entry Price
Backtest Settings
Capital Allocation
Initial Capital: 10,000 USD
Per Entry: 5,000 USD (split into 2 potential entries)
Leverage: 0x (spot trading only)
Trading Costs
Commission: 0.06% (Binance spot VIP0 rate)
Slippage: 0 (adjust based on your experience)
Best Use Cases
Ideal Scenarios
Trending markets with clear directional movement
Moderate to high volatility assets
Timeframes from 1-minute to 4-hour charts
Best suited for major cryptocurrencies with good liquidity
Not Recommended For
Highly volatile choppy/ranging markets
Low liquidity small-cap coins
Extreme market conditions or black swan events
Usage Recommendations
Timeframe Guidelines
1-5 minute charts: Use for scalping, consider Swing Length 100-160
15-30 minute charts: Good for short-term trading, Swing Length 50-100
1-4 hour charts: Suitable for swing trading, Swing Length 20-50
Optimization Tips
Always backtest on historical data before live trading
Adjust swing length based on asset volatility and your timeframe
Different cryptocurrencies may require different parameter settings
Enable visualization options initially to understand entry/exit points
Monitor win rate and drawdown during backtesting
Technical Details
Built on Pine Script v6
No repainting - uses proper bar referencing with offset
Prevents lookahead bias with lookahead=off parameter
Strategy mode with accurate commission and slippage modeling
Multi-timeframe security function for structure analysis
Proper position state tracking to avoid duplicate signals
Risk Disclaimer
This strategy is provided for educational and research purposes only. Past performance does not guarantee future results. Backtesting results may differ from live trading due to slippage, execution delays, and changing market conditions. The strategy performs best in trending markets and may experience drawdowns during ranging conditions. Always practice proper risk management and never risk more than you can afford to lose. It is recommended to paper trade first and start with small position sizes when going live.
How to Use
Add the strategy to your TradingView chart
Select your desired timeframe (1m to 4h recommended)
Adjust parameters based on your risk tolerance and trading style
Review backtest results in the Strategy Tester tab
Set up alerts for automated notifications
Consider paper trading before risking real capital
Tags
Trend Following, Turtle Trading, Donchian Channel, Structure Breakout, ATR, Cryptocurrency, Spot Trading, Risk Management, Pyramiding, Multi-Timeframe Analysis
---
Strategy Name: Trend Following BTC
Version: v1.0
Pine Script Version: v6
Last Updated: December 2025

Triple EMA + RSI + ATRThis comprehensive trading system combines triple EMA alignment, RSI momentum filtering, and dynamic ATR-based risk management. The strategy enters positions only when fast, medium, and slow EMAs align in proper order (bullish or bearish), confirmed by RSI remaining within defined thresholds (not overbought/oversold) and a volume spike above its moving average. Exits are managed intelligently using a multi-tier approach: a fixed stop-loss based on ATR, a first profit target at a predefined risk-reward ratio, and a trailing stop that activates after reaching a second, higher profit tier. Designed for trend-following with built-in momentum and volume confirmation, it features professional order execution with configurable commission and slippage for realistic backtesting. Visual cues including colored backgrounds and signal shapes enhance chart clarity.

ParabolicSAR+EMA[TS_Indie]🚀 EMA + Parabolic SAR Reversal Trading Strategy
This trading system effectively combines the use of Exponential Moving Averages (EMA) with the Parabolic SAR to identify both price trends and key reversal points. The EMA Fast is used to signal the primary short-term trend, while the EMA Slow acts as a filter for the long-term trend direction. The Parabolic SAR then helps to confirm the reversal signals.
🛠️ Tools Used
1. EMA Fast – Primary Short-Term Trend
2. EMA Slow – Long-Term Trend Filter
3. Parabolic SAR – Reversal Confirmation
🎯 Entry Rules
📈 Buy Setup
1. Trend Filter: EMA Fast > EMA Slow → Uptrend
2. Pullback: Price pulls back and closes below the EMA Fast line.
3. Reversal: Price reverses/pulls back up and closes above the EMA Fast line.
4. SAR Confirmation: The previous Parabolic SAR dot is above the high, and the dot in the current candle is below the low → Reversal signal confirmed.
5. Entry: Enter Buy immediately.
📉 Sell Setup
1. Trend Filter: EMA Fast < EMA Slow → Downtrend
2. Pullback: Price pulls back and closes above the EMA Fast line.
3. Reversal: Price reverses/pulls back down and closes below the EMA Fast line.
4. SAR Confirmation: The previous Parabolic SAR dot is below the low, and the dot in the current candle is above the high → Reversal signal confirmed.
5. Entry: Enter Sell immediately.
💰 Exit Management (Entry, Stop Loss, Take Profit)
1. Entry: Enter the order at the closing price of the signal candle.
2. Stop Loss (SL): Set the Stop Loss at the Parabolic SAR dot.
3. Take Profit (TP): Calculated from the Entry and Stop Loss points, multiplied by the Risk Reward Ratio.
⚙️ Optional Parameters
➭ Custom Risk/Reward Ratio for Take Profit.
➭ Option to add an ATR buffer to the Stop Loss.
➭ Adjustable EMA Fast period.
➭ Adjustable EMA Slow period.
➭ Adjustable Parabolic SAR parameters.
➭ Option to enable Long-only / Short-only positions.
➭ Customizable Backtest start and end date.
➭ Customizable trading session time.
🔔 Alert Function
Alerts display:
➭ Entry Price
➭ Stop Loss Price
➭ Take Profit Price
💡 This strategy allows for many parameter adjustments, such as the MA type, adding/subtracting from the Stop Loss using ATR, and selecting specific sessions for backtesting. If you find interesting or profitable results after adjusting the parameters, please share your comments with other traders!
⚠️ Disclaimer
This indicator is designed for educational and research purposes only. It does not guarantee profits and should not be considered financial advice. Trading in financial markets involves significant risk , including the potential loss of capital.

Mirror Blocks: StrategyMirror Blocks is an educational structural-wave model built around a unique concept:
the interaction of mirrored weighted moving averages (“blocks”) that reflect shifts in market structure as price transitions between layered symmetry zones.
Rather than attempting to “predict” markets, the Mirror Blocks framework visualizes how price behaves when it expands away from, contracts toward, or flips across stacked WMA structures. These mirrored layers form a wave-like block system that highlights transitional zones in a clean, mechanical way.
This strategy version allows you to study how these structural transitions behave in different environments and on different timeframes.
The goal is understanding wave structure, not generating signals.
How It Works
Mirror Blocks builds three mirrored layers:
Top Block (Structural High Symmetry)
Base Block (Neutral Wave)
Bottom Block (Structural Low Symmetry)
The relative position of these blocks — and how price interacts with them — helps visualize:
Compression and expansion
Reversal zones
Wave stability
Momentum transitions
Structure flips
A structure is considered bullish-stack aligned when:
Top > Base > Bottom
and bearish-stack aligned when:
Bottom > Base > Top
These formations create the core of the Mirror Blocks wave engine.
What the Strategy Version Adds
This version includes:
Long Only, Short Only, or Long & Short modes
Adjustable symmetry distance (Mirror Distance)
Configurable WMA smoothing length
Optional trend filter using fast/slow MA comparison
ENTER / EXIT / LONG / SHORT labels for structural transitions
Fixed stop-loss controls for research
A clean, transparent structure with no hidden components
It is optimized for educational chart study, not automated signals.
Intended Purpose
Mirror Blocks is meant to help traders:
Study structural transitions
Understand symmetry-based wave models
Explore how price interacts with mirrored layers
Examine reversals and expansions from a mechanical perspective
Conduct long and short backtesting for research
Develop a deeper sense of market rhythm
This is not a prediction model.
It is a visual and structural framework for understanding movement.
Backtesting Disclaimer
Backtest results can vary depending on:
Slippage settings
Commission settings
Timeframe
Asset volatility
Structural sensitivity parameters
Past performance does not guarantee future results.
Use this as a research tool only.
Warnings & Compliance
This script is educational.
It is not financial advice.
It does not provide signals.
It does not promise profitability.
The purpose is to help visualize structure, not predict price.
The strategy features are simply here to help users study how structural transitions behave under various conditions.
License
Released under the Michael Culpepper Gratitude License (2025).
Use and modify freely for education and research with attribution.
No resale.
No promises of profitability.
Purpose is understanding, not signals.

4-Hour Range Scalping [v6.3]User Guide: 4-Hour Range Scalping Strategy
Hello! Here is the guide for the Pine Script strategy. Please read it carefully to get the best results.
📈 This script automates the "4-Hour Range Scalping Strategy" from the video.
The main idea is that the first four hours of a major trading day (like New York) set up a "trap zone." The strategy waits for the price to break out of this zone and then fail, giving us a signal that the breakout was false and the price is likely to reverse.
Here’s the simple logic:
Define the Range: It precisely calculates the highest high and lowest low during the first four hours of the selected trading session (e.g., 00:00 to 04:00 New York Time).
Wait for a Breakout: It then monitors the 5-minute chart for a price breakout where a candle fully closes outside of this established range.
Identify the Reversal: The trade trigger occurs when the price fails to continue its breakout and a subsequent 5-minute candle closes back inside the range. This signals a potential reversal or "failed breakout."
Execute the Trade:
]A Short (Sell) trade is triggered after a failed breakout above the range high.
A Long (Buy) trade is triggered after a failed breakout below the range low.
Manage the Risk: The Stop Loss is automatically placed at the peak (for shorts) or trough (for longs) of the breakout move, and the Take Profit is set to a default 2:1 Risk/Reward Ratio.
How to Use the Script (Step-by-Step) ⚙️
Follow these instructions to get it running perfectly.
1. Set Your Chart Timeframe This is the most important step. The strategy is designed to run on a 5-minute (5m) chart. Open your TradingView chart and make sure the timeframe is set to "5m".
2. Add the Script to Your Chart Open the Pine Editor tab at the bottom of TradingView, paste the entire script, and click the "Add to chart" button.
3. Configure the Settings On your chart, find the strategy's name (e.g., "4-Hour Range Scalping ") and click the gear icon ⚙️ to open its settings.
Trading Session: Choose the session for the range. New York is the default and the one from the video.
Risk/Reward Ratio: The default is 2.0, meaning your potential profit is twice your potential loss. You can adjust this to test other targets.
Backtesting Period: To see how the strategy performed on all historical data, go to the "Strategy Tester" panel, click its own gear icon ⚙️, and uncheck the boxes for "Start Date" and "End Date."
4. Understand the Visuals on Your Chart
Blue Background Area: This is the 4-hour calculation window. The script is identifying the day's high and low during this time. No trades will ever happen here.
Red Line (Range High): The highest price of the 4-hour window. This is the upper boundary of the "trap zone."
Green Line (Range Low): The lowest price of the 4-hour window. This is the lower boundary.
Green Triangle (▲): Shows where a Long (Buy) trade was entered.
Red Triangle (▼): Shows where a Short (Sell) trade was entered.
A Very Important Note on Timezones 🕒
This is critical for you in the Philippines (PHT).
The script is based on the New York session, which is 12 hours behind you. Your TradingView chart will still show your local time, but the script works on NY time in the background.
The New York "day" begins at 12:00 PM (Noon) your time.
The script's blue calculation window will be from 12:00 PM to 4:00 PM your local time.
The red and green range lines will appear on your chart only after 4:00 PM your time.
So, if you look at your chart in the morning or early afternoon, you will not see today's range yet. This is normal! The script is just waiting for the New York session to start.
How to Set Up Trade Alerts 🔔
You can have TradingView send you a notification whenever the script enters a trade.
Click the "Alert" button (looks like a clock) in the right-hand toolbar of TradingView.
In the "Condition" dropdown, select the name of the script (e.g., "4-Hour Range Scalping...").
You will then see two options: "Long Signal" and "Short Signal".
Select one (e.g., "Long Signal") and configure how you want to be notified (e.g., "Notify on app").
Click "Create". Repeat the process to create an alert for the other signal.
⚠️ Important Disclosure
For Educational and Research Purposes Only.
This script and all accompanying information are provided for educational and research purposes only. The strategy demonstrated is a technical concept and should not be misconstrued as financial, investment, legal, or tax advice.
Trading financial markets involves substantial risk and is not suitable for every investor. There is a possibility that you could sustain a loss of some or all of your initial investment. Therefore, you should not invest money that you cannot afford to lose.
Past performance is not indicative of future results. The backtesting results shown by this script are historical and do not guarantee future performance. Market conditions are constantly changing.
By using this script, you acknowledge that you are solely responsible for any and all trading decisions you make. You should conduct your own thorough research and, if necessary, seek advice from an independent financial advisor before making any investment decisions. The creators of this script assume no liability for any of your trading results.

Turtle Strategy - Triple EMA Trend with ADX and ATRDescription
The Triple EMA Trend strategy is a directional momentum system built on the alignment of three exponential moving averages and a strong ADX confirmation filter. It is designed to capture established trends while maintaining disciplined risk management through ATR-based stops and targets.
Core Logic
The system activates only under high-trend conditions, defined by the Average Directional Index (ADX) exceeding a configurable threshold (default: 43).
A bullish setup occurs when the short-term EMA is above the mid-term EMA, which in turn is above the long-term EMA, and price trades above the fastest EMA.
A bearish setup is the mirror condition.
Execution Rules
Entry:
• Long when ADX confirms trend strength and EMA alignment is bullish.
• Short when ADX confirms trend strength and EMA alignment is bearish.
Exit:
• Stop Loss: 1.8 × ATR below (for longs) or above (for shorts) the entry price.
• Take Profit: 3.3 × ATR in the direction of the trade.
Both parameters are configurable.
Additional Features
• Start/end date inputs for controlled backtesting.
• Selective activation of long or short trades.
• Built-in commission and position sizing (percent of equity).
• Full visual representation of EMAs, ADX, stop-loss, and target levels.
This strategy emphasizes clean trend participation, strict entry qualification, and consistent reward-to-risk structure. Ideal for swing or medium-term testing across trending assets.

BOCS Channel Scalper Strategy - Automated Mean Reversion System# BOCS Channel Scalper Strategy - Automated Mean Reversion System
## WHAT THIS STRATEGY DOES:
This is an automated mean reversion trading strategy that identifies consolidation channels through volatility analysis and executes scalp trades when price enters entry zones near channel boundaries. Unlike breakout strategies, this system assumes price will revert to the channel mean, taking profits as price bounces back from extremes. Position sizing is fully customizable with three methods: fixed contracts, percentage of equity, or fixed dollar amount. Stop losses are placed just outside channel boundaries with take profits calculated either as fixed points or as a percentage of channel range.
## KEY DIFFERENCE FROM ORIGINAL BOCS:
**This strategy is designed for traders seeking higher trade frequency.** The original BOCS indicator trades breakouts OUTSIDE channels, waiting for price to escape consolidation before entering. This scalper version trades mean reversion INSIDE channels, entering when price reaches channel extremes and betting on a bounce back to center. The result is significantly more trading opportunities:
- **Original BOCS**: 1-3 signals per channel (only on breakout)
- **Scalper Version**: 5-15+ signals per channel (every touch of entry zones)
- **Trade Style**: Mean reversion vs trend following
- **Hold Time**: Seconds to minutes vs minutes to hours
- **Best Markets**: Ranging/choppy conditions vs trending breakouts
This makes the scalper ideal for active day traders who want continuous opportunities within consolidation zones rather than waiting for breakout confirmation. However, increased trade frequency also means higher commission costs and requires tighter risk management.
## TECHNICAL METHODOLOGY:
### Price Normalization Process:
The strategy normalizes price data to create consistent volatility measurements across different instruments and price levels. It calculates the highest high and lowest low over a user-defined lookback period (default 100 bars). Current close price is normalized using: (close - lowest_low) / (highest_high - lowest_low), producing values between 0 and 1 for standardized volatility analysis.
### Volatility Detection:
A 14-period standard deviation is applied to the normalized price series to measure price deviation from the mean. Higher standard deviation values indicate volatility expansion; lower values indicate consolidation. The strategy uses ta.highestbars() and ta.lowestbars() to identify when volatility peaks and troughs occur over the detection period (default 14 bars).
### Channel Formation Logic:
When volatility crosses from a high level to a low level (ta.crossover(upper, lower)), a consolidation phase begins. The strategy tracks the highest and lowest prices during this period, which become the channel boundaries. Minimum duration of 10+ bars is required to filter out brief volatility spikes. Channels are rendered as box objects with defined upper and lower boundaries, with colored zones indicating entry areas.
### Entry Signal Generation:
The strategy uses immediate touch-based entry logic. Entry zones are defined as a percentage from channel edges (default 20%):
- **Long Entry Zone**: Bottom 20% of channel (bottomBound + channelRange × 0.2)
- **Short Entry Zone**: Top 20% of channel (topBound - channelRange × 0.2)
Long signals trigger when candle low touches or enters the long entry zone. Short signals trigger when candle high touches or enters the short entry zone. This captures mean reversion opportunities as price reaches channel extremes.
### Cooldown Filter:
An optional cooldown period (measured in bars) prevents signal spam by enforcing minimum spacing between consecutive signals. If cooldown is set to 3 bars, no new long signal will fire until 3 bars after the previous long signal. Long and short cooldowns are tracked independently, allowing both directions to signal within the same period.
### ATR Volatility Filter:
The strategy includes a multi-timeframe ATR filter to avoid trading during low-volatility conditions. Using request.security(), it fetches ATR values from a specified timeframe (e.g., 1-minute ATR while trading on 5-minute charts). The filter compares current ATR to a user-defined minimum threshold:
- If ATR ≥ threshold: Trading enabled
- If ATR < threshold: No signals fire
This prevents entries during dead zones where mean reversion is unreliable due to insufficient price movement.
### Take Profit Calculation:
Two TP methods are available:
**Fixed Points Mode**:
- Long TP = Entry + (TP_Ticks × syminfo.mintick)
- Short TP = Entry - (TP_Ticks × syminfo.mintick)
**Channel Percentage Mode**:
- Long TP = Entry + (ChannelRange × TP_Percent)
- Short TP = Entry - (ChannelRange × TP_Percent)
Default 50% targets the channel midline, a natural mean reversion target. Larger percentages aim for opposite channel edge.
### Stop Loss Placement:
Stop losses are placed just outside the channel boundary by a user-defined tick offset:
- Long SL = ChannelBottom - (SL_Offset_Ticks × syminfo.mintick)
- Short SL = ChannelTop + (SL_Offset_Ticks × syminfo.mintick)
This logic assumes channel breaks invalidate the mean reversion thesis. If price breaks through, the range is no longer valid and position exits.
### Trade Execution Logic:
When entry conditions are met (price in zone, cooldown satisfied, ATR filter passed, no existing position):
1. Calculate entry price at zone boundary
2. Calculate TP and SL based on selected method
3. Execute strategy.entry() with calculated position size
4. Place strategy.exit() with TP limit and SL stop orders
5. Update info table with active trade details
The strategy enforces one position at a time by checking strategy.position_size == 0 before entry.
### Channel Breakout Management:
Channels are removed when price closes more than 10 ticks outside boundaries. This tolerance prevents premature channel deletion from minor breaks or wicks, allowing the mean reversion setup to persist through small boundary violations.
### Position Sizing System:
Three methods calculate position size:
**Fixed Contracts**:
- Uses exact contract quantity specified in settings
- Best for futures traders (e.g., "trade 2 NQ contracts")
**Percentage of Equity**:
- position_size = (strategy.equity × equity_pct / 100) / close
- Dynamically scales with account growth
**Cash Amount**:
- position_size = cash_amount / close
- Maintains consistent dollar exposure regardless of price
## INPUT PARAMETERS:
### Position Sizing:
- **Position Size Type**: Choose Fixed Contracts, % of Equity, or Cash Amount
- **Number of Contracts**: Fixed quantity per trade (1-1000)
- **% of Equity**: Percentage of account to allocate (1-100%)
- **Cash Amount**: Dollar value per position ($100+)
### Channel Settings:
- **Nested Channels**: Allow multiple overlapping channels vs single channel
- **Normalization Length**: Lookback for high/low calculation (1-500, default 100)
- **Box Detection Length**: Period for volatility detection (1-100, default 14)
### Scalping Settings:
- **Enable Long Scalps**: Toggle long entries on/off
- **Enable Short Scalps**: Toggle short entries on/off
- **Entry Zone % from Edge**: Size of entry zone (5-50%, default 20%)
- **SL Offset (Ticks)**: Distance beyond channel for stop (1+, default 5)
- **Cooldown Period (Bars)**: Minimum spacing between signals (0 = no cooldown)
### ATR Filter:
- **Enable ATR Filter**: Toggle volatility filter on/off
- **ATR Timeframe**: Source timeframe for ATR (1, 5, 15, 60 min, etc.)
- **ATR Length**: Smoothing period (1-100, default 14)
- **Min ATR Value**: Threshold for trade enablement (0.1+, default 10.0)
### Take Profit Settings:
- **TP Method**: Choose Fixed Points or % of Channel
- **TP Fixed (Ticks)**: Static distance in ticks (1+, default 30)
- **TP % of Channel**: Dynamic target as channel percentage (10-100%, default 50%)
### Appearance:
- **Show Entry Zones**: Toggle zone labels on channels
- **Show Info Table**: Display real-time strategy status
- **Table Position**: Corner placement (Top Left/Right, Bottom Left/Right)
- **Color Settings**: Customize long/short/TP/SL colors
## VISUAL INDICATORS:
- **Channel boxes** with semi-transparent fill showing consolidation zones
- **Colored entry zones** labeled "LONG ZONE ▲" and "SHORT ZONE ▼"
- **Entry signal arrows** below/above bars marking long/short entries
- **Active TP/SL lines** with emoji labels (⊕ Entry, 🎯 TP, 🛑 SL)
- **Info table** showing position status, channel state, last signal, entry/TP/SL prices, and ATR status
## HOW TO USE:
### For 1-3 Minute Scalping (NQ/ES):
- ATR Timeframe: "1" (1-minute)
- ATR Min Value: 10.0 (for NQ), adjust per instrument
- Entry Zone %: 20-25%
- TP Method: Fixed Points, 20-40 ticks
- SL Offset: 5-10 ticks
- Cooldown: 2-3 bars
- Position Size: 1-2 contracts
### For 5-15 Minute Day Trading:
- ATR Timeframe: "5" or match chart
- ATR Min Value: Adjust to instrument (test 8-15 for NQ)
- Entry Zone %: 20-30%
- TP Method: % of Channel, 40-60%
- SL Offset: 5-10 ticks
- Cooldown: 3-5 bars
- Position Size: Fixed contracts or 5-10% equity
### For 30-60 Minute Swing Scalping:
- ATR Timeframe: "15" or "30"
- ATR Min Value: Lower threshold for broader market
- Entry Zone %: 25-35%
- TP Method: % of Channel, 50-70%
- SL Offset: 10-15 ticks
- Cooldown: 5+ bars or disable
- Position Size: % of equity recommended
## BACKTEST CONSIDERATIONS:
- Strategy performs best in ranging, mean-reverting markets
- Strong trending markets produce more stop losses as price breaks channels
- ATR filter significantly reduces trade count but improves quality during low volatility
- Cooldown period trades signal quantity for signal quality
- Commission and slippage materially impact sub-5-minute timeframe performance
- Shorter timeframes require tighter entry zones (15-20%) to catch quick reversions
- % of Channel TP adapts better to varying channel sizes than fixed points
- Fixed contract sizing recommended for consistent risk per trade in futures
**Backtesting Parameters Used**: This strategy was developed and tested using realistic commission and slippage values to provide accurate performance expectations. Recommended settings: Commission of $1.40 per side (typical for NQ futures through discount brokers), slippage of 2 ticks to account for execution delays on fast-moving scalp entries. These values reflect real-world trading costs that active scalpers will encounter. Backtest results without proper cost simulation will significantly overstate profitability.
## COMPATIBLE MARKETS:
Works on any instrument with price data including stock indices (NQ, ES, YM, RTY), individual stocks, forex pairs (EUR/USD, GBP/USD), cryptocurrency (BTC, ETH), and commodities. Volume-based features require data feed with volume information but are optional for core functionality.
## KNOWN LIMITATIONS:
- Immediate touch entry can fire multiple times in choppy zones without adequate cooldown
- Channel deletion at 10-tick breaks may be too aggressive or lenient depending on instrument tick size
- ATR filter from lower timeframes requires higher-tier TradingView subscription (request.security limitation)
- Mean reversion logic fails in strong breakout scenarios leading to stop loss hits
- Position sizing via % of equity or cash amount calculates based on close price, may differ from actual fill price
- No partial closing capability - full position exits at TP or SL only
- Strategy does not account for gap openings or overnight holds
## RISK DISCLOSURE:
Trading involves substantial risk of loss. Past performance does not guarantee future results. This strategy is for educational purposes and backtesting only. Mean reversion strategies can experience extended drawdowns during trending markets. Stop losses may not fill at intended levels during extreme volatility or gaps. Thoroughly test on historical data and paper trade before risking real capital. Use appropriate position sizing and never risk more than you can afford to lose. Consider consulting a licensed financial advisor before making trading decisions. Automated trading systems can malfunction - monitor all live positions actively.
## ACKNOWLEDGMENT & CREDITS:
This strategy is built upon the channel detection methodology created by **AlgoAlpha** in the "Smart Money Breakout Channels" indicator. Full credit and appreciation to AlgoAlpha for pioneering the normalized volatility approach to identifying consolidation patterns. The core channel formation logic using normalized price standard deviation is AlgoAlpha's original contribution to the TradingView community.
Enhancements to the original concept include: mean reversion entry logic (vs breakout), immediate touch-based signals, multi-timeframe ATR volatility filtering, flexible position sizing (fixed/percentage/cash), cooldown period filtering, dual TP methods (fixed points vs channel percentage), automated strategy execution with exit management, and real-time position monitoring table.

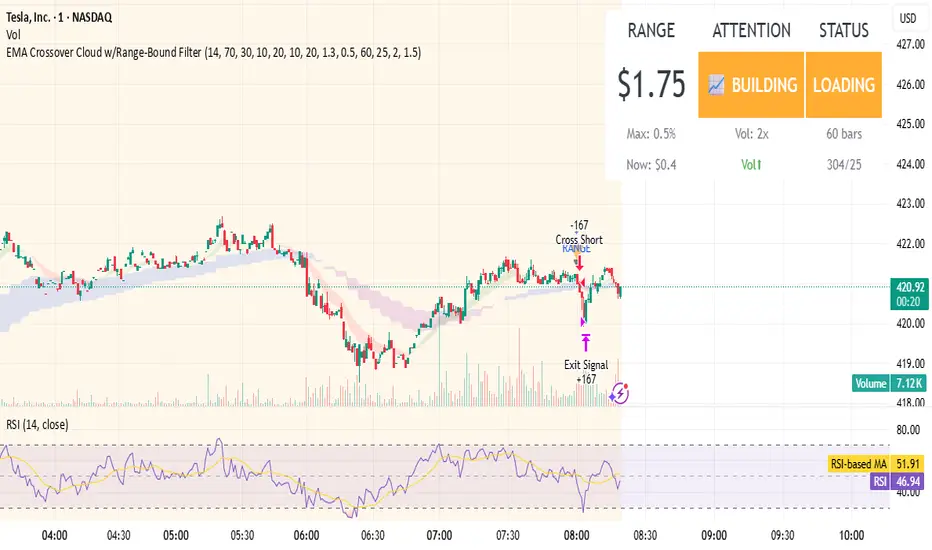
EMA Crossover Cloud w/Range-Bound FilterA focused 1-minute EMA crossover trading strategy designed to identify high-probability momentum trades while filtering out low-volatility consolidation periods that typically result in whipsaw losses. Features intelligent range-bound detection and progressive market attention alerts to help traders manage focus and avoid overtrading during unfavorable conditions.
Key Features:
EMA Crossover Signals: 10/20 EMA crossovers with volume surge confirmation (1.3x 20-bar average)
Range-Bound Filter: Automatically detects when price is consolidating in tight ranges (0.5% threshold) and blocks trading signals during these periods
Progressive Consolidation Stages: Visual alerts progress through Range Bound (red) → Coiling (yellow) → Loading (orange) → Trending (green) to indicate market compression and potential breakout timing
Market Attention Gauge: Helps manage focus between active trading and other activities with states: Active (watch close), Building (check frequently), Quiet (check occasionally), Dead (handle other business)
Smart RSI Exits: Cloud-based and RSI extreme level exits with conservative stop losses
Dual Mode Operation: Separate settings allow full backtesting performance while providing visual stay-out warnings for manual trading
How to Use:
Entry Signals: Trade aqua up-triangles (long) and orange down-triangles (short) when they appear with volume confirmation
Stay-Out Warnings: Ignore gray "RANGE" triangles - these indicate crossovers during range-bound periods that should be avoided
Monitor Top-Right Display:
Range: Current 60-bar dollar range
Attention: Market activity level for focus management
Status: Consolidation stage (trade green/yellow, avoid red, prepare for orange)
Position Sizing: Default 167 shares per signal, optimized for the crossover frequency
Alerts: Enable consolidation stage alerts and market attention alerts for automated notifications
Recommended Settings:
Timeframe: 1-minute charts
Symbol: Optimized for volatile stocks like TSLA
"Apply Filter to Backtest": Keep OFF for realistic backtesting, ON to see filtered results
Risk Management:
The strategy includes built-in overtrading protection by identifying and blocking trades during low-volatility periods. The progressive consolidation alerts help identify when markets are "loading" for significant moves, allowing traders to position appropriately for higher-probability setups.
Golden Cross Strategy & BacktesterGolden Cross Strategy & Backtester 📈🚀
Overview
This script provides a complete backtesting environment for the classic Golden Cross trend-following strategy. It is designed to be simple, visual, and easy to use. 💪
The strategy operates on the following logic:
🔼 Long Entry: A "Buy" signal is generated when the short-term moving average (Short MA) crosses above the long-term moving average (Long MA).
🔽 Exit: The position is closed when the short-term moving average crosses back below the long-term moving average (a "Death Cross").
The background of the chart will be shaded green 🎨 during periods when the strategy is holding an active position.
How to Use for Backtesting 🔬
This is a strategy script, which means its main purpose is to test the historical performance of this trading idea.
Add this script to your chart.
Open the "Strategy Tester" panel at the bottom of your chart.
In the "Overview" and "Performance" tabs, you can see detailed results 📊, such as the Net Profit and Max Drawdown, to evaluate the strategy's effectiveness.
Customization ⚙️
You can easily customize the strategy's parameters without editing the code.
Click the Settings/Gear icon (⚙️) next to the script's name on your chart.
In the "Inputs" tab, you can change:
📏 Short MA Length: The period for the fast-moving average (default is 50).
📏 Long MA Length: The period for the slow-moving average (default is 200).
In the "Properties" tab, you can change:
💰 Initial Capital: The starting balance for the backtest.
Feel free to test different settings to find what works best for your preferred asset and timeframe! Happy testing! 🎉

The Barking Rat LiteMomentum & FVG Reversion Strategy
The Barking Rat Lite is a disciplined, short-term mean-reversion strategy that combines RSI momentum filtering, EMA bands, and Fair Value Gap (FVG) detection to identify short-term reversal points. Designed for practical use on volatile markets, it focuses on precise entries and ATR-based take profit management to balance opportunity and risk.
Core Concept
This strategy seeks potential reversals when short-term price action shows exhaustion outside an EMA band, confirmed by momentum and FVG signals:
EMA Bands:
Parameters used: A 20-period EMA (fast) and 100-period EMA (slow).
Why chosen:
- The 20 EMA is sensitive to short-term moves and reflects immediate momentum.
- The 100 EMA provides a slower, structural anchor.
When price trades outside both bands, it often signals overextension relative to both short-term and medium-term trends.
Application in strategy:
- Long entries are only considered when price dips below both EMAs, identifying potential undervaluation.
- Short entries are only considered when price rises above both EMAs, identifying potential overvaluation.
This dual-band filter avoids counter-trend signals that would occur if only a single EMA was used, making entries more selective..
Fair Value Gap Detection (FVG):
Parameters used: The script checks for dislocations using a 12-bar lookback (i.e. comparing current highs/lows with values 12 candles back).
Why chosen:
- A 12-bar displacement highlights significant inefficiencies in price structure while filtering out micro-gaps that appear every few bars in high-volatility markets.
- By aligning FVG signals with candle direction (bullish = close > open, bearish = close < open), the strategy avoids random gaps and instead targets ones that suggest exhaustion.
Application in strategy:
- Bullish FVGs form when earlier lows sit above current highs, hinting at downward over-extension.
- Bearish FVGs form when earlier highs sit below current lows, hinting at upward over-extension.
This gives the strategy a structural filter beyond simple oscillators, ensuring signals have price-dislocation context.
RSI Momentum Filter:
Parameters used: 14-period RSI with thresholds of 80 (overbought) and 20 (oversold).
Why chosen:
- RSI(14) is a widely recognized momentum measure that balances responsiveness with stability.
- The thresholds are intentionally extreme (80/20 vs. the more common 70/30), so the strategy only engages at genuine exhaustion points rather than frequent minor corrections.
Application in strategy:
- Longs trigger when RSI < 20, suggesting oversold exhaustion.
- Shorts trigger when RSI > 80, suggesting overbought exhaustion.
This ensures entries are not just technically valid but also backed by momentum extremes, raising conviction.
ATR-Based Take Profit:
Parameters used: 14-period ATR, with a default multiplier of 4.
Why chosen:
- ATR(14) reflects the prevailing volatility environment without reacting too much to outliers.
- A multiplier of 4 is a pragmatic compromise: wide enough to let trades breathe in volatile conditions, but tight enough to enforce disciplined exits before mean reversion fades.
Application in strategy:
- At entry, a fixed target is set = Entry Price ± (ATR × 4).
- This target scales automatically with volatility: narrower in calm periods, wider in explosive markets.
By avoiding discretionary exits, the system maintains rule-based discipline.
Visual Signals on Chart
Blue “▲” below candle: Potential long entry
Orange/Yellow “▼” above candle: Potential short entry
Green “✔️”: Trade closed at ATR take profit
Blue (20 EMA) & Orange (100 EMA) lines: Dynamic channel reference
⚙️Strategy report properties
Position size: 25% equity per trade
Initial capital: 10,000.00 USDT
Pyramiding: 10 entries per direction
Slippage: 2 ticks
Commission: 0.055% per side
Backtest timeframe: 1-minute
Backtest instrument: HYPEUSDT
Backtesting range: Jul 28, 2025 — Aug 17, 2025
Note on Sample Size:
You’ll notice the report displays fewer than the ideal 100 trades in the strategy report above. This is intentional. The goal of the script is to isolate high-quality, short-term reversal opportunities while filtering out low-conviction setups. This means that the Barking Rat Lite strategy is very selective, filtering out over 90% of market noise. The brief timeframe shown in the strategy report here illustrates its filtering logic over a short window — not its full capabilities. As a result, even on lower timeframes like the 1-minute chart, signals are deliberately sparse — each one must pass all criteria before triggering.
For a larger dataset:
Once the strategy is applied to your chart, users are encouraged to expand the lookback range or apply the strategy to other volatile pairs to view a full sample.
💡Why 25% Equity Per Trade?
While it's always best to size positions based on personal risk tolerance, we defaulted to 25% equity per trade in the backtesting data — and here’s why:
Backtests using this sizing show manageable drawdowns even under volatile periods.
The strategy generates a sizeable number of trades, reducing reliance on a single outcome.
Combined with conservative filters, the 25% setting offers a balance between aggression and control.
Users are strongly encouraged to customize this to suit their risk profile.
What makes Barking Rat Lite valuable
Combines multiple layers of confirmation: EMA bands + FVG + RSI
Adaptive to volatility: ATR-based exits scale with market conditions
Clear, actionable visuals: Easy to monitor and manage trades

Mutanabby_AI | Algo Pro Strategy# Mutanabby_AI | Algo Pro Strategy: Advanced Candlestick Pattern Trading System
## Strategy Overview
The Mutanabby_AI Algo Pro Strategy represents a systematic approach to automated trading based on advanced candlestick pattern recognition and multi-layered technical filtering. This strategy transforms traditional engulfing pattern analysis into a comprehensive trading system with sophisticated risk management and flexible position sizing capabilities.
The strategy operates on a long-only basis, entering positions when bullish engulfing patterns meet specific technical criteria and exiting when bearish engulfing patterns indicate potential trend reversals. The system incorporates multiple confirmation layers to enhance signal reliability while providing comprehensive customization options for different trading approaches and risk management preferences.
## Core Algorithm Architecture
The strategy foundation relies on bullish and bearish engulfing candlestick pattern recognition enhanced through technical analysis filtering mechanisms. Entry signals require simultaneous satisfaction of four distinct criteria: confirmed bullish engulfing pattern formation, candle stability analysis indicating decisive price action, RSI momentum confirmation below specified thresholds, and price decline verification over adjustable lookback periods.
The candle stability index measures the ratio between candlestick body size and total range including wicks, ensuring only well-formed patterns with clear directional conviction generate trading signals. This filtering mechanism eliminates indecisive market conditions where pattern reliability diminishes significantly.
RSI integration provides momentum confirmation by requiring oversold conditions before entry signal generation, ensuring alignment between pattern formation and underlying momentum characteristics. The RSI threshold remains fully adjustable to accommodate different market conditions and volatility environments.
Price decline verification examines whether current prices have decreased over a specified period, confirming that bullish engulfing patterns occur after meaningful downward movement rather than during sideways consolidation phases. This requirement enhances the probability of successful reversal pattern completion.
## Advanced Position Management System
The strategy incorporates dual position sizing methodologies to accommodate different account sizes and risk management approaches. Percentage-based position sizing calculates trade quantities as equity percentages, enabling consistent risk exposure across varying account balances and market conditions. This approach proves particularly valuable for systematic trading approaches and portfolio management applications.
Fixed quantity sizing provides precise control over trade sizes independent of account equity fluctuations, offering predictable position management for specific trading strategies or when implementing precise risk allocation models. The system enables seamless switching between sizing methods through simple configuration adjustments.
Position quantity calculations integrate seamlessly with TradingView's strategy testing framework, ensuring accurate backtesting results and realistic performance evaluation across different market conditions and time periods. The implementation maintains consistency between historical testing and live trading applications.
## Comprehensive Risk Management Framework
The strategy features dual stop loss methodologies addressing different risk management philosophies and market analysis approaches. Entry price-based stop losses calculate stop levels as fixed percentages below entry prices, providing predictable risk exposure and consistent risk-reward ratio maintenance across all trades.
The percentage-based stop loss system enables precise risk control by limiting maximum loss per trade to predetermined levels regardless of market volatility or entry timing. This approach proves essential for systematic trading strategies requiring consistent risk parameters and capital preservation during adverse market conditions.
Lowest low-based stop losses identify recent price support levels by analyzing minimum prices over adjustable lookback periods, placing stops below these technical levels with additional buffer percentages. This methodology aligns stop placement with market structure rather than arbitrary percentage calculations, potentially improving stop loss effectiveness during normal market fluctuations.
The lookback period adjustment enables optimization for different timeframes and market characteristics, with shorter periods providing tighter stops for active trading and longer periods offering broader stops suitable for position trading approaches. Buffer percentage additions ensure stops remain below obvious support levels where other market participants might place similar orders.
## Visual Customization and Interface Design
The strategy provides comprehensive visual customization through eight predefined color schemes designed for different chart backgrounds and personal preferences. Color scheme options include Classic bright green and red combinations, Ocean themes featuring blue and orange contrasts, Sunset combinations using gold and crimson, and Neon schemes providing high visibility through bright color selections.
Professional color schemes such as Forest, Royal, and Fire themes offer sophisticated alternatives suitable for business presentations and professional trading environments. The Custom color scheme enables precise color selection through individual color picker controls, maintaining maximum flexibility for specific visual requirements.
Label styling options accommodate different chart analysis preferences through text bubble, triangle, and arrow display formats. Size adjustments range from tiny through huge settings, ensuring appropriate visual scaling across different screen resolutions and chart configurations. Text color customization maintains readability across various chart themes and background selections.
## Signal Quality Enhancement Features
The strategy incorporates signal filtering mechanisms designed to eliminate repetitive signal generation during choppy market conditions. The disable repeating signals option prevents consecutive identical signals until opposing conditions occur, reducing overtrading during consolidation phases and improving overall signal quality.
Signal confirmation requirements ensure all technical criteria align before trade execution, reducing false signal occurrence while maintaining reasonable trading frequency for active strategies. The multi-layered approach balances signal quality against opportunity frequency through adjustable parameter optimization.
Entry and exit visualization provides clear trade identification through customizable labels positioned at relevant price levels. Stop loss visualization displays active risk levels through colored line plots, ensuring complete transparency regarding current risk management parameters during live trading operations.
## Implementation Guidelines and Optimization
The strategy performs effectively across multiple timeframes with optimal results typically occurring on intermediate timeframes ranging from fifteen minutes through four hours. Higher timeframes provide more reliable pattern formation and reduced false signal occurrence, while lower timeframes increase trading frequency at the expense of some signal reliability.
Parameter optimization should focus on RSI threshold adjustments based on market volatility characteristics and candlestick pattern timeframe analysis. Higher RSI thresholds generate fewer but potentially higher quality signals, while lower thresholds increase signal frequency with corresponding reliability considerations.
Stop loss method selection depends on trading style preferences and market analysis philosophy. Entry price-based stops suit systematic approaches requiring consistent risk parameters, while lowest low-based stops align with technical analysis methodologies emphasizing market structure recognition.
## Performance Considerations and Risk Disclosure
The strategy operates exclusively on long positions, making it unsuitable for bear market conditions or extended downtrend periods. Users should consider market environment analysis and broader trend assessment before implementing the strategy during adverse market conditions.
Candlestick pattern reliability varies significantly across different market conditions, with higher reliability typically occurring during trending markets compared to ranging or volatile conditions. Strategy performance may deteriorate during periods of reduced pattern effectiveness or increased market noise.
Risk management through stop loss implementation remains essential for capital preservation during adverse market movements. The strategy does not guarantee profitable outcomes and requires proper position sizing and risk management to prevent significant capital loss during unfavorable trading periods.
## Technical Specifications
The strategy utilizes standard TradingView Pine Script functions ensuring compatibility across all supported instruments and timeframes. Default configuration employs 14-period RSI calculations, adjustable candle stability thresholds, and customizable price decline verification periods optimized for general market conditions.
Initial capital settings default to $10,000 with percentage-based equity allocation, though users can adjust these parameters based on account size and risk tolerance requirements. The strategy maintains detailed trade logs and performance metrics through TradingView's integrated backtesting framework.
Alert integration enables real-time notification of entry and exit signals, stop loss executions, and other significant trading events. The comprehensive alert system supports automated trading applications and manual trade management approaches through detailed signal information provision.
## Conclusion
The Mutanabby_AI Algo Pro Strategy provides a systematic framework for candlestick pattern trading with comprehensive risk management and position sizing flexibility. The strategy's strength lies in its multi-layered confirmation approach and sophisticated customization options, enabling adaptation to various trading styles and market conditions.
Successful implementation requires understanding of candlestick pattern analysis principles and appropriate parameter optimization for specific market characteristics. The strategy serves traders seeking automated execution of proven technical analysis techniques while maintaining comprehensive control over risk management and position sizing methodologies.

Advanced Supertrend StrategyA comprehensive Pine Script v5 strategy featuring an enhanced Supertrend indicator with multiple technical filters, risk management, and advanced signal confirmation for automated trading on TradingView.
## Features
- **Enhanced Supertrend**: Configurable ATR-based trend following with improved accuracy
- **RSI Filter**: Optional RSI-based signal filtering to avoid overbought/oversold conditions
- **Moving Average Filter**: Trend confirmation using SMA/EMA/WMA with customizable periods
- **Risk Management**: Built-in stop-loss and take-profit based on ATR multiples
- **Trend Strength Analysis**: Filters weak signals by requiring minimum trend duration
- **Breakout Confirmation**: Optional price breakout validation for stronger signals
- **Visual Interface**: Comprehensive chart plotting with multiple indicator overlays
- **Advanced Alerts**: Multiple alert conditions with detailed signal information
- **Backtesting**: Full strategy backtesting with commission and realistic execution

Intraday Momentum StrategyExplanation of the StrategyIndicators:Fast and Slow EMA: A crossover of the 9-period EMA over the 21-period EMA signals a bullish trend (long entry), while a crossunder signals a bearish trend (short entry).
RSI: Ensures entries are not in overbought (RSI > 70) or oversold (RSI < 30) conditions to avoid reversals.
VWAP: Acts as a dynamic support/resistance. Long entries require the price to be above VWAP, and short entries require it to be below.
Trading Session:The strategy only trades during a user-defined session (e.g., 9:30 AM to 3:45 PM, typical for US markets).
All positions are closed at the session end to avoid overnight risk.
Risk Management:Stop Loss: 1% below/above the entry price for long/short positions.
Take Profit: 2% above/below the entry price for long/short positions.
These can be adjusted via inputs for optimization.
Position Sizing:Fixed lot size of 1 for simplicity. Adjust based on your account size during backtesting.

Auto Intelligence Selective Moving Average(AI/MA)# 🤖 Auto Intelligence Moving Average Strategy (AI/MA)
**AI/MA** is a state-adaptive moving average crossover strategy designed to **maximize returns from golden cross / death cross logic** by intelligently switching between different MA types and parameters based on market conditions.
---
## 🎯 Objective
To build a moving average crossover strategy that:
- **Adapts dynamically** to market regimes (trend vs range, rising vs falling)
- **Switches intelligently** between SMA, EMA, RMA, and HMA
- **Maximizes cumulative return** under realistic backtesting
---
## 🧪 materials amd methods
- **MA Types Considered**: SMA, EMA, RMA, HMA
- **Parameter Ranges**: Periods from 5 to 40
- **Market Conditions Classification**:
- Based on the slope of a central SMA(20) line
- And the relative position of price to the central line
- Resulting in 4 regimes: A (Bull), B (Pullback), C (Rebound), D (Bear)
- **Optimization Dataset**:
- **Bybit BTCUSDT.P**
- **1-hour candles**
- **2024 full-year**
- **Search Process**:
- **Random search**: 200 parameter combinations
- Evaluated by:
- `Cumulative PnL`
- `Sharpe Ratio`
- `Max Drawdown`
- `R² of linear regression on cumulative PnL`
- **Implementation**:
- Optimization performed in **Python (Pandas + Matplotlib + Optuna-like logic)**
- Final parameters ported to **Pine Script (v5)** for TradingView backtesting
---
## 📈 Performance Highlights (on optimization set)
| Timeframe | Return (%) | Notes |
|-----------|------------|----------------------------|
| 6H | +1731% | Strongest performance |
| 1D | +1691% | Excellent trend capture |
| 12H | +1438% | Balance of trend/range |
| 5min | +27.3% | Even survives scalping |
| 1min | +9.34% | Robust against noise |
- Leverage: 100x
- Position size: 100%
- Fees: 0.055%
- Margin calls: **none** 🎯
---
## 🛠 Technology Stack
- `Python` for data handling and optimization
- `Pine Script v5` for implementation and visualization
- Fully state-aware strategy, modular and extendable
---
## ✨ Final Words
This strategy is **not curve-fitted**, **not over-parameterized**, and has been validated across multiple timeframes. If you're a fan of dynamic, intelligent technical systems, feel free to use and expand it.
💡 The future of simple-yet-smart trading begins here.

Divergence Strategy [Trendoscope®]🎲 Overview
The Divergence Strategy is a sophisticated TradingView strategy that enhances the Divergence Screener by adding automated trade signal generation, risk management, and trade visualization. It leverages the screener’s robust divergence detection to identify bullish, bearish, regular, and hidden divergences, then executes trades with precise entry, stop-loss, and take-profit levels. Designed for traders seeking automated trading solutions, this strategy offers customizable trade parameters and visual feedback to optimize performance across various markets and timeframes.
For core divergence detection features, including oscillator options, trend detection methods, zigzag pivot analysis, and visualization, refer to the Divergence Screener documentation. This description focuses on the strategy-specific enhancements for automated trading and risk management.
🎲 Strategy Features
🎯Automated Trade Signal Generation
Trade Direction Control : Restrict trades to long-only or short-only to align with market bias or strategy goals, preventing conflicting orders.
Divergence Type Selection : Choose to trade regular divergences (bullish/bearish), hidden divergences, or both, targeting reversals or trend continuations.
Entry Type Options :
Cautious : Enters conservatively at pivot points and exits quickly to minimize risk exposure.
Confident : Enters aggressively at the latest price and holds longer to capture larger moves.
Mixed : Combines conservative entries with delayed exits for a balanced approach.
Market vs. Stop Orders: Opt for market orders for instant execution or stop orders for precise price entry.
🎯 Enhanced Risk Management
Risk/Reward Ratio : Define a risk-reward ratio (default: 2.0) to set profit targets relative to stop-loss levels, ensuring consistent trade sizing.
Bracket Orders : Trades include entry, stop-loss, and take-profit levels calculated from divergence pivot points, tailored to the entry type and risk-reward settings.
Stop-Loss Placement : Stops are strategically set (e.g., at recent pivot or last price point) based on entry type, balancing risk and trade validity.
Order Cancellation : Optionally cancel pending orders when a divergence is broken (e.g., price moves past the pivot in the wrong direction), reducing invalid trades. This feature is toggleable for flexibility.
🎯 Trade Visualization
Target and Stop Boxes : Displays take-profit (lime) and stop-loss (orange) levels as boxes on the price chart, extending 10 bars forward for clear visibility.
Dynamic Trade Updates : Trade visualizations are added, updated, or removed as trades are executed, canceled, or invalidated, ensuring accurate feedback.
Overlay Integration : Trade levels overlay the price chart, complementing the screener’s oscillator-based divergence lines and labels.
🎯 Strategy Default Configuration
Capital and Sizing : Set initial capital (default: $1,000,000) and position size (default: 20% of equity) for realistic backtesting.
Pyramiding : Allows up to 4 concurrent trades, enabling multiple divergence-based entries in trending markets.
Commission and Margin : Accounts for commission (default: 0.01%) and margin (100% for long/short) to reflect trading costs.
Performance Optimization : Processes up to 5,000 bars dynamically, balancing historical analysis and real-time execution.
🎲 Inputs and Configuration
🎯Trade Settings
Direction : Select Long or Short (default: Long).
Divergence : Trade Regular, Hidden, or Both divergence types (default: Both).
Entry/Exit Type : Choose Cautious, Confident, or Mixed (default: Cautious).
Risk/Reward : Set the risk-reward ratio for profit targets (default: 2.0).
Use Market Order : Enable market orders for immediate entry (default: false, uses limit orders).
Cancel On Break : Cancel pending orders when divergence is broken (default: true).
🎯Inherited Settings
The strategy inherits all inputs from the Divergence Screener, including:
Oscillator Settings : Oscillator type (e.g., RSI, CCI), length, and external oscillator option.
Trend Settings : Trend detection method (Zigzag, MA Difference, External), MA type, and length.
Zigzag Settings : Zigzag length (fixed repaint = true).
🎲 Entry/Exit Types for Divergence Scenarios
The Divergence Strategy offers three Entry/Exit Type options—Cautious, Confident, and Mixed—which determine how trades are entered and exited based on divergence pivot points. This section explains how these settings apply to different divergence scenarios, with placeholders for screenshots to illustrate each case.
The divergence pattern forms after 3 pivots. The stop and entry levels are formed on one of these levels based on Entry/Exit types.
🎯Bullish Divergence (Reversal)
A bullish divergence occurs when price forms a lower low, but the oscillator forms a higher low, signaling a potential upward reversal.
💎 Cautious:
Entry : At the pivot high point for a conservative entry.
Exit : Stop-loss at the last pivot point (previous low that is higher than the current pivot low); take-profit at risk-reward ratio. Canceled if price breaks below the pivot (if Cancel On Break is enabled).
Behavior : Enters after confirmation and exits quickly to limit downside risk.
💎Confident:
Entry : At the last pivot low, (previous low which is higher than the current pivot low) for an aggressive entry.
Exit : Stop-loss at recent pivot low, which is the lowest point; take-profit at risk-reward ratio. Canceled if price breaks below the pivot. (lazy exit)
Behavior : Enters early to capture trend continuation, holding longer for gains.
💎Mixed:
Entry : At the pivot high point (conservative).
Exit : Stop-loss at the recent pivot point that has resulted in lower low (lazy exit). Canceled if price breaks below the pivot.
Behavior : Balances entry caution with extended holding for trend continuation.
🎯Bearish Divergence (Reversal)
A bearish divergence occurs when price forms a higher high, but the oscillator forms a lower high, indicating a potential downward reversal.
💎Cautious:
Entry : At the pivot low point (lower high) for a conservative short entry.
Exit : Stop-loss at the previous pivot high point (previous high); take-profit at risk-reward ratio. Canceled if price breaks above the pivot (if Cancel On Break is enabled).
Behavior : Enters conservatively and exits quickly to minimize risk.
💎Confident:
Entry : At the last price point (previous high) for an aggressive short entry.
Exit : Stop-loss at the pivot point; take-profit at risk-reward ratio. Canceled if price breaks above the pivot.
Behavior : Enters early to maximize trend continuation, holding longer.
💎Mixed:
Entry : At the previous piot high point (conservative).
Exit : Stop-loss at the last price point (delayed exit). Canceled if price breaks above the pivot.
Behavior : Combines conservative entry with extended holding for downtrend gains.
🎯Bullish Hidden Divergence (Continuation)
A bullish hidden divergence occurs when price forms a higher low, but the oscillator forms a lower low, suggesting uptrend continuation. In case of Hidden bullish divergence, b]Entry is always on the previous pivot high (unless it is a market order)
💎Cautious:
Exit : Stop-loss at the recent pivot low point (higher than previous pivot low); take-profit at risk-reward ratio. Canceled if price breaks below the pivot (if Cancel On Break is enabled).
Behavior : Enters after confirmation and exits quickly to limit downside risk.
💎Confident:
Exit : Stop-loss at previous pivot low, which is the lowest point; take-profit at risk-reward ratio. Canceled if price breaks below the pivot. (lazy exit)
Behavior : Enters early to capture trend continuation, holding longer for gains.
🎯Bearish Hidden Divergence (Continuation)
A bearish hidden divergence occurs when price forms a lower high, but the oscillator forms a higher high, suggesting downtrend continuation. In case of Hidden Bearish divergence, b]Entry is always on the previous pivot low (unless it is a market order)
💎Cautious:
Exit : Stop-loss at the latest pivot high point (which is a lower high); take-profit at risk-reward ratio. Canceled if price breaks above the pivot (if Cancel On Break is enabled).
Behavior : Enters conservatively and exits quickly to minimize risk.
💎Confident/Mixed:
Exit : Stop-loss at the previous pivot high point; take-profit at risk-reward ratio. Canceled if price breaks above the pivot.
Behavior : Uses the late exit point to hold longer.
🎲 Usage Instructions
🎯Add to Chart:
Add the Divergence Strategy to your TradingView chart.
The oscillator and divergence signals appear in a separate pane, with trade levels (target/stop boxes) overlaid on the price chart.
🎯Configure Settings:
Adjust trade settings (direction, divergence type, entry type, risk-reward, market orders, cancel on break).
Modify inherited Divergence Screener settings (oscillator, trend method, zigzag length) as needed.
Enable/disable alerts for divergence notifications.
🎯Interpret Signals:
Long Trades: Triggered on bullish or bullish hidden divergences (if allowed), shown with green/lime lines and labels.
Short Trades: Triggered on bearish or bearish hidden divergences (if allowed), shown with red/orange lines and labels.
Monitor lime (target) and orange (stop) boxes for trade levels.
Review strategy performance metrics (e.g., profit/loss, win rate) in the strategy tester.
🎯Backtest and Optimize:
Use TradingView’s strategy tester to evaluate performance on historical data.
Fine-tune risk-reward, entry type, position sizing, and cancellation settings to suit your market and timeframe.
For questions, suggestions, or support, contact Trendoscope via TradingView or official support channels. Stay tuned for updates and enhancements to the Divergence Strategy!

Simple DCA Strategy----
### 📌 **Simple DCA Strategy with Backtest Date Filter**
This strategy implements a **Dollar-Cost Averaging (DCA)** approach for long positions, including:
* ✅ **Base Order Entry:** Starts a position with a fixed dollar amount when no position is open.
* 🔁 **Safety Orders:** Buys additional positions when the price drops by a defined percentage, increasing position size with each new entry using a multiplier.
* 🎯 **Take Profit Exit:** Closes all positions when the price reaches a profit target (in % above average entry).
* 🗓️ **Backtest Date Range:** Allows users to specify a custom start and optional end date to run the strategy only within that time window.
* 📊 **Plots:** Visualizes average entry, take profit level, and safety order trigger line.
#### ⚙️ Customizable Inputs:
* Base Order Size (\$)
* Price Deviation for Safety Orders (%)
* Maximum Safety Orders
* Order Size Multiplier
* Take Profit Target (%)
* Start and End Dates for Backtesting
This is a **long-only strategy** and is best used for backtesting performance of DCA-style accumulation under different market conditions.
----

OBV ATR Strategy (OBV Breakout Channel) bas20230503ผมแก้ไขจาก OBV+SMA อันเดิม ของเดิม ดูที่เส้น SMA สองเส้นตัดกันมั่นห่วยแตกสำหรับที่ผมลองเทรดจริง และหลักการเบรค ได้แรงบันดาลใจ ATR จาก เทพคอย ที่ใช้กับราคา แต่นี้ใช้กับ OBV แทน
และผมใช้เจมินี้ เพื่อแก้ ให้ เป็น strategy เพื่อเช็คย้อนหลังได้ง่ายกว่าเดิม
หลักการง่ายคือถ้ามันขึ้น มันจะขึ้นเรื่อยๆ
เขียน แบบสุภาพ (น่าจะอ่านได้ง่ายกว่าผมเขียน)
สคริปต์นี้ได้รับการพัฒนาต่อยอดจากแนวคิด OBV+SMA Crossover แบบดั้งเดิม ซึ่งจากการทดสอบส่วนตัวพบว่าประสิทธิภาพยังไม่น่าพอใจ กลยุทธ์ใหม่นี้จึงเปลี่ยนมาใช้หลักการ "Breakout" ซึ่งได้รับแรงบันดาลใจมาจากการใช้ ATR สร้างกรอบของราคา แต่เราได้นำมาประยุกต์ใช้กับ On-Balance Volume (OBV) แทน นอกจากนี้ สคริปต์ได้ถูกแปลงเป็น Strategy เต็มรูปแบบ (โดยความช่วยเหลือจาก Gemini AI) เพื่อให้สามารถทดสอบย้อนหลัง (Backtest) และประเมินประสิทธิภาพได้อย่างแม่นยำ
หลักการของกลยุทธ์: กลยุทธ์นี้ทำงานบนแนวคิดโมเมนตัมที่ว่า "เมื่อแนวโน้มได้เกิดขึ้นแล้ว มีโอกาสที่มันจะดำเนินต่อไป" โดยจะมองหาการทะลุของพลังซื้อ-ขาย (OBV) ที่แข็งแกร่งเป็นพิเศษเป็นสัญญาณเข้าเทร
----
สคริปต์นี้เป็นกลยุทธ์ (Strategy) ที่ใช้ On-Balance Volume (OBV) ซึ่งเป็นอินดิเคเตอร์ที่วัดแรงซื้อและแรงขายสะสม แทนที่จะใช้การตัดกันของเส้นค่าเฉลี่ย (SMA Crossover) ที่เป็นแบบพื้นฐาน กลยุทธ์นี้จะมองหาการ "ทะลุ" (Breakout) ของพลัง OBV ออกจากกรอบสูงสุด-ต่ำสุดของตัวเองในรอบที่ผ่านมา
สัญญาณกระทิง (Bull Signal): เกิดขึ้นเมื่อพลังการซื้อ (OBV) แข็งแกร่งจนสามารถทะลุจุดสูงสุดของตัวเองในอดีตได้ บ่งบอกถึงโอกาสที่แนวโน้มจะเปลี่ยนเป็นขาขึ้น
สัญญาณหมี (Bear Signal): เกิดขึ้นเมื่อพลังการขาย (OBV) รุนแรงจนสามารถกดดันให้ OBV ทะลุจุดต่ำสุดของตัวเองในอดีตได้ บ่งบอกถึงโอกาสที่แนวโน้มจะเปลี่ยนเป็นขาลง
ส่วนประกอบบนกราฟ (Indicator Components)
เส้น OBV
เส้นหลัก ที่เปลี่ยนเขียวเป็นแดง เป็นทั้งแนวรับและแนวต้าน และ จุด stop loss
เส้นนี้คือหัวใจของอินดิเคเตอร์ ที่แสดงถึงพลังสะสมของ Volume
เมื่อเส้นเป็นสีเขียว (แนวรับ): จะปรากฏขึ้นเมื่อกลยุทธ์เข้าสู่ "โหมดกระทิง" เส้นนี้คือระดับต่ำสุดของ OBV ในอดีต และทำหน้าที่เป็นแนวรับไดนามิก
เมื่อเส้นกลายเป็นสีแดงสีแดง (แนวต้าน): จะปรากฏขึ้นเมื่อกลยุทธ์เข้าสู่ "โหมดหมี" เส้นนี้คือระดับสูงสุดของ OBV ในอดีต และทำหน้าที่เป็นแนวต้านไดนามิก
สัญลักษณ์สัญญาณ (Signal Markers):
Bull 🔼 (สามเหลี่ยมขึ้นสีเขียว): คือสัญญาณ "เข้าซื้อ" (Long) จะปรากฏขึ้น ณ จุดที่ OBV ทะลุขึ้นไปเหนือกรอบด้านบนเป็นครั้งแรก
Bear 🔽 (สามเหลี่ยมลงสีแดง): คือสัญญาณ "เข้าขาย" (Short) จะปรากฏขึ้น ณ จุดที่ OBV ทะลุลงไปต่ำกว่ากรอบด้านล่างเป็นครั้งแรก
วิธีการใช้งาน (How to Use)
เพิ่มสคริปต์นี้ลงบนกราฟราคาที่คุณสนใจ
ไปที่แท็บ "Strategy Tester" ด้านล่างของ TradingView เพื่อดูผลการทดสอบย้อนหลัง (Backtest) ของกลยุทธ์บนสินทรัพย์และไทม์เฟรมต่างๆ
ใช้สัญลักษณ์ "Bull" และ "Bear" เป็นตัวช่วยในการตัดสินใจเข้าเทรด
ข้อควรจำ: ไม่มีกลยุทธ์ใดที่สมบูรณ์แบบ 100% ควรใช้สคริปต์นี้ร่วมกับการวิเคราะห์ปัจจัยอื่นๆ เช่น โครงสร้างราคา, แนวรับ-แนวต้านของราคา และการบริหารความเสี่ยง (Risk Management) ของตัวคุณเองเสมอ
การตั้งค่า (Inputs)
SMA Length 1 / SMA Length 2: ใช้สำหรับพล็อตเส้นค่าเฉลี่ยของ OBV เพื่อดูเป็นภาพอ้างอิง ไม่มีผลต่อตรรกะการเข้า-ออกของ Strategy อันใหม่ แต่มันเป็นของเก่า ถ้าชอบ ก็ใช้ได้ เมื่อ SMA สองเส้นตัดกัน หรือตัดกับเส้น OBV
High/Low Lookback Length: (ค่าพื้นฐาน30/แก้ตรงนี้ให้เหมาะสมกับ coin หรือหุ้น ตามความผันผวน ) คือระยะเวลาที่ใช้ในการคำนวณกรอบสูงสุด-ต่ำสุดของ OBV
ค่าน้อย: ทำให้กรอบแคบลง สัญญาณจะเกิดไวและบ่อยขึ้น แต่อาจมีสัญญาณหลอก (False Signal) เยอะขึ้น
ค่ามาก: ทำให้กรอบกว้างขึ้น สัญญาณจะเกิดช้าลงและน้อยลง แต่มีแนวโน้มที่จะเป็นสัญญาณที่แข็งแกร่งกว่า
แน่นอนครับ นี่คือคำแปลฉบับภาษาอังกฤษที่สรุปใจความสำคัญ กระชับ และสุภาพ เหมาะสำหรับนำไปใช้ในคำอธิบายสคริปต์ (Description) ของ TradingView ครับ
---Translate to English---
OBV Breakout Channel Strategy
This script is an evolution of a traditional OBV+SMA Crossover concept. Through personal testing, the original crossover method was found to have unsatisfactory performance. This new strategy, therefore, uses a "Breakout" principle. The inspiration comes from using ATR to create price channels, but this concept has been adapted and applied to On-Balance Volume (OBV) instead.
Furthermore, the script has been converted into a full Strategy (with assistance from Gemini AI) to enable precise backtesting and performance evaluation.
The strategy's core principle is momentum-based: "once a trend is established, it is likely to continue." It seeks to enter trades on exceptionally strong breakouts of buying or selling pressure as measured by OBV.
Core Concept
This is a Strategy that uses On-Balance Volume (OBV), an indicator that measures cumulative buying and selling pressure. Instead of relying on a basic Simple Moving Average (SMA) Crossover, this strategy identifies a "Breakout" of the OBV from its own highest-high and lowest-low channel over a recent period.
Bull Signal: Occurs when the buying pressure (OBV) is strong enough to break above its own recent highest high, indicating a potential shift to an upward trend.
Bear Signal: Occurs when the selling pressure (OBV) is intense enough to push the OBV below its own recent lowest low, indicating a potential shift to a downward trend.
On-Screen Components
1. OBV Line
This is the main indicator line, representing the cumulative volume. Its color changes to green when OBV is rising and red when it is falling.
2. Dynamic Support & Resistance Line
This is the thick Green or Red line that appears based on the strategy's current "mode." This line serves as a dynamic support/resistance level and can be used as a reference for stop-loss placement.
Green Line (Support): Appears when the strategy enters "Bull Mode." This line represents the lowest low of the OBV in the recent past and acts as dynamic support.
Red Line (Resistance): Appears when the strategy enters "Bear Mode." This line represents the highest high of the OBV in the recent past and acts as dynamic resistance.
3. Signal Markers
Bull 🔼 (Green Up Triangle): This is the "Long Entry" signal. It appears at the moment the OBV first breaks out above its high-low channel.
Bear 🔽 (Red Down Triangle): This is the "Short Entry" signal. It appears at the moment the OBV first breaks down below its high-low channel.
How to Use
Add this script to the price chart of your choice.
Navigate to the "Strategy Tester" panel at the bottom of TradingView to view the backtesting results for the strategy on different assets and timeframes.
Use the "Bull" and "Bear" signals as aids in your trading decisions.
Disclaimer: No strategy is 100% perfect. This script should always be used in conjunction with other forms of analysis, such as price structure, key price-based support/resistance levels, and your own personal risk management rules.
Inputs
SMA Length 1 / SMA Length 2: These are used to plot moving averages on the OBV for visual reference. They are part of the legacy logic and do not affect the new breakout strategy. However, they are kept for traders who may wish to observe their crossovers for additional confirmation.
High/Low Lookback Length: (Most Important Setting) This determines the period used to calculate the highest-high and lowest-low OBV channel. (Default is 30; adjust this to suit the asset's volatility).
A smaller value: Creates a narrower channel, leading to more frequent and faster signals, but potentially more false signals.
A larger value: Creates a wider channel, leading to fewer and slower signals, which are likely to be more significant.

[Mustang Algo] Channel Strategy# Mustang Algo Channel Strategy - Universal Market Sentiment Oscillator
## 🎯 ORIGINAL CONCEPT
This strategy employs a unique market sentiment oscillator that works on ALL financial assets. It uses Bitcoin supply dynamics combined with stablecoin market capitalization as a macro sentiment indicator to generate universal timing signals across stocks, forex, commodities, indices, and cryptocurrencies.
## 🌐 UNIVERSAL APPLICATION
- **Any Asset Class:** Stocks, Forex, Commodities, Indices, Crypto, Bonds
- **Market-Wide Timing:** BTC/Stablecoin ratio serves as a global risk sentiment gauge
- **Cross-Market Signals:** Trade any instrument using macro liquidity conditions
- **Ecosystem Approach:** One oscillator for all financial markets
## 🧮 METHODOLOGY
**Core Calculation:** BTC Supply / (Combined Stablecoin Market Cap / BTC Price)
- **Data Sources:** DAI + USDT + USDC market capitalizations
- **Signal Generation:** RSI(14) applied to the ratio, double-smoothed with WMA
- **Timing Logic:** Crossover signals filtered by overbought/oversold zones
- **Multi-Timeframe:** Configurable timeframe analysis (default: Daily)
## 📈 TRADING STRATEGY
**LONG Entries:** Bullish crossover when market sentiment is oversold (<48)
**SHORT Entries:** Bearish crossover when market sentiment is overbought (>55)
**Universal Timing:** These macro signals apply to trading any financial instrument
## ⚙️ FLEXIBLE RISK MANAGEMENT
**Three SL/TP Calculation Modes:**
- **Percentage Mode:** Traditional % based (4% SL, 12% TP default)
- **Ticks Mode:** Precise tick-based calculation (50/150 ticks default)
- **Pips Mode:** Forex-style pip calculation (50/150 pips default)
**Realistic Parameters:**
- Commission: 0.1% (adjustable for different asset classes)
- Slippage: 2 ticks
- Position sizing: 10% of equity (conservative)
- No pyramiding (single position management)
## 📊 KEY ADVANTAGES
✅ **Universal Application:** One strategy for all asset classes
✅ **Macro Foundation:** Based on global liquidity and risk sentiment
✅ **False Signal Filtering:** Overbought/oversold zones reduce noise
✅ **Flexible Risk Management:** Multiple SL/TP calculation methods
✅ **No Lookahead Bias:** Clean backtesting with realistic results
✅ **Cross-Market Correlation:** Captures broad market risk cycles
## 🎛️ CONFIGURATION GUIDE
1. **Asset Selection:** Apply to stocks, forex, commodities, indices, crypto
2. **Timeframe Setup:** Daily recommended for swing trading
3. **Sentiment Bounds:** Adjust 48/55 levels based on market volatility
4. **Risk Management:** Choose appropriate SL/TP mode for your asset class
5. **Direction Filter:** Select Long Only, Short Only, or Both
## 📋 BACKTESTING STANDARDS
**Compliant with TradingView Guidelines:**
- ✅ Realistic commission structure (0.1% default)
- ✅ Appropriate slippage modeling (2 ticks)
- ✅ Conservative position sizing (10% equity)
- ✅ Sustainable risk ratios (1:3 SL/TP)
- ✅ No lookahead bias (proper historical simulation)
- ✅ Sufficient sample size potential (100+ trades possible)
## 🔬 ORIGINAL RESEARCH
This strategy introduces a revolutionary approach to financial markets by treating the BTC/Stablecoin ratio as a global risk sentiment gauge. Unlike traditional indicators that analyze individual asset price action, this oscillator captures macro liquidity flows that affect ALL financial markets - from stocks to forex to commodities.
## 🎯 MARKET APPLICATIONS
**Stocks & Indices:** Risk-on/risk-off sentiment timing
**Forex:** Global liquidity flow analysis for major pairs
**Commodities:** Risk appetite for inflation hedges
**Bonds:** Flight-to-safety vs. risk-seeking behavior
**Crypto:** Native application with direct correlation
## ⚠️ RISK DISCLOSURE
- Designed for intermediate to long-term trading across all timeframes
- Market sentiment can remain extreme longer than expected
- Always use appropriate position sizing for your specific asset class
- Adjust commission and slippage settings for different markets
- Past performance does not guarantee future results
## 🚀 INNOVATION SUMMARY
**What makes this strategy unique:**
- First to use BTC/Stablecoin ratio as universal market sentiment indicator
- Applies macro-economic principles to technical analysis across all assets
- Single oscillator provides timing signals for entire financial ecosystem
- Bridges traditional finance with digital asset insights
- Combines fundamental liquidity analysis with technical precision
