Forex levrage 1 minOk this is more complex code the scanner system that why I protected it so folks will not abuse it . this system have no repaint as no security attach to mtf
the problem with the scanner system
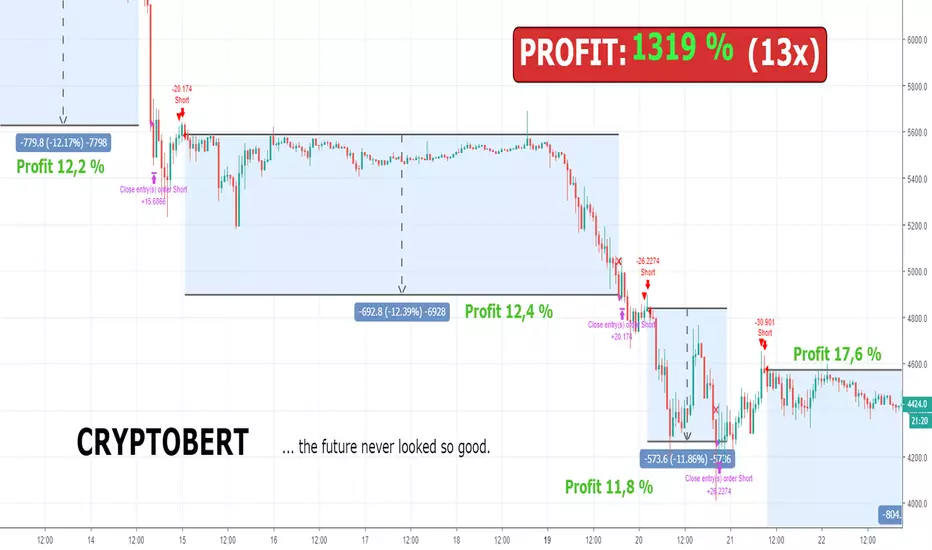
that it only long system ,if you stuck in a loop you cannot get out of it unless a new win trade will start. this can be catastrophe if we use leverage system as it will destroy our all account. in the scanner system one can use stop loss but it will reduce profit very much.so that will be the exit . and there is no way for short. in this system which is based on the scanner system you do short. you can still use stop loss or exit by short
so since forex go by pairs. if the strategy of long does not work then flip sides for the longs neaning oposite coin. or short it.
this sytem allow you to use leverge and see by test how to calculate your best way to enter a levrage .
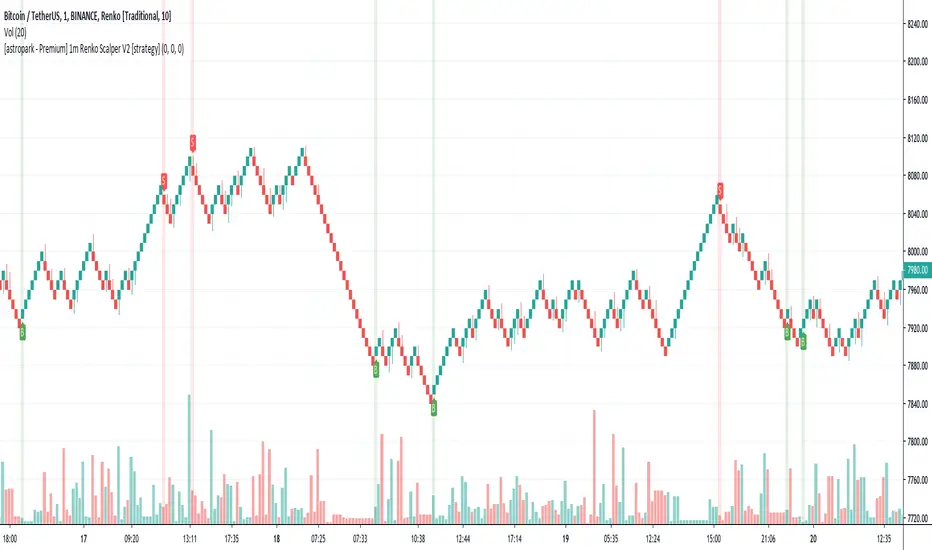
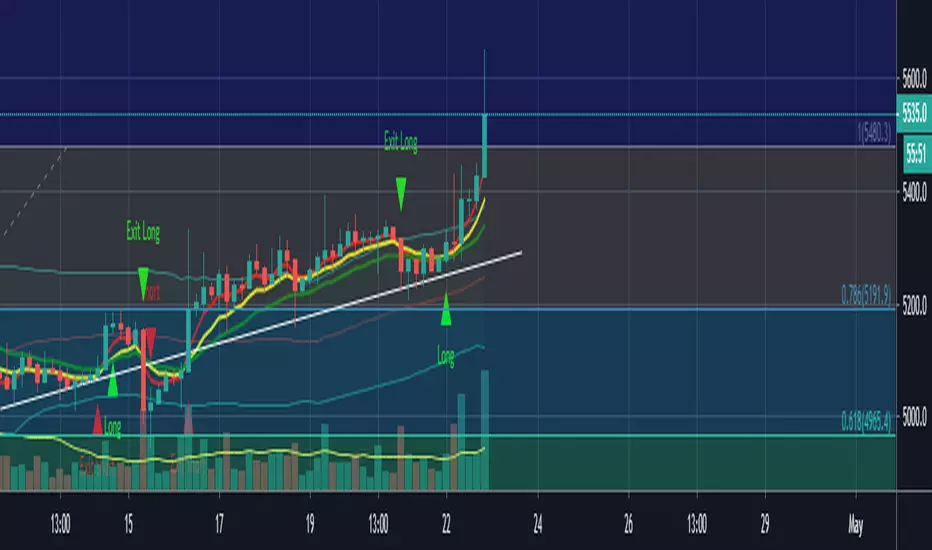
since it 1 min I set it to take profit as 0.2,0,0.4 0.5 and 0.7 . and to take 25% each time .
if you are familar with scanner system then it will easy to navigate with this one as well
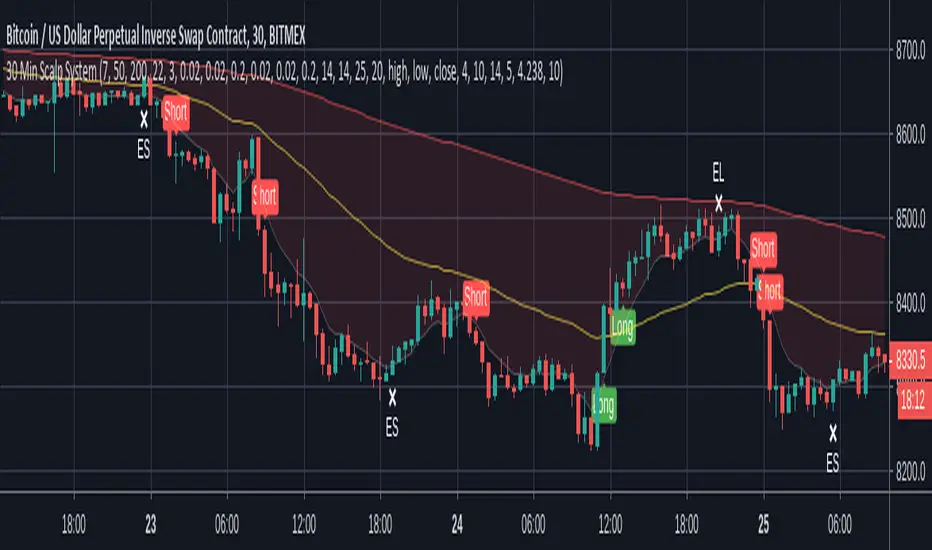
the exit system you can see min time. HTF and candle time. the HTF is on the frame that we use . try to play either with minute time or candle time to get better results this sytem great for coins that are going up. so beaware of this issue
if you have questions please let me know
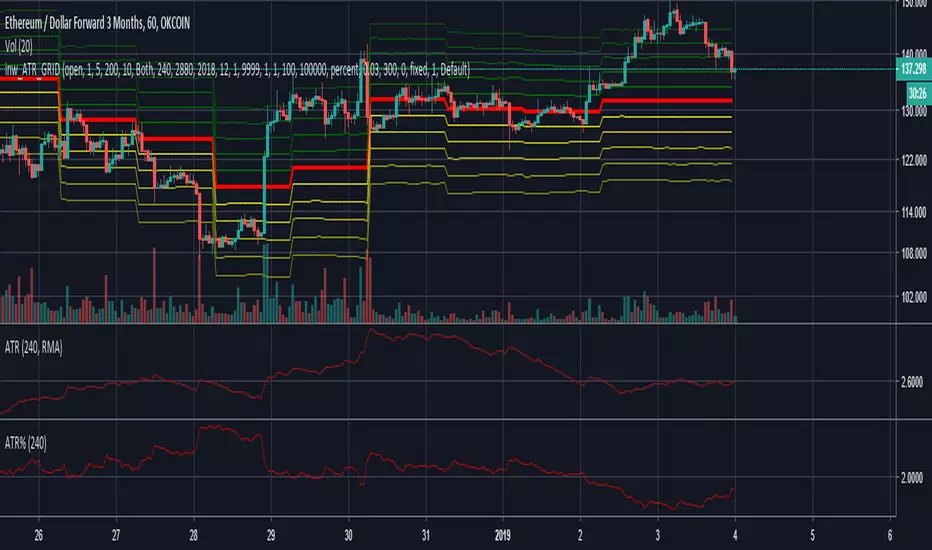
the levrage is set to 100% of your lot at 1 X
in real life I use 10% of my lot and then i put any leverage that i want depend on the strategy that I use
so be aware of this fact
this system buy and sell in avreage 800-1500 min cycle so about a day or so to get our profit out of it.
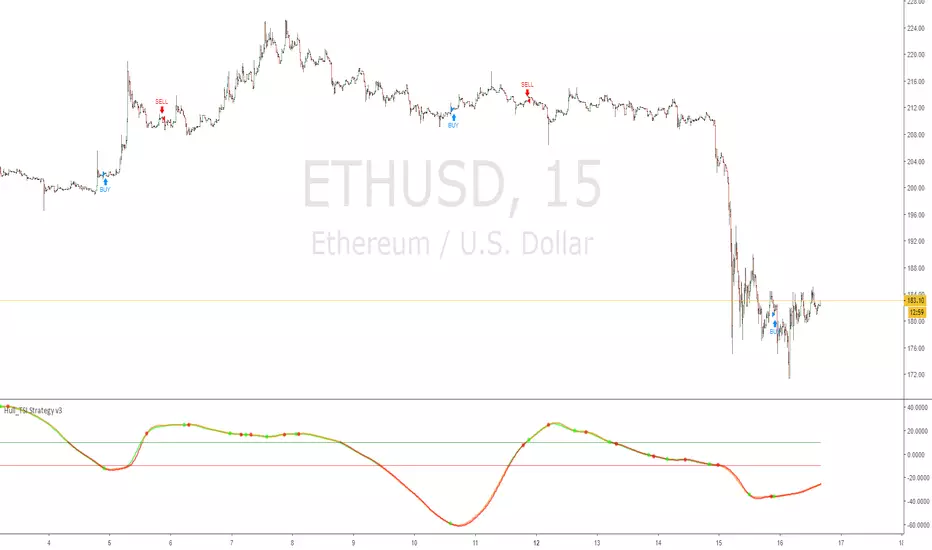
you can use it as advisor not as bot and then you decide by your self where the best exit need to be.
take this sytem only as helper for your forex trades
there is no subsitution for common sense..that a bot can never give you. so be carfull with the money that you risk
Стратегия Pine Script®