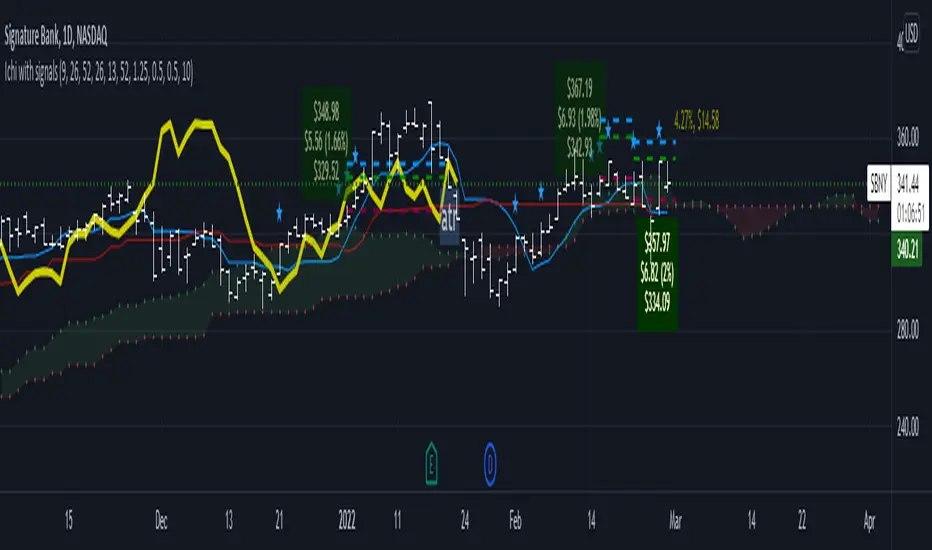
EBB & Flow: a multi-EMA-based BB cloudIntro
This is an idea evolved out of the market maker method and EMA convergence, divergence, and mean reversion.
The market maker method informs us that the 5, 13, 50 and 200 EMAs are important to regulating price. Those EMA lengths are multiples of the 50 and 200 on lower major timeframes -- the 1 minute, 5, 15, 1H, 4H, 1D. I include the 21 because it is also a multiple and in crypto very often respected.
When market makers are testing price, they set their range and spike in the direction they test for liquidity. This can get chaotic. For instance, in a shorter time frame consolidation inside a bigger timeframe uptrend, it can be too easy to forget where you are in the many trends playing out.
When the EMAs are dragged over each other during normal price movement, you get these crisscrossing tracks of price, and the individual breaks can be hard to trace.
The range is what matters, ultimately, and the range is dynamic. In that case, the Bollinger Band is a great tool for detecting outliers in this case.
The Answer
So the answer this indicator seeks to give, is to look for outliers. This gives you a scalping strategy built on Traders Reality thinking and best put together with the PVSRA indicator, which I may include in this indicator just for the sake of concision, but they can work alongside each other or separately.
The key thing is the different EMA clouds, which are bollinger bands. Tight bands mean imminent breaks, favouring the trend. Vector candles out of a zone, pins to the low/high, etc. are all very relevant alongside this indicator.
You can also use it on its own and scalp the breaks of a cloud.
How it works
Each cloud is a standard deviation from their respective EMA, all in the same colour. The deviation multiple is 1.618 by default. Yes, fibonacci sequences are usually nonsense, but it works better with the BB than 2, 2.5 or 3.
Using just the clouds, you can see where each EMA is headed and how it behaves within the deviation of the others.
But that on its own isn't enough.
The indicator will also print snowflakes above and below the candle for notable outliers. It will be in the colour of the cloud it breaks, but only if that break is also breaking the smaller EMA clouds too.
The most snowflakes will be yellow because that's the 13 EMA. That one is dependent on nothing else and every break will print a snowflake. The 21 will be dependent on the 13. The 50 dependent on the 13 and 21 breaks. The 200 the most important.
For example, if the 200 EMA-BB or EBB is broken at the upper band, deviating by more than 162% of price over a 200 period EMA, and that break is not above the 50 EMA cloud, there will be no snowflake. However, if it exceeds the 13, 21, 50, and 200 clouds, then a purple snowflake will appear above the bar.
Any snowflake is an extreme in price. The purple is an especially good point of entry. That doesn't mean it is a perfect entry. You can build position from it, though, and be relatively certain of a price correction in the near future, because not only was this major EMA cloud violated, but all of the smaller ones too.
Reminder
You still need your PVSRA and candlesticks. This indicator on its own may have a nice hit rate for scalping and building position, as an alternative to the TDI or alongside it, but it is not enough on its own, just like the TDI.
Enjoy!
Поиск скриптов по запросу "entry"
ScalpyScalpy is made up of a 2 main parts.
- The cloud comprising of a 10 period SMA and a 30 period SMA.
- When the cloud is green you should be looking for long entries.
- When the cloud is red you should be looking for short entries.
- Price is most bullish above a green cloud and most bearish below a red cloud.
- Being within the cloud indicates indecision.
The blue and white lines on the indicator show the relationship between price and momentum.
They can be used to spot reversals in two ways:
- The first is a divergence between price (blue line) and RSI (white line)
- If the price makes a lower low but the RSI makes a higher low this shows the trend is weakening and may be reversing soon (as can be seen by the two yellow lines on the chart).
The second is a simple crossover:
- When the white line crosses the blue line to the upside this signals a long entry.
- When the white line crosses the blue line to the downside this signals a short entry.
Hoffman A/D BreakoutStudy based on Rob Hoffman's Accumulation/Distribution Breakout strategy.
- Green circle on the top wick indicates a "Distribution" wick
- Red circle on the bottom wick indicates an "Accumulation" wick
- A distribution wick in an uptrend gets marked as a Key Resistance. This is marked with green crosses
- An Accumulation wick in a downtrend gets marked as a Key Support. This is marked with red crosses
- Breaking above the Key Resistance indicates a buy entry. This is marked by a green background.
- Breaking below the Key Support indicates a sell entry. This is marked by a red background
chart Pattern & Candle sticks Strategy# **XAUUSD Pattern & Candle Strategy - Complete Description**
## **Overview**
This Pine Script indicator is a comprehensive multi-factor trading system specifically designed for **XAUUSD (Gold) scalping and swing trading**. It combines classical technical analysis methods including candlestick patterns, chart patterns, moving averages, and volume analysis to generate high-probability buy/sell signals with automatic stop-loss and take-profit levels.
***
## **Core Components**
### **1. Moving Average System (Triple MA)**
**Purpose:** Identifies trend direction and momentum
- **Fast MA (20-period)** - Short-term price action
- **Medium MA (50-period)** - Intermediate trend
- **Slow MA (200-period)** - Long-term trend direction
**How it works:**
- **Bullish alignment**: MA20 > MA50 > MA200 (all pointing up)
- **Bearish alignment**: MA20 < MA50 < MA200 (all pointing down)
- **Crossover signals**: When Fast MA crosses Medium MA, it triggers buy/sell signals
- **Choice of SMA or EMA**: Adjustable based on preference
**Visual indicators:**
- Blue line = Fast MA
- Orange line = Medium MA
- Light red line = Slow MA
- Green background tint = Bullish trend
- Red background tint = Bearish trend
---
### **2. Candlestick Pattern Recognition (13 Patterns)**
**Purpose:** Identifies reversal and continuation signals based on price action
#### **Bullish Patterns (Signal potential upward moves):**
1. **Hammer** 🔨
- Long lower wick (2x body size)
- Small body at top
- Indicates rejection of lower prices (buyers stepping in)
- Best at support levels
2. **Inverted Hammer**
- Long upper wick
- Small body at bottom
- Shows buying pressure despite initial selling
3. **Bullish Engulfing** 📈
- Green candle completely engulfs previous red candle
- Strong reversal signal
- Body must be 1.2x larger than previous
4. **Morning Star** ⭐
- 3-candle pattern
- Red candle → Small indecision candle → Large green candle
- Powerful reversal at bottoms
5. **Piercing Line** ⚡
- Green candle closes above 50% of previous red candle
- Indicates strong buying interest
6. **Bullish Marubozu**
- Almost no wicks (95% body)
- Very strong bullish momentum
- Body must be 1.3x average size
#### **Bearish Patterns (Signal potential downward moves):**
7. **Shooting Star** 💫
- Long upper wick
- Small body at bottom
- Indicates rejection of higher prices (sellers in control)
- Best at resistance levels
8. **Hanging Man**
- Similar to hammer but appears at top
- Warning of potential reversal down
9. **Bearish Engulfing** 📉
- Red candle completely engulfs previous green candle
- Strong reversal signal
10. **Evening Star** 🌙
- 3-candle pattern (opposite of Morning Star)
- Green → Small → Large red candle
- Powerful top reversal
11. **Dark Cloud Cover** ☁️
- Red candle closes below 50% of previous green candle
- Indicates strong selling pressure
12. **Bearish Marubozu**
- Almost no wicks, pure red body
- Very strong bearish momentum
#### **Neutral Pattern:**
13. **Doji**
- Open and close nearly equal (tiny body)
- Indicates indecision
- Often precedes major moves
**Detection Logic:**
- Compares body size, wick ratios, and position relative to previous candles
- Uses 14-period average body size as reference
- All patterns validated against volume confirmation
***
### **3. Chart Pattern Recognition**
**Purpose:** Identifies major support/resistance and reversal patterns
#### **Patterns Detected:**
**Double Bottom** 📊 (Bullish)
- Two lows at approximately same level
- Indicates strong support
- Breakout above neckline triggers buy signal
- Most reliable at major support zones
**Double Top** 📊 (Bearish)
- Two highs at approximately same level
- Indicates strong resistance
- Breakdown below neckline triggers sell signal
- Most reliable at major resistance zones
**Support & Resistance Levels**
- Automatically plots recent pivot highs (resistance)
- Automatically plots recent pivot lows (support)
- Uses 3-bar strength for validation
- Levels shown as dashed horizontal lines
**Price Action Patterns**
- **Uptrend detection**: Higher highs + higher lows
- **Downtrend detection**: Lower highs + lower lows
- Confirms overall market structure
***
### **4. Volume Analysis**
**Purpose:** Confirms signal strength and filters false signals
**Metrics tracked:**
- **Volume MA (20-period)**: Baseline average volume
- **High volume threshold**: 1.5x the volume average
- **Volume increase**: Current volume > previous 2 bars
**How it's used:**
- All buy/sell signals **require volume confirmation**
- High volume = institutional participation
- Low volume signals are filtered out
- Prevents whipsaw trades during quiet periods
**Visual indicator:**
- Dashboard shows "High" volume in orange when active
- "Normal" shown in gray during low volume
***
### **5. Signal Generation Logic**
**BUY SIGNALS triggered when ANY of these occur:**
1. **Candlestick + Volume**
- Bullish candle pattern detected
- High volume confirmation
- Price above Fast MA
2. **MA Crossover + Volume**
- Fast MA crosses above Medium MA
- High volume confirmation
3. **Double Bottom Breakout**
- Price breaks above support level
- Volume confirmation present
4. **Trend Continuation**
- Uptrend structure intact (higher highs/lows)
- All MAs in bullish alignment
- Price above Fast MA
- Volume confirmation
**SELL SIGNALS triggered when ANY of these occur:**
1. **Candlestick + Volume**
- Bearish candle pattern detected
- High volume confirmation
- Price below Fast MA
2. **MA Crossunder + Volume**
- Fast MA crosses below Medium MA
- High volume confirmation
3. **Double Top Breakdown**
- Price breaks below resistance level
- Volume confirmation present
4. **Trend Continuation**
- Downtrend structure intact (lower highs/lows)
- All MAs in bearish alignment
- Price below Fast MA
- Volume confirmation
***
### **6. Risk Management System**
**Automatic Stop Loss Calculation:**
- Based on ATR (Average True Range) - 14 periods
- **Formula**: Entry price ± (ATR × SL Multiplier)
- **Default multiplier**: 1.5 (adjustable)
- Adapts to market volatility automatically
**Automatic Take Profit Calculation:**
- **Formula**: Entry price ± (ATR × TP Multiplier)
- **Default multiplier**: 2.5 (adjustable)
- **Default Risk:Reward ratio**: 1:1.67
- Higher TP multiplier = more aggressive targets
**Position Management:**
- Tracks ONE position at a time (no pyramiding)
- Automatically closes position when:
- Stop loss is hit
- Take profit is reached
- Opposite MA crossover occurs
- Prevents revenge trading and over-leveraging
**Visual Representation:**
- **Red horizontal line** = Stop Loss level
- **Green horizontal line** = Take Profit level
- Lines remain on chart while position is active
- Automatically disappear when position closes
***
### **7. Visual Elements**
**On-Chart Displays:**
1. **Moving Average Lines**
- Fast MA (Blue, thick)
- Medium MA (Orange, thick)
- Slow MA (Red, thin)
2. **Support/Resistance**
- Green crosses = Support levels
- Red crosses = Resistance levels
3. **Buy/Sell Arrows**
- Large GREEN "BUY" label below bars
- Large RED "SELL" label above bars
4. **Pattern Labels** (Small markers)
- "Hammer", "Bull Engulf", "Morning Star" (green, below bars)
- "Shooting Star", "Bear Engulf", "Evening Star" (red, above bars)
- "Double Bottom" / "Double Top" (blue/orange)
5. **Signal Detail Labels** (Medium size)
- Shows signal reason (e.g., "Bullish Candle", "MA Cross Up")
- Displays Entry, SL, and TP prices
- Color-coded (green for long, red for short)
6. **Background Coloring**
- Light green tint = Bullish MA alignment
- Light red tint = Bearish MA alignment
***
### **8. Information Dashboard**
**Top-right corner table showing:**
| Metric | Description |
|--------|-------------|
| **Position** | Current trade status (LONG/SHORT/None) |
| **MA Trend** | Overall trend direction (Bullish/Bearish/Neutral) |
| **Volume** | Current volume status (High/Normal) |
| **Pattern** | Last detected candlestick pattern |
| **ATR** | Current volatility measurement |
**Purpose:**
- Quick at-a-glance market assessment
- Real-time position tracking
- No need to check multiple indicators
***
### **9. Alert System**
**Complete alert coverage for:**
✅ **Entry Alerts**
- "Buy Signal" - Triggers when buy conditions met
- "Sell Signal" - Triggers when sell conditions met
✅ **Exit Alerts**
- "Long TP Hit" - Take profit reached on long position
- "Long SL Hit" - Stop loss triggered on long position
- "Short TP Hit" - Take profit reached on short position
- "Short SL Hit" - Stop loss triggered on short position
**How to use:**
1. Click "Create Alert" button
2. Select desired alert from dropdown
3. Set notification method (popup, email, SMS, webhook)
4. Never miss a trade opportunity
***
## **Recommended Settings**
### **For Scalping (Quick trades):**
- **Timeframe**: 5-minute
- **Fast MA**: 9
- **Medium MA**: 21
- **Slow MA**: 50
- **SL Multiplier**: 1.0
- **TP Multiplier**: 2.0
- **Volume Threshold**: 1.5x
### **For Swing Trading (Longer holds):**
- **Timeframe**: 1-hour or 4-hour
- **Fast MA**: 20
- **Medium MA**: 50
- **Slow MA**: 200
- **SL Multiplier**: 2.0
- **TP Multiplier**: 3.0
- **Volume Threshold**: 1.3x
### **Best Trading Hours for XAUUSD:**
- **Asian Session**: 00:00 - 08:00 GMT (lower volatility)
- **London Session**: 08:00 - 16:00 GMT (high volatility) ⭐
- **New York Session**: 13:00 - 21:00 GMT (highest volume) ⭐
- **London-NY Overlap**: 13:00 - 16:00 GMT (BEST for scalping) 🔥
***
## **How to Use This Strategy**
### **Step 1: Setup**
1. Open TradingView
2. Load XAUUSD chart
3. Select timeframe (5m, 15m, 1H, or 4H)
4. Add indicator from Pine Editor
5. Adjust settings based on your trading style
### **Step 2: Wait for Signals**
- Watch for GREEN "BUY" or RED "SELL" labels
- Check the signal reason in the detail label
- Verify dashboard shows favorable conditions
- Confirm volume is "High" (not required but preferred)
### **Step 3: Enter Trade**
- Enter at market or limit order near signal price
- Note the displayed Entry, SL, and TP prices
- Set your broker's SL/TP to match indicator levels
### **Step 4: Manage Position**
- Watch for SL/TP lines on chart
- Monitor dashboard for trend changes
- Exit manually if opposite MA crossover occurs
- Let SL/TP do their job (don't move them!)
### **Step 5: Review & Learn**
- Track win rate over 20+ trades
- Adjust multipliers if needed
- Note which patterns work best for you
- Refine entry timing
***
## **Key Advantages**
✅ **Multi-confirmation approach** - Reduces false signals significantly
✅ **Automatic risk management** - No manual calculation needed
✅ **Adapts to volatility** - ATR-based SL/TP adjusts to market conditions
✅ **Volume filtered** - Ensures institutional participation
✅ **Visual clarity** - Easy to understand at a glance
✅ **Complete alert system** - Never miss opportunities
✅ **Pattern education** - Learn patterns as they appear
✅ **Works on all timeframes** - Scalping to swing trading
***
## **Limitations & Considerations**
⚠️ **Not a holy grail** - No strategy wins 100% of trades
⚠️ **Requires practice** - Demo trade first to understand signals
⚠️ **Market conditions matter** - Works best in trending or volatile markets
⚠️ **News events** - Avoid trading during major economic releases
⚠️ **Slippage on 5m** - Fast markets may have execution delays
⚠️ **Pattern subjectivity** - Some patterns may trigger differently than expected
***
## **Risk Management Rules**
1. **Never risk more than 1-2% per trade**
2. **Maximum 3 positions per day** (avoid overtrading)
3. **Don't trade during major news** (NFP, FOMC, etc.)
4. **Use proper position sizing** (0.01 lot per $100 for micro accounts)
5. **Keep trade journal** (track patterns, win rate, mistakes)
6. **Stop trading after 3 consecutive losses** (psychological reset)
7. **Don't move stop loss further away** (accept losses)
8. **Take partial profits** at 1:1 R:R if desired
***
## **Expected Performance**
**Realistic expectations:**
- **Win rate**: 50-65% (depending on market conditions and timeframe)
- **Risk:Reward**: 1:1.67 default (adjustable to 1:2 or 1:3)
- **Signals per day**: 3-8 on 5m, 1-3 on 1H
- **Best months**: High volatility periods (news events, economic uncertainty)
- **Drawdowns**: Expect 3-5 losing trades in a row occasionally
***
## **Customization Options**
All inputs are adjustable in settings panel:
**Moving Averages:**
- Type (SMA or EMA)
- All three period lengths
**Volume:**
- Volume MA length
- High volume multiplier threshold
**Chart Patterns:**
- Pattern strength (bars for pivot detection)
- Show/hide pattern labels
**Risk Management:**
- ATR period
- Stop loss multiplier
- Take profit multiplier
**Display:**
- Toggle pattern labels
- Customize colors (in code)
***
## **Conclusion**
This is a **professional-grade, multi-factor trading system** that combines the best of classical technical analysis with modern risk management. It's designed to give clear, actionable signals while automatically handling the complex calculations of stop loss and take profit levels.
**Best suited for traders who:**
- Understand basic technical analysis
- Can follow rules consistently
- Prefer systematic approach over gut feeling
- Want visual confirmation before entering trades
- Value proper risk management
**Start with demo trading** for at least 20-30 trades to understand how the signals work in different market conditions. Once comfortable and profitable on demo, transition to live trading with minimal risk per trade.
Happy trading! 📈🎯
Directional Strength and Momentum Index█ OVERVIEW
“Directional Strength and Momentum Index” (DSMI) is a technical analysis indicator inspired by DMI, but due to different source data, it produces distinct results. DSMI combines direction measurement, trend strength, and overheat levels into a single index, enhanced with gradient fills, extreme zones, entry signals, candle coloring, and a summary table.
█ CONCEPT
The classic DMI, despite its relatively simple logic, can seem somewhat chaotic due to separate +DI and -DI lines and the need for manual interpretation of their relationships. The DSMI indicator was created to increase clarity and speed up results, consolidating key information into a single index from 0 to 100 that simultaneously:
- Indicates trend direction (bullish/bearish)
- Measures movement strength
- Identifies overheat levels
- Generates ready entry signals
DMI (ADX + +DI / -DI) measures trend direction and strength, but does so based solely on comparing price movements between candles. ADX shows whether the trend is orderly and growing (e.g., above 20–30), but does not assess how dynamic the movement is.
DSMI, on the other hand, takes into account candle size and actual market aggression, thus showing directional momentum — whether the trend has real “fuel” to sustain or accelerate, not just whether it is orderly.
The main calculation difference involves replacing True Range with candle size (high-low) and using directional EMA instead of Wilder smoothing. This allows DSMI to react faster to momentum changes, eliminating delays typical of classic DMI based on TR.
This gives the trader an immediate picture of the market situation without analyzing multiple lines.
█ FEATURES
DSMI Main Line:
- EMA(Directional Index) based on +DS and -DS
- Scale 0–100, smooth color gradient depending on strength
+DS / -DS:
- Positive and Negative Directional Strength
- Gradient fill between lines — more intense with stronger trend
Extreme Zones:
- Default 20 and 80
- Gradient fill outside zones
Trend Strength Levels:
- Weak (<10) → neutral
- Moderate (up to 35)
- Strong (up to 45)
- Overheated (up to 55)
- Extreme (>55)
All levels editable
Entry Signals:
- Activated on crossing entry level (default 20)
Or on direction change when DSMI already ≥ entry level
- Highlighted background (green/red)
Candle Coloring:
- According to current trend
Trend Strength Table:
- Top-right corner
- Shows current strength (WEAK/STRONG etc.) + DSMI value
Alerts:
- DSMI Bullish Entry
- DSMI Bearish Entry
█ HOW TO USE
Add to Chart: Paste code in Pine Editor or find in indicator library.
Settings:
DSMI Parameters:
- DSMI Period → default 20
- Show DSMI Line → on/off
Extreme Zones:
- Lower Level → default 20
- Upper Level → default 80
Trend Strength Levels:
- Weak, Moderate, Strong, Overheated → adjust to strategy
Trend Colors:
- BULLISH → default green
- BEARISH → default red
- NEUTRAL → gray
Entry Signals:
- Show Highlight → on/off
- DSMI Entry Level → default 20
Signal Interpretation:
- DSMI Line: Main strength indicator.
- Gradient between +DS and -DS: Visualizes side dominance.
- Crossing 18 with direction confirmation → entry signal.
- Extreme Zones: Potential reversal or continuation points after correction.
- Table: Quick overview of current trend condition.
█ APPLICATIONS
The indicator works well in:
- Trend-following: Enter on signal, exit on direction change or overheat. When a new trend appears, consider entering a position, preferably with a rising trend strength indicator.
- Scalping/daytrading: Shorter period (7–10), lower entry level.
- Swing/position: Longer period (20–30), higher entry level, extreme zones as filters.
- Noise filtering: Ignores consolidation below “Weak” – increasing value e.g. to 15 highlights consolidation zones, but no signals appear there.
Style Adjustment:
- Aggressive strategies → shorten period and entry level
- Conservative → extend period, raise entry level (25–30), watch “Overheated”
“Weak” level (<10 default) → neutral; increasing it e.g. to 15 gives fewer but higher-quality signals. The Weak zone value controls the level below which no signals appear, and the gradient turns gray (often aligned with consolidation zones).
Combine with:
- Support/resistance levels
- Fair Value Gaps (FVG)
- Volume (Volume Profile, VWAP)
- Other oscillators (RSI, Stochastic)
█ NOTES
- Works on all markets and timeframes.
- Adjust period and levels to instrument volatility.
- Higher entry level → fewer signals, higher quality.
- Neutral color below “Weak” – avoids trading in consolidation.
- Gradient and table enable quick assessment without line analysis.
ScalpGawd Risk Reward//@version=5
indicator("ScalpGawd Risk Reward", overlay=true)
i_fromDate = input.time(timestamp("2024-02-01T00:00:00"), title="Entry Time")
i_entryPrice = input.float(4000, "Entry Price")
i_slPrice = input.float(3900, "Stop Loss Price")
i_distance = input.int(100, "Horizontal Distance (in Time Units)", group="Styling")
i_entryColor = input.color(color.white, "Entry Line", inline="Entry", group="Styling")
i_entryStyle = input.string("solid", title="", options= , inline="Entry", group="Styling")
i_entryWidth = input.int(1, "", inline="Entry", group="Styling")
i_slColor = input.color(color.red, "SL Line", inline="SL", group="Styling")
i_slStyle = input.string("solid", title="", options= , inline="SL", group="Styling")
i_slWidth = input.int(2, "", inline="SL", group="Styling")
i_tpColor = input.color(color.green, "TP Line", inline="TP", group="Styling")
i_tpStyle = input.string("solid", title="", options= , inline="TP", group="Styling")
i_tpWidth = input.int(2, "", inline="TP", group="Styling")
i_labelSize = input.string("tiny", "Label Size", options= , group="Label")
i_labelOffset = input.int(2, "Label Offset", group="Label")
i_useTP1 = input.bool(true, "1", inline="1", group="Show Take Profit")
i_useTP2 = input.bool(true, "2", inline="1", group="Show Take Profit")
i_useTP3 = input.bool(true, "3", inline="1", group="Show Take Profit")
i_useTP4 = input.bool(true, "4", inline="1", group="Show Take Profit")
i_useTP5 = input.bool(true, "5", inline="1", group="Show Take Profit")
i_useTP6 = input.bool(true, "6", inline="1", group="Show Take Profit")
i_useTP7 = input.bool(true, "7", inline="1", group="Show Take Profit")
i_useTP8 = input.bool(true, "8", inline="1", group="Show Take Profit")
i_useTP9 = input.bool(true, "9", inline="1", group="Show Take Profit")
i_useTP10 = input.bool(true, "10", inline="1", group="Show Take Profit")
var int barDistance = na
if bar_index < 2
barDistance := time - time
else
barDistance := math.min(barDistance, time - time )
int distanceInTime = barDistance * i_distance
var line entryLine = na, line.delete(entryLine)
var line stopLossLine = na, line.delete(stopLossLine)
var line tpLine1 = na, line.delete(tpLine1)
var line tpLine2 = na, line.delete(tpLine2)
var line tpLine3 = na, line.delete(tpLine3)
var line tpLine4 = na, line.delete(tpLine4)
var line tpLine5 = na, line.delete(tpLine5)
var line tpLine6 = na, line.delete(tpLine6)
var line tpLine7 = na, line.delete(tpLine7)
var line tpLine8 = na, line.delete(tpLine8)
var line tpLine9 = na, line.delete(tpLine9)
var line tpLine10 = na, line.delete(tpLine10)
var label entryLabel = na, label.delete(entryLabel)
var label slLabel = na, label.delete(slLabel)
var label tpLabel1 = na, label.delete(tpLabel1)
var label tpLabel2 = na, label.delete(tpLabel2)
var label tpLabel3 = na, label.delete(tpLabel3)
var label tpLabel4 = na, label.delete(tpLabel4)
var label tpLabel5 = na, label.delete(tpLabel5)
var label tpLabel6 = na, label.delete(tpLabel6)
var label tpLabel7 = na, label.delete(tpLabel7)
var label tpLabel8 = na, label.delete(tpLabel8)
var label tpLabel9 = na, label.delete(tpLabel9)
var label tpLabel10 = na, label.delete(tpLabel10)
float i_tp1Price = i_entryPrice + (i_entryPrice - i_slPrice)
float i_tp2Price = i_entryPrice + (i_entryPrice - i_slPrice) * 2
float i_tp3Price = i_entryPrice + (i_entryPrice - i_slPrice) * 3
float i_tp4Price = i_entryPrice + (i_entryPrice - i_slPrice) * 4
float i_tp5Price = i_entryPrice + (i_entryPrice - i_slPrice) * 5
float i_tp6Price = i_entryPrice + (i_entryPrice - i_slPrice) * 6
float i_tp7Price = i_entryPrice + (i_entryPrice - i_slPrice) * 7
float i_tp8Price = i_entryPrice + (i_entryPrice - i_slPrice) * 8
float i_tp9Price = i_entryPrice + (i_entryPrice - i_slPrice) * 9
float i_tp10Price = i_entryPrice + (i_entryPrice - i_slPrice) * 10
f_getStyle(_style) =>
ret = line.style_solid
if _style == "dotted"
ret := line.style_dotted
else if _style == "dashed"
ret := line.style_dashed
ret
f_getLabelSize() =>
ret = size.normal
if i_labelSize == "small"
ret := size.small
else if i_labelSize == "tiny"
ret := size.tiny
ret
entryLine := line.new(i_fromDate, i_entryPrice, i_fromDate + distanceInTime, i_entryPrice, xloc=xloc.bar_time, color=i_entryColor, width=i_entryWidth, style=f_getStyle(i_entryStyle))
stopLossLine := line.new(i_fromDate, i_slPrice, i_fromDate + distanceInTime, i_slPrice, xloc=xloc.bar_time, color=i_slColor, width=i_slWidth, style=f_getStyle(i_slStyle))
tpLine1 := i_useTP1 ? line.new(i_fromDate, i_tp1Price, i_fromDate + distanceInTime, i_tp1Price, xloc=xloc.bar_time, color=i_tpColor, width=i_tpWidth, style=f_getStyle(i_tpStyle)) : na
tpLine2 := i_useTP2 ? line.new(i_fromDate, i_tp2Price, i_fromDate + distanceInTime, i_tp2Price, xloc=xloc.bar_time, color=i_tpColor, width=i_tpWidth, style=f_getStyle(i_tpStyle)) : na
tpLine3 := i_useTP3 ? line.new(i_fromDate, i_tp3Price, i_fromDate + distanceInTime, i_tp3Price, xloc=xloc.bar_time, color=i_tpColor, width=i_tpWidth, style=f_getStyle(i_tpStyle)) : na
tpLine4 := i_useTP4 ? line.new(i_fromDate, i_tp4Price, i_fromDate + distanceInTime, i_tp4Price, xloc=xloc.bar_time, color=i_tpColor, width=i_tpWidth, style=f_getStyle(i_tpStyle)) : na
tpLine5 := i_useTP5 ? line.new(i_fromDate, i_tp5Price, i_fromDate + distanceInTime, i_tp5Price, xloc=xloc.bar_time, color=i_tpColor, width=i_tpWidth, style=f_getStyle(i_tpStyle)) : na
tpLine6 := i_useTP6 ? line.new(i_fromDate, i_tp6Price, i_fromDate + distanceInTime, i_tp6Price, xloc=xloc.bar_time, color=i_tpColor, width=i_tpWidth, style=f_getStyle(i_tpStyle)) : na
tpLine7 := i_useTP7 ? line.new(i_fromDate, i_tp7Price, i_fromDate + distanceInTime, i_tp7Price, xloc=xloc.bar_time, color=i_tpColor, width=i_tpWidth, style=f_getStyle(i_tpStyle)) : na
tpLine8 := i_useTP8 ? line.new(i_fromDate, i_tp8Price, i_fromDate + distanceInTime, i_tp8Price, xloc=xloc.bar_time, color=i_tpColor, width=i_tpWidth, style=f_getStyle(i_tpStyle)) : na
tpLine9 := i_useTP9 ? line.new(i_fromDate, i_tp9Price, i_fromDate + distanceInTime, i_tp9Price, xloc=xloc.bar_time, color=i_tpColor, width=i_tpWidth, style=f_getStyle(i_tpStyle)) : na
tpLine10 := i_useTP10 ? line.new(i_fromDate, i_tp10Price, i_fromDate + distanceInTime, i_tp10Price, xloc=xloc.bar_time, color=i_tpColor, width=i_tpWidth, style=f_getStyle(i_tpStyle)) : na
entryLabel := label.new(i_fromDate + barDistance * i_labelOffset, i_entryPrice, text="Entry @ " + str.tostring(i_entryPrice, '#.##'), xloc=xloc.bar_time, yloc=yloc.price, textcolor=i_entryColor, style=label.style_none,textalign = text.align_center, size=f_getLabelSize())
slLabel := label.new(i_fromDate + barDistance * i_labelOffset, i_slPrice, text="Stop Loss " + str.tostring((i_slPrice - i_entryPrice) / syminfo.mintick, "#")+ " Ticks @ " + str.tostring(i_slPrice, '#.##'), xloc=xloc.bar_time, yloc=yloc.price, textcolor=i_slColor, style=label.style_none,textalign = text.align_center, size=f_getLabelSize())
tpLabel1 := i_useTP1 ? label.new(i_fromDate + barDistance * i_labelOffset, i_tp1Price, text="Target 1 " + str.tostring((i_tp1Price - i_entryPrice) / syminfo.mintick, "#")+ " Ticks @ " + str.tostring(i_tp1Price, '#.##'), xloc=xloc.bar_time, yloc=yloc.price, textcolor=i_tpColor, style=label.style_none,textalign = text.align_center, size=f_getLabelSize()) : na
tpLabel2 := i_useTP2 ? label.new(i_fromDate + barDistance * i_labelOffset, i_tp2Price, text="Target 2 " + str.tostring((i_tp2Price - i_entryPrice) / syminfo.mintick, "#")+ " Ticks @ " + str.tostring(i_tp2Price, '#.##'), xloc=xloc.bar_time, yloc=yloc.price, textcolor=i_tpColor, style=label.style_none,textalign = text.align_center, size=f_getLabelSize()) : na
tpLabel3 := i_useTP3 ? label.new(i_fromDate + barDistance * i_labelOffset, i_tp3Price, text="Target 3 " + str.tostring((i_tp3Price - i_entryPrice) / syminfo.mintick, "#")+ " Ticks @ " + str.tostring(i_tp3Price, '#.##'), xloc=xloc.bar_time, yloc=yloc.price, textcolor=i_tpColor, style=label.style_none,textalign = text.align_center, size=f_getLabelSize()) : na
tpLabel4 := i_useTP4 ? label.new(i_fromDate + barDistance * i_labelOffset, i_tp4Price, text="Target 4 " + str.tostring((i_tp4Price - i_entryPrice) / syminfo.mintick, "#")+ " Ticks @ " + str.tostring(i_tp4Price, '#.##'), xloc=xloc.bar_time, yloc=yloc.price, textcolor=i_tpColor, style=label.style_none,textalign = text.align_center, size=f_getLabelSize()) : na
tpLabel5 := i_useTP5 ? label.new(i_fromDate + barDistance * i_labelOffset, i_tp5Price, text="Target 5 " + str.tostring((i_tp5Price - i_entryPrice) / syminfo.mintick, "#")+ " Ticks @ " + str.tostring(i_tp5Price, '#.##'), xloc=xloc.bar_time, yloc=yloc.price, textcolor=i_tpColor, style=label.style_none,textalign = text.align_center, size=f_getLabelSize()) : na
tpLabel6 := i_useTP6 ? label.new(i_fromDate + barDistance * i_labelOffset, i_tp6Price, text="Target 6 " + str.tostring((i_tp6Price - i_entryPrice) / syminfo.mintick, "#")+ " Ticks @ " + str.tostring(i_tp6Price, '#.##'), xloc=xloc.bar_time, yloc=yloc.price, textcolor=i_tpColor, style=label.style_none,textalign = text.align_center, size=f_getLabelSize()) : na
tpLabel7 := i_useTP7 ? label.new(i_fromDate + barDistance * i_labelOffset, i_tp7Price, text="Target 7 " + str.tostring((i_tp7Price - i_entryPrice) / syminfo.mintick, "#")+ " Ticks @ " + str.tostring(i_tp7Price, '#.##'), xloc=xloc.bar_time, yloc=yloc.price, textcolor=i_tpColor, style=label.style_none,textalign = text.align_center, size=f_getLabelSize()) : na
tpLabel8 := i_useTP8 ? label.new(i_fromDate + barDistance * i_labelOffset, i_tp8Price, text="Target 8 " + str.tostring((i_tp8Price - i_entryPrice) / syminfo.mintick, "#")+ " Ticks @ " + str.tostring(i_tp8Price, '#.##'), xloc=xloc.bar_time, yloc=yloc.price, textcolor=i_tpColor, style=label.style_none,textalign = text.align_center, size=f_getLabelSize()) : na
tpLabel9 := i_useTP9 ? label.new(i_fromDate + barDistance * i_labelOffset, i_tp9Price, text="Target 9 " + str.tostring((i_tp9Price - i_entryPrice) / syminfo.mintick, "#")+ " Ticks @ " + str.tostring(i_tp9Price, '#.##'), xloc=xloc.bar_time, yloc=yloc.price, textcolor=i_tpColor, style=label.style_none,textalign = text.align_center, size=f_getLabelSize()) : na
tpLabel10 := i_useTP10 ? label.new(i_fromDate + barDistance * i_labelOffset, i_tp10Price, text="Target 10 " + str.tostring((i_tp10Price - i_entryPrice) / syminfo.mintick, "#")+ " Ticks @ " + str.tostring(i_tp10Price, '#.##'), xloc=xloc.bar_time, yloc=yloc.price, textcolor=i_tpColor, style=label.style_none,textalign = text.align_center, size=f_getLabelSize()) : na
i_showBox = input.bool(true, "Show Background", group="Show Background")
var box greenBox = na, box.delete(greenBox)
var box redBox = na, box.delete(redBox)
f_findHighestTP() =>
ret = i_tp1Price
if i_useTP10
ret := i_tp10Price
else if i_useTP9
ret := i_tp9Price
else if i_useTP8
ret := i_tp8Price
else if i_useTP7
ret := i_tp7Price
else if i_useTP6
ret := i_tp6Price
else if i_useTP5
ret := i_tp5Price
else if i_useTP4
ret := i_tp4Price
else if i_useTP3
ret := i_tp3Price
else if i_useTP2
ret := i_tp2Price
ret
greenBox := i_showBox ? box.new(i_fromDate, i_entryPrice, i_fromDate + distanceInTime, f_findHighestTP(), xloc=xloc.bar_time, bgcolor=color.new(i_tpColor, 70), border_width = 0) : na
redBox := i_showBox ? box.new(i_fromDate, i_entryPrice, i_fromDate + distanceInTime, i_slPrice, xloc=xloc.bar_time, bgcolor=color.new(i_slColor, 70), border_width = 0) : na
Oversold Screener · Webhook v3.3#Oversold Screener · Webhook v3.3
US Equities · 15-minute signals · AVWAP entries A–F · Optional CVD gate
## TL;DR
This indicator finds short-term, emotion-driven selloffs in large, liquid US stocks and pings your webhook with a compact alert (symbol + 15-minute close time).
It anchors an Event-AVWAP at the first qualified 15-minute bar after the selloff and proposes disciplined “right-side” entries (A–F) as price mean-reverts back through statistically defined bands. Optional macro fuses and CVD filters help avoid catching knives.
---
## What it does
1. Universe filter (off-chart): You run this on constituents of S&P 500 / Nasdaq-100 / Nasdaq Golden Dragon (or your curated list of healthy companies).
2. Signal (Step-2): On the 15-minute timeframe—including extended hours—the script flags an “oversold event” when:
• Depth: Today’s drawdown vs yesterday’s RTH reference (min of yesterday’s VWAP and Close) is large.
• Relative: The stock underperforms both its market benchmark (e.g., SPY/QQQ) and its sector ETF over the same 16/32×15m windows.
• Macro fuses: If any of the following exceed thresholds, the signal is suppressed: VIX spike, market 16/32×15m selloff, sector 16/32×15m selloff.
• RSI guard: 1-hour RSI is below a configurable level (default 30).
• Cooldown: De-dupes repeated events; you won’t be spammed by the same name intraday.
3. Execution geometry: At the event bar’s close the indicator anchors an AVWAP calculated natively in 15m space and draws ±1σ/±2σ/±3σ bands from a rolling variance of typical price.
4. Entry proposals: It labels A–F entries when price regains key bands after first probing the lower ones (see below). Optional 15m CVD confirmation can be required.
5. Alerts: When the event closes, TradingView raises a single alert with a tiny JSON payload so your downstream AI/service can do the news check and decide.
---
## Why this approach works
• Depth vs yesterday’s RTH reference targets “fresh” dislocations rather than slow trends.
• Relative filters ensure the stock fell much more than both the market and its sector, isolating idiosyncratic panic.
• AVWAP from the event bar approximates the market’s true average position after the shock; band reclaims are robust right-side confirmations.
• Optional CVD (delta volume) catches sell-side exhaustion and buy-side emergence without requiring a full order-book feed.
• Macro fuses (VIX / market / sector) avoid swimming against systemic stress.
---
## Inputs (key)
Bench ETF / Sector ETF
Choose your market (SPY or QQQ) and sector ETF (XLK/XLF/XLY… or KWEB/CQQQ for China tech ADRs).
Depth & relative settings (15-minute space)
• Depth vs prior-day RTH reference: percentage thresholds for 16 and 32 bars.
• Relative to market & sector: underperformance thresholds over 16 and 32 bars.
Macro circuit breakers
• VIX max change (e.g., +8%/+12% over the session)
• Market max 16/32×15m selloff (e.g., −1.5% / −2.5%)
• Sector max 16/32×15m selloff (e.g., −2.0% / −3.0%)
If any one exceeds the limit, the signal is suppressed.
Momentum guard
• RSI(1h) < 30 (configurable).
AVWAP band engine (15m native)
• Bands: ±1σ / ±2σ / ±3σ with EMA smoothing and optional σ cap.
• Settling bars after anchor (default 1–3) to reduce immediate whipsaws.
Entry toggles
• Enable/disable A, B, C, D, E, F individually.
• Optional CVD gate (on/off), lookback window and reversal thresholds.
Housekeeping
• Debounce per ticker and per entry type.
• Entry window length (default 1 week) and per-type cap (show top 3 per event).
• Webhook on/off.
---
## Entries (A–F)
These are right-side confirmations; each requires first touching the prerequisite lower band before reclaiming a higher one.
A Touch ≤ −2σ, then cross up through −1σ (classic exhaustion → relief).
B Touch ≤ −1σ, then reclaim AVWAP (crowd average changes hands).
C Break −1σ up, retest near −1σ within N bars, then bounce (retest confirmation).
D After compression (low ATR%), reclaim AVWAP (coiled spring).
E Touch ≤ −2σ, then reclaim AVWAP after a base (deeper flush → stronger reclaim).
F Touch ≤ −3σ, then cross up through −1σ (capitulation → violent mean reversion).
Optional CVD gate (15m): require sell-pressure exhaustion and a CVD turn-up before validating entries. Defaults are conservative so that A/F remain the highest-quality.
---
## Alert payload (minimal by design)
On event close, one alert is fired with a tiny JSON:
{
"event": "step2_signal",
"symbol": "TSLA",
"ts_15m_ms": 1730879700000
}
Use “Once per bar close” and the 15-minute chart. Your webhook receiver can enrich with fundamentals/news and decide Allow / Hold / Reject, then monitor A–F entries for execution.
---
## How to use
1. Run on your 15-minute chart with extended session enabled.
2. Create one alert per chart (or use TradingView’s multi-chart / watchlist alerts if you have Pro+).
3. Your backend ingests the minimal payload, fetches news and fundamentals, and returns a decision.
4. For Allowed names, watch the on-chart A–F labels; scale in across levels, scale out into upper HVNs/POC or AVWAP give-back.
---
## Defaults that work well
• RSI(1h) < 30
• Depth vs yesterday’s RTH ref: ≤ −4% (16 bars), ≤ −6% (32 bars)
• Relative to market/sector: ≤ −3% (16 bars), ≤ −4% (32 bars)
• Macro fuses: VIX day change ≤ +10%; market ≤ −2.0% / −3.0%; sector ≤ −2.5% / −3.5%
• AVWAP bands: EMA(σ)=3; σ cap off; settle ≥ 1 bar
• CVD gate off initially; enable after you’re comfortable with its behavior.
---
## Notes & limitations
• Indicator, not a strategy: it proposes event points and entries; position sizing and exits are up to you.
• Designed for US equities with ample liquidity; thin names will be noisy.
• Repainting: AVWAP and bands are anchored and do not repaint; entries are evaluated on bar close.
• To keep charts readable, we limit entry labels to the first three occurrences per type within the one-week window.
---
## What’s new in v3.3
• 15-minute event engine (always 15m, independent of the chart you view).
• Depth measured vs yesterday’s RTH VWAP/CLOSE (the lower of the two).
• Removed structure-health (SMA50 coverage) and MA50/200 position checks.
• Macro circuit breakers: VIX + market + sector thresholds; any one trips a fuse.
• RSI guard moved to 1-hour.
• AVWAP bands include ±3σ and new Entry F (−3σ → −1σ reclaim).
• Optional 15m CVD gate for entries.
• Minimal webhook payload for fast downstream AI checks.
• Debounce + entry-window caps to prevent over-labeling and to focus the week after the event.
• Numerous performance and stability tweaks in the 15m security sandbox.
---
## Disclaimer
This is a research tool. It does not constitute investment advice. Test in Replay first, start with small size, and respect your risk.
Checklist Core Functionality
Manual Trade Setup Checklist: Provides 5 key trading criteria that traders can manually check off when conditions are met
Visual Confirmation System: Displays a clean table with checkmarks (✅) for completed criteria
Real-time Progress Tracking: Shows which trading setup conditions have been satisfied
Checklist Items
Retrace < 78.6% - Fibonacci retracement level check
ATR Entry - Average True Range based entry condition
CHoCH+ - Change of Character (market structure shift)
5m EG - 5-minute entry guide/pattern
PullBack < 78.6% - Pullback depth limitation
Key Features
Customizable Display: Full control over colors, text sizes, and table positioning
Flexible Placement: Table can be positioned in 6 different locations on the chart
Reset Function: Quick reset button to clear all checkmarks and start fresh
Visual Scoring: Color-coded system (bullish/bearish/neutral) to indicate checklist progress
Entry Guidance: Shows either "🎯" for confirmed entry or "61.8%" for retracement level
Purpose
This indicator helps traders maintain discipline by ensuring all criteria are met before entering trades, reducing emotional decisions and enforcing a systematic approach to trading setups. It's particularly useful for price action traders who follow specific entry protocols and want to document their decision-making process directly on the chart.
Luxy BIG beautiful Dynamic ORBThis is an advanced Opening Range Breakout (ORB) indicator that tracks price breakouts from the first 5, 15, 30, and 60 minutes of the trading session. It provides complete trade management including entry signals, stop-loss placement, take-profit targets, and position sizing calculations.
The ORB strategy is based on the concept that the opening range of a trading session often acts as support/resistance, and breakouts from this range tend to lead to significant moves.
What Makes This Different?
Most ORB indicators simply draw horizontal lines and leave you to figure out the rest. This indicator goes several steps further:
Multi-Stage Tracking
Instead of just one ORB timeframe, this tracks FOUR simultaneously (5min, 15min, 30min, 60min). Each stage builds on the previous one, giving you multiple trading opportunities throughout the session.
Active Trade Management
When a breakout occurs, the indicator automatically calculates and displays entry price, stop-loss, and multiple take-profit targets. These lines extend forward and update in real-time until the trade completes.
Cycle Detection
Unlike indicators that only show the first breakout, this tracks the complete cycle: Breakout → Retest → Re-breakout. You can see when price returns to test the ORB level after breaking out (potential re-entry).
Failed Breakout Warning
If price breaks out but quickly returns inside the range (within a few bars), the label changes to "FAILED BREAK" - warning you to exit or avoid the trade.
Position Sizing Calculator
Built-in risk management that tells you exactly how many shares to buy based on your account size and risk tolerance. No more guessing or manual calculations.
Advanced Filtering
Optional filters for volume confirmation, trend alignment, and Fair Value Gaps (FVG) to reduce false signals and improve win rate.
Core Features Explained
### 1. Multi-Stage ORB Levels
The indicator builds four separate Opening Range levels:
ORB 5 - First 5 minutes (fastest signals, most volatile)
ORB 15 - First 15 minutes (balanced, most popular)
ORB 30 - First 30 minutes (slower, more reliable)
ORB 60 - First 60 minutes (slowest, most confirmed)
Each level is drawn as a horizontal range on your chart. As time progresses, the ranges expand to include more price action. You can enable or disable any stage and assign custom colors to each.
How it works: During the opening minutes, the indicator tracks the highest high and lowest low. Once the time period completes, those levels become your ORB high and low for that stage.
### 2. Breakout Detection
When price closes outside the ORB range, a label appears:
BREAK UP (green label above price) - Price closed above ORB High
BREAK DOWN (red label below price) - Price closed below ORB Low
The label shows which ORB stage triggered (ORB5, ORB15, etc.) and the cycle number if tracking multiple breakouts.
Important: Signals appear on bar close only - no repainting. What you see is what you get.
### 3. Retest Detection
After price breaks out and moves away, if it returns to test the ORB level, a "RETEST" label appears (orange). This indicates:
The original breakout level is now acting as support/resistance
Potential re-entry opportunity if you missed the first breakout
Confirmation that the level is significant
The indicator requires price to move a minimum distance away before considering it a valid retest (configurable in settings).
### 4. Failed Breakout Detection
If price breaks out but returns inside the ORB range within a few bars (before the breakout is "committed"), the original label changes to "FAILED BREAK" in orange.
This warns you:
The breakout lacked conviction
Consider exiting if already in the trade
Wait for better setup
Committed Breakout: The indicator tracks how many bars price stays outside the range. Only after staying outside for the minimum number of bars does it become a committed breakout that can be retested.
### 5. TP/SL Lines (Trade Management)
When a breakout occurs, colored horizontal lines appear showing:
Entry Line (cyan for long, orange for short) - Your entry price (the ORB level)
Stop Loss Line (red) - Where to exit if trade goes against you
TP1, TP2, TP3 Lines (same color as entry) - Profit targets at 1R, 2R, 3R
These lines extend forward as new bars form, making it easy to track your trade. When a target is hit, the line turns green and the label shows a checkmark.
Lines freeze (stop updating) when:
Stop loss is hit
The final enabled take-profit is hit
End of trading session (optional setting)
### 6. Position Sizing Dashboard
The dashboard (bottom-left corner by default) shows real-time information:
Current ORB stage and range size
Breakout status (Inside Range / Break Up / Break Down)
Volume confirmation (if filter enabled)
Trend alignment (if filter enabled)
Entry and Stop Loss prices
All enabled Take Profit levels with percentages
Risk/Reward ratio
Position sizing: Max shares to buy and total risk amount
Position Sizing Example:
If your account is $25,000 and you risk 1% per trade ($250), and the distance from entry to stop loss is $0.50, the calculator shows you can buy 500 shares (250 / 0.50 = 500).
### 7. FVG Filter (Fair Value Gap)
Fair Value Gaps are price inefficiencies - gaps left by strong momentum where one candle's high doesn't overlap with a previous candle's low (or vice versa).
When enabled, this filter:
Detects bullish and bearish FVGs
Draws semi-transparent boxes around these gaps
Only allows breakout signals if there's an FVG near the breakout level
Why this helps: FVGs indicate institutional activity. Breakouts through FVGs tend to be stronger and more reliable.
Proximity setting: Controls how close the FVG must be to the ORB level. 2.0x means the breakout can be within 2 times the FVG size - a reasonable default.
### 8. Volume & Trend Filters
Volume Filter:
Requires current volume to be above average (customizable multiplier). High volume breakouts are more likely to sustain.
Set minimum multiplier (e.g., 1.5x = 50% above average)
Set "strong volume" multiplier (e.g., 2.5x) that bypasses other filters
Dashboard shows current volume ratio
Trend Filter:
Only shows breakouts aligned with a higher timeframe trend. Choose from:
VWAP - Price above/below volume-weighted average
EMA - Price above/below exponential moving average
SuperTrend - ATR-based trend indicator
Combined modes (VWAP+EMA, VWAP+SuperTrend) for stricter filtering
### 9. Pullback Filter (Advanced)
Purpose:
Waits for price to pull back slightly after initial breakout before confirming the signal.
This reduces false breakouts from immediate reversals.
How it works:
- After breakout is detected, indicator waits for a small pullback (default 2%)
- Once pullback occurs AND price breaks out again, signal is confirmed
- If no pullback within timeout period (5 bars), signal is issued anyway
Settings:
Enable Pullback Filter: Turn this filter on/off
Pullback %: How much price must pull back (2% is balanced)
Timeout (bars): Max bars to wait for pullback (5 is standard)
When to use:
- Choppy markets with many fake breakouts
- When you want higher quality signals
- Combine with Volume filter for maximum confirmation
Trade-off:
- Better signal quality
- May miss some valid fast moves
- Slight entry delay
How to Use This Indicator
### For Beginners - Simple Setup
Add the indicator to your chart (5-minute or 15-minute timeframe recommended)
Leave all default settings - they work well for most stocks
Watch for BREAK UP or BREAK DOWN labels to appear
Check the dashboard for entry, stop loss, and targets
Use the position sizing to determine how many shares to buy
Basic Trading Plan:
Wait for a clear breakout label
Enter at the ORB level (or next candle open if you're late)
Place stop loss where the red line indicates
Take profit at TP1 (50% of position) and TP2 (remaining 50%)
### For Advanced Traders - Customized Setup
Choose which ORB stages to track (you might only want ORB15 and ORB30)
Enable filters: Volume (stocks) or Trend (trending markets)
Enable FVG filter for institutional confirmation
Set "Track Cycles" mode to catch retests and re-breakouts
Customize stop loss method (ATR for volatile stocks, ORB% for stable ones)
Adjust risk per trade and account size for accurate position sizing
Advanced Strategy Example:
Enable ORB15 only (disable others for cleaner chart)
Turn on Volume filter at 1.5x with Strong at 2.5x
Enable Trend filter using VWAP
Set Signal Mode to "Track Cycles" with Max 3 cycles
Wait for aligned breakouts (Volume + Trend + Direction)
Enter on retest if you missed the initial break
### Timeframe Recommendations
5-minute chart: Scalping, very active trading, crypto
15-minute chart: Day trading, balanced approach (most popular)
30-minute chart: Swing entries, less screen time
60-minute chart: Position trading, longer holds
The indicator works on any intraday timeframe, but ORB is fundamentally a day trading strategy. Daily charts don't make sense for ORB.
DEFAULT CONFIGURATION
ON by Default:
• All 4 ORB stages (5/15/30/60)
• Breakout Detection
• Retest Labels
• All TP levels (1/1.5/2/3)
• TP/SL Lines (Detailed mode)
• Dashboard (Bottom Left, Dark theme)
• Position Size Calculator
OFF by Default (Optional Filters):
• FVG Filter
• Pullback Filter
• Volume Filter
• Trend Filter
• HTF Bias Check
• Alerts
Recommended for Beginners:
• Leave all defaults
• Session Mode: Auto-Detect
• Signal Mode: Track Cycles
• Stop Method: ATR
• Add Volume Filter if trading stocks
Recommended for Advanced:
• Enable ORB15 + ORB30 only (disable 5 & 60)
• Enable: Volume + Trend + FVG
• Signal Mode: Track Cycles, Max 3
• Stop Method: ATR or Safer
• Enable HTF Daily bias check
## Settings Guide
The settings are organized into logical groups. Here's what each section controls:
### ORB COLORS Section
Show Edge Labels: Display "ORB 5", "ORB 15" labels at the right edge of the levels
Background: Fill the area between ORB high/low with color
Transparency: How see-through the background is (95% is nearly invisible)
Enable ORB 5/15/30/60: Turn each stage on or off individually
Colors: Assign colors to each ORB stage for easy identification
### SESSION SETTINGS Section
Session Mode: Choose trading session (Auto-Detect works for most instruments)
Custom Session Hours: Define your own hours if needed (format: HHMM-HHMM)
Auto-Detect uses the instrument's natural hours (stocks use exchange hours, crypto uses 24/7).
### BREAKOUT DETECTION Section
Enable Breakout Detection: Master switch for signals
Show Retest Labels: Display retest signals
Label Size: Visual size for all labels (Small recommended)
Enable FVG Filter: Require Fair Value Gap confirmation
Show FVG Boxes: Display the gap boxes on chart
Signal Mode: "First Only" = one signal per direction per day, "Track Cycles" = multiple signals
Max Cycles: How many breakout-retest cycles to track (6 is balanced)
Breakout Buffer: Extra distance required beyond ORB level (0.1-0.2% recommended)
Min Distance for Retest: How far price must move away before retest is valid (2% recommended)
Min Bars Outside ORB: Bars price must stay outside for committed breakout (2 is balanced)
### TARGETS & RISK Section
Enable Targets & Stop-Loss: Calculate and show trade management
TP1/TP2/TP3 checkboxes: Select which profit targets to display
Stop Method: How to calculate stop loss placement
- ATR: Based on volatility (best for most cases)
- ORB %: Fixed % of ORB range
- Swing: Recent swing high/low
- Safer: Widest of all methods
ATR Length & Multiplier: Controls ATR stop distance (14 period, 1.5x is standard)
ORB Stop %: Percentage beyond ORB for stop (20% is balanced)
Swing Bars: Lookback period for swing high/low (3 is recent)
### TP/SL LINES Section
Show TP/SL Lines: Display horizontal lines on chart
Label Format: "Short" = minimal text, "Detailed" = shows prices
Freeze Lines at EOD: Stop extending lines at session close
### DASHBOARD Section
Show Info Panel: Display the metrics dashboard
Theme: Dark or Light colors
Position: Where to place dashboard on chart
Toggle rows: Show/hide specific information rows
Calculate Position Size: Enable the position sizing calculator
Risk Mode: Risk fixed $ amount or % of account
Account Size: Your total trading capital
Risk %: Percentage to risk per trade (0.5-1% recommended)
### VOLUME FILTER Section
Enable Volume Filter: Require volume confirmation
MA Length: Average period (20 is standard)
Min Volume: Required multiplier (1.5x = 50% above average)
Strong Volume: Multiplier that bypasses other filters (2.5x)
### TREND FILTER Section
Enable Trend Filter: Require trend alignment
Trend Mode: Method to determine trend (VWAP is simple and effective)
Custom EMA Length: If using EMA mode (50 for swing, 20 for day trading)
SuperTrend settings: Period and Multiplier if using SuperTrend mode
### HIGHER TIMEFRAME Section
Check Daily Trend: Display higher timeframe bias in dashboard
Timeframe: What TF to check (D = daily, recommended)
Method: Price vs MA (stable) or Candle Direction (reactive)
MA Period: EMA length for Price vs MA method (20 is balanced)
Min Strength %: Minimum strength threshold for HTF bias to be considered
- For "Price vs MA": Minimum distance (%) from moving average
- For "Candle Direction": Minimum candle body size (%)
- 0.5% is balanced - increase for stricter filtering
- Lower values = more signals, higher values = only strong trends
### ALERTS Section
Enable Alerts: Master switch (must be ON to use any alerts)
Breakout Alerts: Notify on ORB breakouts
Retest Alerts: Notify when price retests after breakout
Failed Break Alerts: Notify on failed breakouts
Stage Complete Alerts: Notify when each ORB stage finishes forming
After enabling desired alert types, click "Create Alert" button, select this indicator, choose "Any alert() function call".
## Tips & Best Practices
### General Trading Tips
ORB works best on liquid instruments (stocks with good volume, major crypto pairs)
First hour of the session is most important - that's when ORB is forming
Breakouts WITH the trend have higher success rates - use the trend filter
Failed breakouts are common - use the "Min Bars Outside" setting to filter weak moves
Not every day produces good ORB setups - be patient and selective
### Position Sizing Best Practices
Never risk more than 1-2% of your account on a single trade
Use the built-in calculator - don't guess your position size
Update your account size monthly as it grows
Smaller accounts: use $ Amount mode for simplicity
Larger accounts: use % of Account mode for scaling
### Take Profit Strategy
Most traders use: 50% at TP1, 50% at TP2
Aggressive: Hold through TP1 for TP2 or TP3
Conservative: Full exit at TP1 (1:1 risk/reward)
After TP1 hits, consider moving stop to breakeven
TP3 rarely hits - only on strong trending days
### Filter Combinations
Maximum Quality: Volume + Trend + FVG (fewest signals, highest quality)
Balanced: Volume + Trend (good quality, reasonable frequency)
Active Trading: No filters or Volume only (many signals, lower quality)
Trending Markets: Trend filter essential (indices, crypto)
Range-Bound: Volume + FVG (avoid trend filter)
### Common Mistakes to Avoid
Chasing breakouts - wait for the bar to close, don't FOMO into wicks
Ignoring the stop loss - always use it, move it manually if needed
Over-leveraging - the calculator shows MAX shares, you can buy less
Trading every signal - quality > quantity, use filters
Not tracking results - keep a journal to see what works for YOU
## Pros and Cons
### Advantages
Complete all-in-one solution - from signal to position sizing
Multiple timeframes tracked simultaneously
Visual clarity - easy to see what's happening
Cycle tracking catches opportunities others miss
Built-in risk management eliminates guesswork
Customizable filters for different trading styles
No repainting - what you see is locked in
Works across multiple markets (stocks, forex, crypto)
### Limitations
Intraday strategy only - doesn't work on daily charts
Requires active monitoring during first 1-2 hours of session
Not suitable for after-hours or extended sessions by default
Can produce many signals in choppy markets (use filters)
Dashboard can be overwhelming for complete beginners
Performance depends on market conditions (trends vs ranges)
Requires understanding of risk management concepts
### Best For
Day traders who can watch the first 1-2 hours of market open
Traders who want systematic entry/exit rules
Those learning proper position sizing and risk management
Active traders comfortable with multiple signals per day
Anyone trading liquid instruments with clear sessions
### Not Ideal For
Swing traders holding multi-day positions
Set-and-forget / passive investors
Traders who can't watch market open
Complete beginners unfamiliar with trading concepts
Low volume / illiquid instruments
## Frequently Asked Questions
Q: Why are no signals appearing?
A: Check that you're on an intraday timeframe (5min, 15min, etc.) and that the current time is within your session hours. Also verify that "Enable Breakout Detection" is ON and at least one ORB stage is enabled. If using filters, they might be blocking signals - try disabling them temporarily.
Q: What's the best ORB stage to use?
A: ORB15 (15 minutes) is most popular and balanced. ORB5 gives faster signals but more noise. ORB30 and ORB60 are slower but more reliable. Many traders use ORB15 + ORB30 together.
Q: Should I enable all the filters?
A: Start with no filters to see all signals. If too many false signals, add Volume filter first (stocks) or Trend filter (trending markets). FVG filter is most restrictive - use for maximum quality but fewer signals.
Q: How do I know which stop loss method to use?
A: ATR works for most cases - it adapts to volatility. Use ORB% if you want predictable stop placement. Swing is for respecting chart structure. Safer gives you the most room but largest risk.
Q: Can I use this for swing trading?
A: Not really - ORB is fundamentally an intraday strategy. The ranges reset each day. For swing trading, look at weekly support/resistance or moving averages instead.
Q: Why do TP/SL lines disappear sometimes?
A: Lines freeze (stop extending) when: stop loss is hit, the last enabled take-profit is hit, or end of session arrives (if "Freeze at EOD" is enabled). This is intentional - the trade is complete.
Q: What's the difference between "First Only" and "Track Cycles"?
A: "First Only" shows one breakout UP and one DOWN per day maximum - clean but might miss opportunities. "Track Cycles" shows breakout-retest-rebreak sequences - more signals but busier chart.
Q: Is position sizing accurate for options/forex?
A: The calculator is designed for shares (stocks). For options, ignore the share count and use the risk amount. For forex, you'll need to adapt the lot size calculation manually.
Q: How much capital do I need to use this?
A: The indicator works for any account size, but practical day trading typically requires $25,000 in the US due to Pattern Day Trader rules. Adjust the "Account Size" setting to match your capital.
Q: Can I backtest this strategy?
A: This is an indicator, not a strategy script, so it doesn't have built-in backtesting. You can visually review historical signals or code a strategy script using similar logic.
Q: Why does the dashboard show different entry price than the breakout label?
A: If you're looking at an old breakout, the ORB levels may have changed when the next stage completed. The dashboard always shows the CURRENT active range and trade setup.
Q: What's a good win rate to expect?
A: ORB strategies typically see 40-60% win rate depending on market conditions and filters used. The strategy relies on positive risk/reward ratios (2:1 or better) to be profitable even with moderate win rates.
Q: Does this work on crypto?
A: Yes, but crypto trades 24/7 so you need to define what "session start" means. Use Session Mode = Custom and set your preferred daily reset time (e.g., 0000-2359 UTC).
## Credits & Transparency
### Development
This indicator was developed with the assistance of AI technology to implement complex ORB trading logic.
The strategy concept, feature specifications, and trading logic were designed by the publisher. The implementation leverages modern development tools to ensure:
Clean, efficient, and maintainable code
Comprehensive error handling and input validation
Detailed documentation and user guidance
Performance optimization
### Trading Concepts
This indicator implements several public domain trading concepts:
Opening Range Breakout (ORB): Trading strategy popularized by Toby Crabel, Mark Fisher and many more talanted traders.
Fair Value Gap (FVG): Price imbalance concept from ICT methodology
SuperTrend: ATR-based trend indicator using public formula
Risk/Reward Ratio: Standard risk management principle
All mathematical formulas and technical concepts used are in the public domain.
### Pine Script
Uses standard TradingView built-in functions:
ta.ema(), ta.atr(), ta.vwap(), ta.highest(), ta.lowest(), request.security()
No external libraries or proprietary code from other authors.
## Disclaimer
This indicator is provided for educational and informational purposes only. It is not financial advice.
Trading involves substantial risk of loss and is not suitable for every investor. Past performance shown in examples is not indicative of future results.
The indicator provides signals and calculations, but trading decisions are solely your responsibility. Always:
Test strategies on paper before using real money
Never risk more than you can afford to lose
Understand that all trading involves risk
Consider seeking advice from a licensed financial advisor
The publisher makes no guarantees regarding accuracy, profitability, or performance. Use at your own risk.
---
Version: 3.0
Pine Script Version: v6
Last Updated: October 2024
For support, questions, or suggestions, please comment below or send a private message.
---
Happy trading, and remember: consistent risk management beats perfect entry timing every time.
MEGA_Long/Short📊 MTF Entry Signal (with L/S Labels)
A clean and compact multi-timeframe entry point indicator for TradingView. Shows clear entry signals for LONG and SHORT trades directly on the chart, with markers and letters for quick decision-making.
🎯 Key Features:
Dual timeframe analysis: Choose main and fast timeframes (default: 30m and 4h).
Entry signals:
🟢 Green triangle + "L" — LONG entry (Buy signal)
🔴 Red triangle + "S" — SHORT entry (Sell signal)
Signal only at true trend reversals – No excessive markers or noise.
Markers move dynamically with price – Always match the candlestick and chart movement.
⚙️ Signal Criteria:
LONG: EMA9 > EMA21 and MACD > 0, confirmed on both selected timeframes.
SHORT: EMA9 < EMA21 and MACD < 0, confirmed on both selected timeframes.
Entry marker appears only when signal direction changes.
🔧 Settings:
Manually select fast/main timeframes in the indicator menu (recommended: 30m + 4h).
Marker size set to minimal (size=tiny) for maximum clarity.
📈 Usage:
Designed for clean, non-overloaded charts.
Works perfectly for trend trading, reversals, and entry confirmation.
Suitable for scalping, swing trading, and crypto/futures analysis.
WorldCup Dashboard + Institutional Sessions© 2025 NewMeta™ — Educational use only.
# Full, Premium Description
## WorldCup Dashboard + Institutional Sessions
**A trade-ready, intraday framework that combines market structure, real flow, and institutional timing.**
This toolkit fuses **Institutional Sessions** with a **price–volume decision engine** so you can see *who is active*, *where value sits*, and *whether the drive is real*. You get: **CVD/Delta**, volume-weighted **Momentum**, **Aggression** spikes, **FVG (MTF)** with nearest side, **Daily Volume Profile (VAH/POC/VAL)**, **ATR regime**, a **24h position gauge**, classic **candle patterns**, IBH/IBL + **first-hour “true close”** lines, and a **10-vote confluence scoreboard**—all in one view.
---
## What’s inside (and how to trade it)
### 🌍 Institutional Sessions (Sydney • Tokyo • London • New York)
* Session boxes + a highlighted **first hour**.
* Plots the **true close** (first-hour close) as a running line with a label.
**Use:** Many desks anchor risk to this print. Above = bullish bias; below = bearish. **IBH/IBL** breaks during London/NY carry the most signal.
### 📊 CVD / Delta (Flow)
* Net buyer vs seller pressure with smooth trend state.
**Use:** **Rising CVD + acceptance above mid/POC** confirms continuation. Bearish price + rising CVD = caution (possible absorption).
### ⚡ Volume-Weighted Momentum
* Momentum adjusted by participation quality (volume).
**Use:** Momentum>MA and >0 → trend drive is “real”; <0 and falling → distribution risk.
### 🔥 Aggression Detector
* ROC × normalized volume × wick factor to flag **forceful** candles.
**Use:** On spikes, avoid fading blindly—wait for pullbacks into **aligned FVG** or for aggression to cool.
### 🟦🟪 Fair Value Gaps (with MTF)
* Detects up to 3 recent FVGs and marks the **nearest** side to price.
**Use:** Trend pullbacks into **bullish FVG** for longs; bounces into **bearish FVG** for shorts. Optional threshold to filter weak gaps.
### 🧭 24h Gauge (positioning)
* Shows current price across the 24h low⇢high with a mid reference.
**Use:** Above mid and pushing upper third = momentum continuation setups; below mid = sell the rips bias.
### 🧱 Daily Volume Profile (manual per day)
* **VAH / POC / VAL** derived from discretized rows.
**Use:** **POC below** supports longs; **POC above** caps rallies. Fade VAH/VAL in ranges; treat them as break/hold levels in trends.
### 📈 ATR Regime
* **ATR vs ATR-avg** with direction and regime flag (**HIGH / NORMAL / LOW**).
**Use:** HIGH ⇒ give trades room & favor trend following. LOW ⇒ fade edges, scale targets.
### 🕯️ Candle Patterns (contextual, not standalone)
* Engulfings, Morning/Evening Star, 3 Soldiers/Crows, Harami, Hammer/Shooting Star, Double Top/Bottom.
**Use:** Only with session + flow + momentum alignment.
### 🤝 Price–Volume Classification
* Labels each bar as **continuation**, **exhaustion**, **distribution**, or **healthy pullback**.
**Use:** Align continuation reads with trend; treat “Price↑ + Vol↓” as a caution flag.
### 🧪 Confluence Scoreboard & B/S Meter
* Ten elements vote: 🔵 bull, ⚪ neutral, 🟣 bear.
**Use:** Execution filter—take setups when the board’s skew matches your trade direction.
---
## Playbooks (actionable)
**Trend Pullback (Long)**
1. London/NY active, Momentum↑, CVD↑, price above 24h mid & POC.
2. Pullback into **nearest bullish FVG**.
3. Invalidate under FVG low or **true-close** line.
4. Targets: IBH → VAH → 24h high.
**Range Fade (Short)**
1. Asia/quiet regime, **Price↑ + Vol↓** into **VAH**, ATR low.
2. Nearest FVG bearish or scoreboard skew bearish.
3. Invalidate above VAH/IBH.
4. Targets: POC → VAL.
**News/Impulse**
Aggression spike? Don’t chase. Let it pull back into the aligned FVG; require CVD/Momentum agreement before entry.
---
## Alerts (included)
* **Bull/Bear Confluence ≥ 7/10**
* **Intraday Target Achieved** / **Daily Target Achieved**
* **Session True-Close Retests** (Sydney/Tokyo/London/NY)
*(Keep alerts “Once per bar” unless you specifically want intrabar triggers.)*
---
## Setup Tips
* **UTC**: Choose the reference that matches how you track sessions (default UTC+2).
* **Volume threshold**: 2.0× is a strong baseline; raise for noisy alts, lower for majors.
* **CVD smoothing**: 14–24 for scalps; 24–34 for slower markets.
* **ATR lengths**: Keep defaults unless your asset has a persistent regime shift.
---
## Why this framework?
Because **timing (sessions)**, **truth (flow)**, and **location (value/FVG)** together beat any single signal. You get *who is trading*, *how strong the push is*, and *where risk lives*—on one screen—so execution is faster and cleaner.
---
**Disclaimer**: Educational use only. Not financial advice. Markets are risky—backtest and size responsibly.
Spread Trading Z-ScoreIndicator: Z-Score Spread Indicator
Description
The "Z-Score Spread Indicator" is a powerful tool for traders employing mean-reversion strategies on the spread between two financial assets (e.g., futures contracts like MNQ and MES). This indicator calculates and plots the Z-score of the price spread, indicating how far the current spread deviates from its historical mean. It features customizable entry and exit thresholds with adjustable offsets, along with an estimated p-value displayed in a table to assess statistical significance.
Key Features
Asset Selection: Allows users to select two asset symbols (e.g., CME_MINI:MNQ1! and CME_MINI:MES1!) via customizable inputs.
Z-Score Calculation: Computes the Z-score based on the spread’s simple moving average and standard deviation over a user-defined lookback period.
Customizable Thresholds with Offset: Offers adjustable base entry and exit thresholds, with an optional offset to fine-tune trading levels, plotted as horizontal lines.
P-Value Estimation: Provides an approximate p-value to evaluate the statistical significance of the Z-score, displayed in a table anchored to the top-left corner.
Visual Representation: Plots the Z-score with a zero line and threshold lines for intuitive interpretation.
Adjustable Parameters
Asset A Symbol: Symbol for Asset A (default: CME_MINI:MNQ1!).
Asset B Symbol: Symbol for Asset B (default: CME_MINI:MES1!).
Z-Score Lookback: Lookback period for Z-score calculation (default: 40, minimum 2).
Base Entry Threshold: Threshold for entry signals (default: 1.8, adjustable with a step of 0.1).
Base Exit Threshold: Threshold for exit signals (default: 0.5, adjustable with a step of 0.1).
Threshold Offset (+/-): Offset to adjust entry and exit thresholds symmetrically (default: 0.0, range -5.0 to 5.0, step 0.1).
Usage
Add the indicator to your chart via the "Indicators" tab.
Customize the parameters based on your preferred assets and trading strategy (lookback period, thresholds, offset).
Observe the Z-score plot and threshold lines (red for short entry, green for long entry, orange dotted for exits) to identify potential trade setups.
Check the p-value table in the top-left corner to assess the statistical significance of the current Z-score.
Use this data to inform mean-reversion trading decisions, ideally in conjunction with other indicators.
Notes
A Z-score above the entry threshold (positive) or below the negative entry threshold suggests a potential short or long entry, respectively. Exits are signaled when the Z-score crosses the exit thresholds.
The p-value is an approximation based on the normal distribution; a value below 0.05 typically indicates statistical significance, but further validation is recommended.
The indicator uses a simple spread (Asset A - Asset B) without volatility adjustments; consider pairing it with a lots calculator for hedging.
Limitations
The p-value is an approximation and may not reflect advanced statistical tests (e.g., ADF) due to Pine Script constraints.
No automatic trading signals are generated; it provides data for manual analysis.
Author
Developed by grogusama, October 15, 2025, 07:29 PM CEST.
NY 4H Wyckoff State Machine [CHE] NY 4H Wyckoff State Machine — Full (Re-Entry, Breakout, Wick, Re-Accum/Distrib, Dynamic Table) — One-Candle Wyckoff Re-Entry (OCWR)
Summary
OCWR operationalizes a one-candle session workflow: mark the first four-hour New York candle, fix its high and low as the session range when the window closes, and drive entries through a Wyckoff-style state machine on intraday bars. The script adds an ATR-scaled buffer around the range and requires multi-bar acceptance before treating breaks or re-entries as valid. Optional wick-cluster evidence, a proximity retest, and simple volume or RSI gates increase selectivity. Background tints expose regimes, shapes mark events, a dynamic table explains the current state, and hidden plots supply alert payloads. The design reduces random flips and makes state transitions auditable without higher-timeframe calls.
Origin and name
Method name: One-Candle Wyckoff Re-Entry (OCWR)
Transcript origin: The source idea is a “stupid simple one-candle scalping” routine: mark the first New York four-hour candle (commonly between one and five in the morning New York time), drop to five minutes, observe accumulation inside, wait for a manipulation move outside, then trade the re-entry back inside. Stops go beyond the excursion extreme; targets are either a fixed reward multiple or the opposite side of the range. Preference is given to several manipulation candles. This indicator codifies that workflow with explicit states, acceptance counters, buffers, and optional quality filters. Any external performance claims are not part of the code.
Motivation: Why this design?
Session levels are widely respected, yet single-bar breaches around them are noisy. OCWR separates range discovery from trade logic. It locks the range at the end of the window, applies an ATR-scaled buffer to ignore marginal oversteps, and requires acceptance over several bars for breaks and re-entries. Wick evidence and optional retest proximity help confirm that an excursion likely cleared liquidity rather than launched a trend. This yields cleaner transitions from test to commitment.
What’s different vs. standard approaches?
Baseline: Static session lines or one-shot Wyckoff tags without process control.
Architecture: Dual long and short state machines; ATR-buffered edges; multi-bar acceptance for breaks and re-entries; optional wick dominance and cluster checks; optional retest tolerance; direct and opposite breakout paths; cooldown after fires; distribution timeout; dynamic table with highlighted row.
Practical effect: Fewer single-bar head-fakes, clearer hand-offs, and on-chart explanations of the machine’s view.
Wyckoff structure by example — OCWR on five minutes
One-candle setup:
On the four-hour chart, mark the first New York candle’s high and low, then switch to five minutes. Solid lines show the fixed range; dashed lines show ATR-buffered edges.
Long path (verbal mapping):
Phase A, Stopping Action: Price stabilizes inside the range.
Phase B, Consolidation: Sustained balance while the window is closed and after the range is fixed.
Phase C, Test (Spring): Excursion below the buffered low with preference for several outside bars and dominant lower wicks, then a return inside.
Re-entry acceptance: A required run of inside bars validates the test.
Phase D, Breakout to Markup: Long signal fires; stop beyond the excursion extreme; objective is the opposite range or a fixed reward multiple.
Phase E, Trend (Markup) and Re-Accumulation: Advance continues until target, stop, confirmation back against the box, or timeout. A pause inside trend may register as re-accumulation.
Short path mirrors the above: A UTAD-style move forms above the buffered high, then re-entry leads to Markdown and possible re-distribution.
Variant map (verbal):
Accumulation after a downtrend: with Spring and Test, or without Spring; both proceed to Markup and may pause in Re-Accumulation.
Distribution after an uptrend: with UTAD and Test, or without UTAD; both proceed to Markdown and may pause in Re-Distribution.
Note: Phases A through E occur within each variant and are not separate variants.
How it works (technical)
Session window: A configurable four-hour New York window records its high and low. At window end, the bounds are fixed for the session.
ATR buffer: A margin above and below the fixed range discourages triggers from tiny oversteps.
Inside and outside: Users choose close-based or wick-based detection. Overshoot requirements are expressed verbally as a fraction of the range with an optional absolute minimum.
Manipulation tracking: The machine counts bars spent outside and records the side extreme.
Re-entry acceptance: After a return inside, a specified number of inside bars must print before acceptance.
Direct and opposite breakouts: Direct breakouts from accumulation and opposite breakouts after manipulation are supported, subject to acceptance and optional filters.
Targets and exits: Choose the opposite boundary or a fixed reward multiple. Distribution ends on target, stop, confirmation back against the range, or timeout.
Context filters (optional): Volume above a scaled SMA, RSI thresholds, and a trend SMA for simple regime context.
Diagnostics: Background tints for regimes; arrows for re-entries; triangles for breakouts; table with row highlights; hidden plots for alert values.
Central table (Wyckoff console)
The table sits top-right and explains the machine’s stance. Columns: Structure label, plain-English description, active state pair for long and short, and human phase tags. Rows: Start and range building; accumulation branch with Spring and Test as well as direct breakout; Markup and re-accumulation; distribution branch with UTAD and Test as well as direct short breakout; Markdown and re-distribution. Only the active state cell is rewritten each last bar, for example “L_ACCUM slash S_ACCUM”. Row highlighting is context-aware: accumulation, Spring or UTAD, breakout, Markup or Markdown, and re-accumulation or re-distribution checks can highlight independently so users see simultaneous conditions. The table is created once, updated only on the last bar for efficiency, and functions as a read-only console to audit why a signal fired and where the path currently sits.
Parameter Guide
Session window and time zone: First four hours of New York by default; time zone “America/New_York”.
ATR length and buffer factor: Control buffer size; larger reduces sensitivity, smaller reacts faster.
Minimum overshoot (fraction and absolute): Demand meaningful extension beyond the buffer.
Break mode: Close-based is stricter; wick-based is more reactive.
Acceptance counts: Separate counts for break, re-entry, and opposite breakout; higher values reduce noise.
Minimum bars outside: Ensures manipulation is not a single spike.
Wick detection and clusters (optional): Dominance thresholds and cluster size within a short window.
Retest required and tolerance (optional): Gate re-entry by proximity to the buffered edge.
Volume and RSI filters (optional): Simple gates on activity and momentum.
TP mode and reward multiple: Opposite range or fixed multiple.
Cooldown and distribution timeout: Rate-limit signals and prevent endless distribution.
Visualization toggles: Background phases, labels, table, and helper lines.
Reading & Interpretation
Solid lines are the fixed session bounds; dashed lines are buffers. Backgrounds tint accumulation, manipulation, and distribution. Arrows show accepted re-entries; triangles show direct or opposite breakouts. Labels can summarize entry, stop, target, and risk. The table highlights the active row and the current state pair.
Practical Workflows & Combinations
OCWR baseline: Each morning, mark the New York four-hour candle, move to five minutes, prefer multi-bar manipulation outside, then wait for a qualified re-entry inside. Stop beyond the excursion extreme. Target the opposite range for conservative management or a fixed multiple for uniform sizing.
Trend following: Favor direct breakouts with trend alignment and no contradictory wick evidence.
Quality control: When noise rises, increase acceptance, raise the buffer factor, enable retest, and require wick clusters.
Discretionary confluences: Fair-value gaps and trend lines can be added by the user; they are not computed by this script.
Behavior, Constraints & Performance
Closed-bar confirmation is recommended when you require finality; live-bar conditions can change until close. The script does not call higher-timeframe data. It uses arrays, lines, labels, boxes, and a table; maximum bars back is five thousand; table updates are last-bar only. Known limits include compressed buffers in quiet sessions, unreliable wick evidence in thin markets, and session misalignment if the platform time zone is not New York.
Sensible Defaults & Quick Tuning
Start with ATR length fourteen, buffer factor near zero point fifteen, overshoot fraction near zero point ten, acceptance counts of two, minimum outside duration three, retest required on.
Too many flips: increase acceptance, raise buffer, enable retest, and tighten wick thresholds.
Too slow: reduce acceptance, lower buffer, switch to wick-based breaks, disable retest.
Noisy wicks: increase minimum wick ratio and cluster size, or disable wick detection.
What this indicator is—and isn’t
A session-anchored visualization and signal layer that formalizes a Wyckoff-style re-entry and breakout workflow derived from a single four-hour New York candle. It is not predictive and not a complete trading system. Use with structure analysis, risk controls, and position management.
Disclaimer
The content provided, including all code and materials, is strictly for educational and informational purposes only. It is not intended as, and should not be interpreted as, financial advice, a recommendation to buy or sell any financial instrument, or an offer of any financial product or service. All strategies, tools, and examples discussed are provided for illustrative purposes to demonstrate coding techniques and the functionality of Pine Script within a trading context.
Any results from strategies or tools provided are hypothetical, and past performance is not indicative of future results. Trading and investing involve high risk, including the potential loss of principal, and may not be suitable for all individuals. Before making any trading decisions, please consult with a qualified financial professional to understand the risks involved.
By using this script, you acknowledge and agree that any trading decisions are made solely at your discretion and risk.
Do not use this indicator on Heikin-Ashi, Renko, Kagi, Point-and-Figure, or Range charts, as these chart types can produce unrealistic results for signal markers and alerts.
Best regards and happy trading
Chervolino
MechArt ATR Box 12 V1.1MechArt ATR Box 12 V1.1 — Auto ATR Edition
Overview:
The MechArt ATR Box 12 is a precision visualization tool for tracking ATR-based trade levels across multiple tickers. It automatically plots your +1 ATR roll zone, -2 ATR stop, and -3 ATR emergency exit, providing a clear visual map of your trade’s range and time horizon.
Key Features:
Auto ATR on Entry Date: For each configured ticker, the indicator automatically pulls the historical ATR(14) value that matches your entry date — no manual ATR entry needed. This refreshes each time the ticker is revisited.
Smart Defaults for Other Tickers:
If a ticker isn’t listed in the code, the indicator defaults to your current price as the entry, calculates ATR live, and sets expiration 21 days out, aligned to the next Friday.
Multi-Ticker Setup (12 Slots):
You can predefine up to 12 tickers inside the code, each with its own entry price, entry date and expiration date. Once saved, the indicator recognizes and loads them automatically when you open that chart.
Customizable Appearance:
Adjustable opacity and colors for each ATR box
Line width, style, and transparency controls
DTE/ATR label with adjustable font size
Dynamic Labels:
Displays the remaining days to expiration (DTE) and the ATR value used for calculations.
Use Case:
Designed for swing traders and options traders managing multiple active tickers. Each ATR box visually represents your trade window — from entry through expiration — with clear risk and roll boundaries.
How It Works:
Simply open the code once and enter your 12 tickers, each with its entry date and price. The script handles ATR lookups and expiration alignment automatically. Any ticker not included will generate its own default 21-day box.
TradeVision Pro - Multi-Factor Analysis System═══════════════════════════════════════════════════════════════════
TRADEVISION PRO - MULTI-FACTOR ANALYSIS SYSTEM
Created by Zakaria Safri
═══════════════════════════════════════════════════════════════════
A comprehensive technical analysis tool combining multiple factors for
signal generation, trend analysis, and dynamic risk management visualization.
Designed for educational purposes to study multi-factor convergence trading
strategies across all markets and timeframes.
⚠️ IMPORTANT DISCLAIMER:
This indicator is provided for EDUCATIONAL and INFORMATIONAL purposes only.
It does NOT constitute financial advice, investment advice, or trading advice.
Past performance does not guarantee future results. Trading involves
substantial risk of loss. Always do your own research and consult a
financial advisor before making trading decisions.
🎯 KEY FEATURES
═══════════════════════════════════════════════════════════════════
✅ MULTI-FACTOR SIGNAL GENERATION
• Price Volume Trend (PVT) analysis
• Rate of Change (ROC) momentum confirmation
• Volume-Weighted Moving Average (VWMA) trend filter
• Simple Moving Average (SMA) price smoothing
• Signals only when all factors align
✅ DYNAMIC RISK VISUALIZATION (Educational Only)
• ATR-based stop loss calculation
• Risk-reward based take profit levels (1-5 targets)
• Visual lines and labels showing entry, SL, and TPs
• Automatically adapts to market volatility
• ⚠️ VISUAL REFERENCE ONLY - Does not execute trades
✅ SUPPORT & RESISTANCE DETECTION
• Automatic pivot-based level identification
• Red dashed lines for resistance zones
• Green dashed lines for support areas
• Helps identify key price levels
✅ VWMA TREND BANDS
• Volume-weighted moving average with standard deviation
• Color-changing bands (Green = Uptrend, Red = Downtrend)
• Filled band area for easy visualization
• Volume-confirmed trend strength
✅ TREND DETECTION SYSTEM
• Counting-based trend confirmation
• Three states: Up Trend, Down Trend, Ranging
• Requires threshold of consecutive bars
• Independent trend validation
✅ PRICE RANGE VISUALIZATION
• High/Low range lines showing market structure
• Filled area highlighting price volatility
• Helps identify breakout zones
✅ COMPREHENSIVE INFO TABLE
• Real-time trend status
• Last signal type (BUY/SELL)
• Entry price display
• Stop loss level
• All active take profit levels
• Clean, professional layout
✅ OPTIONAL FEATURES
• Bar coloring by trend direction
• Customizable alert notifications
• Toggle visibility for all components
• Fully configurable parameters
📊 HOW IT WORKS
═══════════════════════════════════════════════════════════════════
SIGNAL METHODOLOGY:
BUY SIGNAL generates when ALL conditions are met:
• Smoothed price > Moving Average (upward price trend)
• PVT > PVT Average (volume supporting uptrend)
• ROC > 0 (positive momentum)
• Close > VWMA (above volume-weighted average)
SELL SIGNAL generates when ALL conditions are met:
• Smoothed price < Moving Average (downward price trend)
• PVT < PVT Average (volume supporting downtrend)
• ROC < 0 (negative momentum)
• Close < VWMA (below volume-weighted average)
This multi-factor approach filters out weak signals and waits for
strong convergence before generating alerts.
RISK CALCULATION:
Stop Loss = Entry ± (ATR × SL Multiplier)
• Uses Average True Range for volatility measurement
• Automatically adjusts to market conditions
Take Profit Levels = Entry ± (Risk Distance × TP Multiplier × Level)
• Risk Distance = |Entry - Stop Loss|
• Creates risk-reward based targets
• Example: TP Multiplier 1.0 = 1:1, 2:2, 3:3 risk-reward
⚠️ NOTE: All risk levels are VISUAL REFERENCES for educational study.
They do not execute trades automatically.
⚙️ SETTINGS GUIDE
═══════════════════════════════════════════════════════════════════
SIGNAL SETTINGS:
• Signal Length (14): Main calculation period for averages
• Smooth Length (8): Price data smoothing period
• PVT Length (14): Price Volume Trend calculation period
• ROC Length (9): Rate of Change momentum period
RISK MANAGEMENT (Visual Only):
• ATR Length (14): Volatility measurement lookback
• SL Multiplier (2.2): Stop loss distance (× ATR)
• TP Multiplier (1.0): Risk-reward ratio per TP level
• TP Levels (1-5): Number of take profit targets to display
• Show TP/SL Lines: Toggle visual reference lines
SUPPORT & RESISTANCE:
• Pivot Lookback (10): Sensitivity for S/R detection
• Show SR: Toggle support/resistance lines
VWMA BANDS:
• VWMA Length (20): Volume-weighted average period
• Show Bands: Toggle band visibility
TREND DETECTION:
• Trend Threshold (5): Consecutive bars required for trend
PRICE LINES:
• Period (20): High/low calculation lookback
• Show: Toggle price range visualization
DISPLAY OPTIONS:
• Signals: Show/hide BUY/SELL labels
• Table: Show/hide information panel
• Color Bars: Enable trend-based bar coloring
ALERTS:
• Enable: Activate alert notifications for signals
💡 USAGE INSTRUCTIONS
═══════════════════════════════════════════════════════════════════
RECOMMENDED APPROACH:
• Works on all timeframes (1m to Monthly)
• Suitable for all markets (Stocks, Forex, Crypto, etc.)
• Best used with additional analysis and confirmation
• Always practice proper risk management
ENTRY STRATEGY:
1. Wait for BUY or SELL signal to appear
2. Check trend table for trend confirmation
3. Verify VWMA band color matches signal direction
4. Look for nearby support/resistance confluence
5. Consider entering on next candle open
6. Use visual SL level for risk management
EXIT STRATEGY:
1. Use TP levels as potential exit zones
2. Consider scaling out at multiple TP levels
3. Exit on opposite signal
4. Adjust stops as trade progresses
5. Account for spread and slippage
TREND TRADING:
• "Up Trend" → Focus on BUY signals
• "Down Trend" → Focus on SELL signals
• "Ranging" → Wait for clear trend or use range strategies
🎨 VISUAL ELEMENTS
═══════════════════════════════════════════════════════════════════
• GREEN VWMA BANDS → Bullish trend indication
• RED VWMA BANDS → Bearish trend indication
• ORANGE DASHED LINE → Entry price reference
• RED SOLID LINE → Stop loss level
• GREEN DOTTED LINES → Take profit targets
• RED DASHED LINES → Resistance levels
• GREEN DASHED LINES → Support levels
• GREY FILLED AREA → Price high/low range
• GREEN BUY LABEL → Long signal
• RED SELL LABEL → Short signal
• BLUE INFO TABLE → Current trade details
• GREEN/RED BARS → Trend direction (optional)
⚠️ IMPORTANT NOTES
═══════════════════════════════════════════════════════════════════
RISK WARNING:
• Trading involves substantial risk of loss
• You can lose more than your initial investment
• Past performance does not guarantee future results
• No indicator is 100% accurate
• Always use proper position sizing
• Never risk more than you can afford to lose
EDUCATIONAL PURPOSE:
• This tool is for learning and research
• Not a complete trading system
• Should be combined with other analysis
• Requires interpretation and context
• Test thoroughly before live use
• Consider consulting a financial advisor
TECHNICAL LIMITATIONS:
• Signals lag price action (all indicators lag)
• False signals occur in choppy markets
• Works better in trending conditions
• Support/resistance levels are approximate
• TP/SL levels are suggestions, not guarantees
📚 METHODOLOGY
═══════════════════════════════════════════════════════════════════
This indicator combines established technical analysis concepts:
• Price Volume Trend (PVT): Volume-weighted price momentum
• Rate of Change (ROC): Momentum measurement
• Volume-Weighted Moving Average (VWMA): Trend identification
• Average True Range (ATR): Volatility measurement (J. Welles Wilder)
• Pivot Points: Support/resistance detection
All methods are based on publicly available technical analysis
principles. No proprietary or "secret" algorithms are used.
⚖️ FULL DISCLAIMER
═══════════════════════════════════════════════════════════════════
LIABILITY:
The creator (Zakaria Safri) assumes NO liability for:
• Trading losses or damages of any kind
• Loss of capital or profits
• Incorrect signal interpretation
• Technical issues, bugs, or errors
• Any consequences of using this tool
USER RESPONSIBILITY:
By using this indicator, you acknowledge that:
• You are solely responsible for your trading decisions
• You understand the substantial risks involved
• You will not hold the creator liable for losses
• You will conduct your own research and analysis
• You may consult a licensed financial professional
• You are using this tool entirely at your own risk
AS-IS PROVISION:
This indicator is provided "AS IS" without warranty of any kind,
express or implied, including but not limited to warranties of
merchantability, fitness for a particular purpose, or non-infringement.
The creator is not a registered investment advisor, financial planner,
or broker-dealer. This tool is not approved or endorsed by any
financial authority.
📞 ABOUT THE CREATOR
═══════════════════════════════════════════════════════════════════
Created by: Zakaria Safri
Specialization: Technical analysis indicator development
Focus: Multi-factor analysis, risk visualization, trend detection
This is an educational tool designed to demonstrate technical
analysis concepts and multi-factor signal generation methods.
📋 VERSION INFO
═══════════════════════════════════════════════════════════════════
Version: 1.0
Platform: TradingView Pine Script v5
License: Mozilla Public License 2.0
Creator: Zakaria Safri
Year: 2024
═══════════════════════════════════════════════════════════════════
Study Carefully, Trade Wisely, Manage Risk Properly
TradeVision Pro - Educational Trading Tool
Created by Zakaria Safri
═══════════════════════════════════════════════════════════════════
Pro Scalper - Kalman Supertrend with Dynamic OB/OS Zones═══════════════════════════════════════════════════════════════════
PRO SCALPER - KALMAN SUPERTREND WITH DYNAMIC OB/OS ZONES
Developed by Zakaria Safri
═══════════════════════════════════════════════════════════════════
A powerful day trading and scalping indicator designed for the 30-minute
timeframe, combining advanced Kalman filtering with Supertrend analysis
and VWMA-based overbought/oversold detection for stocks and cryptocurrencies.
🎯 KEY FEATURES
═══════════════════════════════════════════════════════════════════
✅ Kalman-Filtered Supertrend
• Advanced noise reduction using Kalman Filter mathematics
• Reduces false signals by filtering market noise
• Adaptive trend-following with dynamic support/resistance
✅ Clear Buy/Sell Signals
• Green "BUY" labels for long entries
• Red "SELL" labels for short entries
• Signals trigger on confirmed trend reversals
• Matrix-style candle coloring (Green=Bull, Red=Bear)
✅ Dynamic Overbought/Oversold Zones
• VWMA-based adaptive zones
• Automatically adjusts to market volatility
• Visual zone highlighting with fills
✅ Reversal Signal Detection
• "R" markers identify potential reversals
• Vertical lines highlight reversal bars
• Based on price rejection from OB/OS zones
✅ Smart Take Profit System
• Automatic TP levels at OB/OS zones
• "X" markers when targets are hit
• Based on higher-high/lower-low logic
✅ Live Entry Price Table
• Shows current trend direction
• Displays last signal type (BUY/SELL)
• Real-time entry price tracking
✅ Comprehensive Alert System
• Buy/Sell signal alerts
• Reversal detection alerts
• Take profit hit notifications
• All alerts are non-repainting
📊 HOW IT WORKS
═══════════════════════════════════════════════════════════════════
1. KALMAN FILTER
The indicator applies Kalman filtering to price and ATR data, using
mathematical equations derived from Rudolf E. Kalman's work. This
advanced filtering technique:
• Smooths price data while maintaining responsiveness
• Removes outliers and reduces market noise
• Adapts to changing market conditions
• Improves signal accuracy and reliability
2. MODIFIED SUPERTREND
A customized Supertrend calculation that uses:
• Kalman-filtered HL2 price instead of raw prices
• Filtered ATR for volatility measurement
• Adaptive trailing bands that follow price
• Trend detection with minimal lag
3. VWMA DYNAMIC ZONES
Volume-Weighted Moving Average bands that:
• Calculate from highest/lowest prices over lookback period
• Adapt to current volatility and price range
• Identify true overbought/oversold conditions
• Provide logical take-profit targets
4. SIGNAL GENERATION
• BUY: When price breaks above Supertrend (trend flips bullish)
• SELL: When price breaks below Supertrend (trend flips bearish)
• REVERSAL: When price rejects from OB/OS zones
• TAKE PROFIT: When price reaches target zones or forms HH/LL
⚙️ SETTINGS GUIDE
═══════════════════════════════════════════════════════════════════
🔧 KALMAN FILTER SETTINGS
┌─────────────────────────────────────────────────────────────┐
│ Gain (0.7) → Higher = More responsive, Less smooth │
│ Momentum (0.3) → Higher = More momentum, Less filtering │
└─────────────────────────────────────────────────────────────┘
📈 SUPERTREND SETTINGS
┌─────────────────────────────────────────────────────────────┐
│ ATR Period (10) → Lookback for volatility calculation │
│ ATR Multiplier (3.0) → Distance of bands (lower = more sigs)│
└─────────────────────────────────────────────────────────────┘
📊 VWMA BANDS (OB/OS ZONES)
┌─────────────────────────────────────────────────────────────┐
│ VWMA Length (20) → Smoothing period │
│ Overbought Multiplier (1.5) → OB zone distance │
│ Oversold Multiplier (1.5) → OS zone distance │
│ Band Lookback (20) → Range calculation period │
└─────────────────────────────────────────────────────────────┘
💡 USAGE INSTRUCTIONS
═══════════════════════════════════════════════════════════════════
RECOMMENDED SETUP:
• Timeframe: 30 minutes (optimized for intraday trading)
• Markets: Stocks, Cryptocurrencies, Forex
• Risk Management: Always use stop losses
• Confirmation: Combine with volume and support/resistance
ENTRY SIGNALS:
1. Wait for BUY/SELL label to appear
2. Check trend direction (candle color)
3. Confirm entry on next candle open
4. Set stop loss below/above Supertrend line
EXIT SIGNALS:
1. Take profit at "X" markers
2. Exit on opposite signal
3. Exit on reversal "R" if against your position
4. Manual exit at predetermined R:R ratio
REVERSAL TRADING:
1. Wait for "R" marker in OB/OS zone
2. Confirm with candlestick pattern
3. Enter counter-trend trade
4. Target middle VWMA or opposite zone
🎨 VISUAL ELEMENTS
═══════════════════════════════════════════════════════════════════
• GREEN LINE → Bullish Supertrend (support)
• RED LINE → Bearish Supertrend (resistance)
• CYAN LINE → VWMA baseline
• RED ZONE → Overbought area
• GREEN ZONE → Oversold area
• GREEN CANDLES → Bullish trend active
• RED CANDLES → Bearish trend active
• BUY LABEL → Long entry signal
• SELL LABEL → Short entry signal
• R MARKER → Reversal signal
• X MARKER → Take profit hit
⚠️ IMPORTANT NOTES
═══════════════════════════════════════════════════════════════════
✓ NON-REPAINTING: All signals are confirmed on candle close
✓ BACKTESTING: Test on your specific market before live trading
✓ RISK MANAGEMENT: Use proper position sizing and stop losses
✓ MARKET CONDITIONS: Works best in trending and range-bound markets
✓ CONFLUENCE: Combine with other analysis for best results
⚡ Best Performance:
• Trending markets with clear momentum
• Moderate to high volatility environments
• 30-minute to 1-hour timeframes
• Liquid markets with tight spreads
⚠️ Avoid Using:
• During major news events (high slippage)
• In extremely choppy/sideways markets
• On illiquid assets with wide spreads
• Without proper risk management
📚 METHODOLOGY
═══════════════════════════════════════════════════════════════════
This indicator combines three proven technical analysis methods:
1. TREND FOLLOWING (Supertrend)
Captures major price movements and momentum
2. MEAN REVERSION (VWMA Zones)
Identifies extremes and potential reversals
3. NOISE FILTERING (Kalman)
Reduces false signals and improves accuracy
By integrating these approaches with volume weighting and adaptive
calculations, the Pro Scalper provides a comprehensive trading system
suitable for active traders and scalpers.
⚖️ DISCLAIMER
═══════════════════════════════════════════════════════════════════
This indicator is provided for educational and informational purposes
only. It does not constitute financial advice, and past performance
does not guarantee future results.
Trading carries substantial risk of loss and is not suitable for all
investors. Always:
• Do your own research and analysis
• Use proper risk management
• Never risk more than you can afford to lose
• Test thoroughly before live trading
• Consult a financial advisor if needed
The creator (Zakaria Safri) assumes no liability for trading losses
incurred using this indicator.
📞 ABOUT THE DEVELOPER
═══════════════════════════════════════════════════════════════════
Developer: Zakaria Safri
Specialization: Advanced algorithmic trading indicators
Focus: Noise reduction, signal filtering, and trend analysis
• Regular updates and improvements
• Community feedback integration
• Bug fixes and optimization
• Feature requests welcome
📋 VERSION INFO
═══════════════════════════════════════════════════════════════════
Version: 1.0
Created: 2024
License: Mozilla Public License 2.0
Author: Zakaria Safri
═══════════════════════════════════════════════════════════════════
Happy Trading! 📈
Developed with precision by Zakaria Safri
═══════════════════════════════════════════════════════════════════
CVD Candles + Divergence (Pane) [NIRALA]This indicator provides a powerful way to analyze market dynamics by visualizing Cumulative Volume Delta (CVD) as candlesticks and automatically detecting divergences between price and order flow. It is designed to help traders spot potential trend exhaustion and reversals that may not be apparent from price action alone.
Key Concepts
Cumulative Volume Delta (CVD): CVD is a running total of the difference between buying and selling volume from market orders. A rising CVD indicates aggressive buying, while a falling CVD indicates aggressive selling. Unlike price, which can be influenced by passive limit orders, CVD shows the raw intent of aggressive market participants.
Divergence: A divergence occurs when price and CVD move in opposite directions. This signals a potential conflict between price action and the underlying order flow, often preceding a reversal.
Bearish Divergence: Price makes a new high, but CVD fails to make a new high (or makes a lower high). This suggests buying aggression is weakening despite the higher price, and a reversal to the downside may be imminent.
Bullish Divergence: Price makes a new low, but CVD fails to make a new low (or makes a higher low). This suggests selling pressure is drying up, and a reversal to the upside may be coming.
Features
CVD as Candlesticks: Plots CVD in a familiar OHLC candlestick format in a separate pane, providing a more intuitive view of order flow momentum and volatility compared to a simple line.
Automatic Divergence Detection: The script automatically identifies classic bullish and bearish divergences between price pivots and CVD pivots, drawing lines on both the main price chart and the indicator pane to clearly highlight them.
Multi-Timeframe Analysis: Calculates CVD from a user-defined lower timeframe, offering a more granular and precise view of the order flow that builds up a single candle on your chart.
Customizable Pivot Lookbacks: Allows you to adjust the sensitivity of the pivot detection for finding both short-term and long-term divergences.
Alerts: Includes built-in alerts that can notify you when a new bullish or bearish divergence is confirmed.
How to Use
Look for High-Probability Setups: This indicator is most powerful when its signals appear at key areas of support or resistance. A divergence at a major price level is a much stronger signal than one in the middle of a range.
Confirm with Price Action: Do not trade on a divergence signal alone. Wait for a confirmation candle (e.g., a bearish engulfing candle after a bearish divergence, or a bullish hammer after a bullish divergence) before considering an entry.
Combine with Your Strategy: Use this indicator as a confirmation tool to enhance your existing trading strategy. For example, if your primary strategy gives a sell signal and this indicator simultaneously prints a bearish divergence, it significantly increases the probability of the trade.
This tool is designed for discretionary traders looking to add a layer of order flow analysis to their decision-making process.
Multi Timeframe Market Structure ContinuationOverview
This indicator identifies Break of Structure (BOS) and Change of Character (ChoCh) patterns using multi-timeframe (MTF) analysis to filter high-probability trade setups. By aligning lower timeframe signals with higher timeframe bias, it helps traders enter positions in the direction of the dominant trend while avoiding counter-trend traps.
Multi-Timeframe Analysis
The indicator analyzes market structure on two timeframes simultaneously:
Current Timeframe (CTF): Detects immediate BOS and ChoCh signals for entry timing
Higher Timeframe (HTF): Establishes the overall trend direction (default: 1H, customizable)
Signals only appear when the current timeframe structure aligns with the higher timeframe bias, ensuring you're trading with the momentum, not against it.
Break of Structure (BOS)
BOS signals indicate trend continuation - when price breaks a previous high in an uptrend or a previous low in a downtrend. These are reliable entries that confirm the trend is still active and strong.
Change of Character (ChoCh)
ChoCh signals mark early trend reversals - when market structure shifts from bearish to bullish (or vice versa). When captured in alignment with the higher timeframe trend, ChoCh entries can achieve exceptional risk-to-reward ratios as they allow entry near the beginning of a new impulse move.
Exit Signals
Exit signals are plotted when a ChoCh occurs in the opposite direction of the HTF trend. For example, if the HTF is bullish and a bearish ChoCh forms on the current timeframe, an orange "EXIT" signal appears - warning long traders that the lower timeframe structure is shifting against them. This provides an early warning system to protect profits or minimize losses before the HTF trend itself reverses.
Trading Strategy Recommendations
Trending Markets (Recommended)
In strong trending conditions, both BOS and ChoCh signals can be taken when aligned with the HTF bias. ChoCh entries are particularly powerful as they catch early reversals within the larger trend, offering entries with tight stop losses and extended profit targets.
Ranging Markets
During consolidation or choppy conditions, it's best to be selective and take only BOS entries. BOS signals confirm that the trend is continuing beyond the range, reducing false breakouts and whipsaw trades that are common with counter-trend ChoCh signals in sideways markets.
Customization
Pivot Length: Adjust the sensitivity of structure detection (default: 5). Lower values detect structure more frequently with earlier but potentially noisier signals. Higher values provide cleaner, more significant structural breaks but with some delay.
Higher Timeframe: Customize the HTF to suit your trading style. Day traders might use 1H HTF on 5m charts, while swing traders could use 4H or Daily HTF.
Alert System
Six alert conditions available:
Long BOS Entry / Long ChoCh Entry
Short BOS Entry / Short ChoCh Entry
Long Exit / Short Exit
All alerts fire only on confirmed candle closes to eliminate repainting and false signals.
Visual Features
Color-coded background showing HTF bias
Clear BOS/ChoCh labels with horizontal lines at structure levels
Orange "EXIT" signals when structure breaks against your position
Gray lines tracking current swing highs/lows
HTF trend indicator in the top-right corner
Dynamic ATR BandsDescription:
The Dynamic ATR Bands indicator visualizes ATR-based stop-loss, take-profit, and trailing levels. Bands can be drawn relative to a fixed entry price or dynamically relative to the current price. It is ideal for trend-following, swing trading, and hybrid strategies, especially on volatile or noisy instruments.
Key Features:
Base ATR Bands:
Plots ATR-based bands above and below a reference price.
Acts as initial stop-loss or target guidance.
Adjustable multiplier (default 1× ATR).
Extra ATR Band:
Add an additional ATR band at a custom multiplier.
Position it above or below the reference price.
Useful for trailing stops or extended profit targets.
Hybrid Entry Mode:
Use Fixed Entry Price: bands are drawn relative to your entry and remain fixed.
Dynamic Mode: bands behave like standard ATR bands, moving with the current price.
Allows visualization of hybrid ATR stop-loss and trailing strategies.
Clean Visuals:
Color-coded bands differentiate base (solid) from extra (semi-transparent).
How to Use:
Set ATR length and multipliers according to your strategy.
Toggle hybrid entry mode and input your entry price, or leave off for dynamic bands.
Set the extra band multiplier and choose its position (upper/lower).
Use the bands as visual guides for stop-loss, take-profit, and trailing levels.
Inputs:
ATR Length: number of periods for ATR calculation
Base ATR Multiplier: distance of base bands from reference price
Extra ATR Multiplier: distance for the additional band
Extra Band Position: choose Upper or Lower
Use Fixed Entry Price: toggle hybrid entry mode
Entry Price: specify entry price if hybrid mode is enabled
Note:
This script is visual only; it does not place trades. It is designed to help plan ATR-based stop-loss, take-profit, and hybrid trade management visually on the chart.
Daytrade Forex Scalper TwinPulse Auction Timer IndicatorWhat this indicator is
TwinPulse Auction Timer is a multi component execution aid designed for liquid markets. It looks for two families of opportunities
Breakouts that leave a compression area after a fresh sweep
Reversals that trigger after a sweep with strong wick polarity
It does not try to predict future prices. It measures present auction conditions with transparent rules and shows you when those conditions align. You get a simple table that says LONG SHORT or WAIT, optional session shading, clean entry and exit level visuals, and alerts you can wire to your workflow.
Why it is different
Most tools show a single signal. TwinPulse combines several independent signals into an Edge Score that you can tune. The components are
• Pulse. A signed measure of wick asymmetry with candle body direction
• Compression. Current true range compared with an average range
• Sweep timer. Bars elapsed since the most recent sweep of a prior high or low
• Bias. Direction of a higher timeframe candle
• Regime. Efficiency ratio and the relation of micro to macro volatility
• Location. Distance from the daily anchored VWAP
• Session. London and New York filter by time windows
Each component is visible in the inputs and in the table so you can understand why a suggestion appears. The script uses request.security() with lookahead off in all calls so it does not peek into the future. Shapes may move while a bar is open since price is still forming. They stop moving when the bar closes.
What you will see on the chart
• L and S shapes on entry bars
• An Exit shape at the price where a stop or the runner target would have been hit
• Four horizontal lines while a trade is active
Entry
Stop
TP1 at one R
TP2 at the runner target expressed in R
• Labels anchored to each line so you can instantly read Entry SL TP1 and TP2 with current values
• Optional shading during your session windows
• Optional daily VWAP line
The table in the top right shows
Action LONG SHORT IN LONG IN SHORT or WAIT
Session ON or OFF
Bias UP DOWN or FLAT
Pulse value
Compression value
Edge L percent and Edge S percent
How it works in detail
Pulse
For each bar the script measures up wick minus down wick divided by range and multiplies that by the sign of the candle body. The result is averaged with pulse_len. Positive numbers indicate aggressive buying. Negative numbers indicate aggressive selling. You control the minimum absolute value with pulse_thr.
Compression
Compression is the ratio of current range to an average range. You can choose the range basis. HL SMA uses simple high minus low smoothed by range_len. ATR uses classic True Range smoothed by atr_len. Values below comp_thr indicate a coil.
Sweeps and the timer
A sweep occurs when price trades beyond the highest high or lowest low seen in the previous sweep_len bars. A strict sweep requires a close back inside that prior range. The timer measures how many bars have elapsed since the last sweep. Breakout setups require the timer to exceed timer_thr.
Bias on a confirmation timeframe
A higher timeframe candle is read with confirm_tf. If close is above open bias is UP. If close is below open bias is DOWN. This keeps breakouts aligned with the prevailing drift.
Regime filters
Efficiency ratio measures the straight line change over the sum of absolute bar to bar changes over er_len. It rises in trendy conditions and falls in noise. Minimum efficiency is controlled by er_min.
Micro to macro volatility ratio compares a short lookback average range with a longer lookback average range using your chosen basis. For breakouts you usually want micro volatility to be near or above macro hence mvr_min. For reversals you often want micro volatility that is not overheated relative to macro hence mvr_max_rev.
VWAP distance gate
Daily anchored VWAP is rebuilt from the open of each session. The script computes the absolute distance from VWAP in units of your average range and requires that distance to exceed vwap_dist_thr when use_vwap_gate is true. This keeps entries away from the mean.
Edge Score
Each gate contributes a weight that you control. The script sums weights of the satisfied gates and divides by the sum of all weights to produce an Edge percent for long and an Edge percent for short. You can then require a minimum Edge percent using edge_min_pct. This turns the indicator into a step by step checklist that you can tune to your taste.
Using the indicator step by step
Choose markets and timeframes
The logic is designed for liquid instruments. Major currency pairs, index futures and cash index CFDs, and the most liquid crypto pairs work well. On intraday use one to fifteen minutes for signals and fifteen to sixty minutes for confirmation. On swing use one hour to one day for signals and one day for confirmation.
Decide on entry mode
Breakouts require a compression area and a sweep timer. Reversals require a strict sweep and a strong pulse. If you are unsure leave the default which allows both.
Pick a range basis
For FX and crypto HL SMA is often stable. For indices and single name equities with gaps ATR can adapt better. If results look too reactive increase the window. If results are too slow reduce it.
Tune regime filters
If you trade trend continuation raise er_min and mvr_min. If you trade counter rotation lower them and rely on the reversal path with the strict sweep condition.
Set the VWAP gate
Enabling it helps you avoid entries at the mean. Push the threshold higher on range bound days. Reduce it in strong trend days.
Table driven decision
Watch Action and the Edge percents. If the script says WAIT you can read Pulse and Compression to see what is missing. Often the best trades appear when both Edge percents are well separated and your session switch is ON.
Use the visuals
When a suggestion triggers you will see entry stop and targets. You can mirror the levels in your own workflow or use alerts.
Consider bar close
Signals are computed in real time. For a strict process you can wait until the bar closes to reduce noise.
Inputs explained with quick guidance
Setup
Signal TF chooses where the logic is computed. Leave blank to use the chart.
Confirm TF sets the higher timeframe for bias.
Session filter restricts signals to the London and New York windows you specify.
Invert flips long and short. It is useful on inverse instruments.
Logic options
Entry mode allows Breakouts Reversals or Both.
Average range basis selects HL SMA or ATR.
ATR length is used when ATR is selected.
Pulse source can be Regular OHLC or Heikin Ashi. Heikin Ashi smooths noisy series, but the script still runs on regular bars and you should publish and use it on standard candles to respect the platform guidance.
Core numeric settings
Sweep lookback controls the size of the liquidity pool targeted by the sweep condition.
Pulse window smooths the wick polarity measure.
Average range window controls your base range when you use HL SMA.
Pulse threshold sets the minimum polarity required.
Compression threshold sets the maximum current range relative to average to consider the market coiled.
Expansion timer bars sets how much time has passed since the last sweep before you allow a breakout.
Regime filters
Efficiency ratio length and minimum value keep you out of aimless drift.
Micro and Macro range lengths feed the micro to macro ratio.
Minimum micro to macro for breakouts and maximum micro to macro for reversals steer the two entry families.
VWAP gate and distance threshold keep you away from the mean.
Levels and trade management visuals
Runner target in R sets TP2 as a multiple of initial risk.
Stop distance as average range multiple sets initial risk size for the visuals.
Move stop to entry after one R touch turns on break even logic once price has traveled one risk unit.
Trail buffer as R fraction uses the last sweep as an anchor and keeps a dynamic stop at a chosen fraction of R beyond it.
Cooldown after exit prevents immediate re entries.
Edge Score
Weights for pulse compression timer bias efficiency ratio micro to macro VWAP gate and session let you align the checklist with your style.
Minimum Edge percent to suggest applies a final filter to LONG or SHORT suggestions.
UI
Table and markers switch the compact dashboard and the shapes.
TP and SL lines and labels draw and name each level.
TP1 partial label percent is printed in the TP1 label for clarity.
Session shading helps with focus.
Daily VWAP line is optional.
Alerts
The script provides alerts for Long Short Exit and for Edge percent crossing the threshold on either side. Use them to drive notifications or to sync with webhooks and your broker integration. Alerts trigger in real time and will repaint during a bar. For conservative use trigger on bar close.
Recommended presets
Intraday trend continuation
Confirm TF fifteen minutes
Entry mode Breakouts
Range basis HL SMA
Pulse threshold near 0.10
Compression threshold near 0.60
Timer around 18
Minimum efficiency ratio near 0.20
Minimum micro to macro near 1.00
VWAP gate enabled with distance near 0.35
Edge minimum 50 or higher
Intraday mean reversion at sweeps
Entry mode Reversals
Pulse source Regular OHLC
Compression threshold can be a little higher
Maximum micro to macro near 1.60
Efficiency ratio minimum lower near 0.12
VWAP gate enabled
Edge minimum 40 to 60
Swing trend continuation
Signal TF one hour
Confirm TF one day
Range basis ATR
ATR length around 14
Average range window 20 to 30
Efficiency ratio minimum near 0.18
Micro to macro windows 12 and 60
Edge minimum 50 to 70
These are starting points only. Your instrument and timeframe will require small adjustments.
Limitations and honest warnings
No indicator is perfect. TwinPulse will mark attractive conditions that do not always lead to profitable trades. During economic releases or very thin liquidity the assumptions behind compression and sweeps may fail. In strong gap environments the HL SMA basis may lag while ATR may overreact. Heikin Ashi pulse can help in choppy markets but it will lag during sharp reversals. Session times use the exchange time of your chart. If you switch symbol or exchange verify the windows.
Edge percent is not a probability of profit. It is the fraction of satisfied gates with your chosen weights. Two traders can set different weights and see different Edge readings on the same bar. That is the design. The score is a guide that helps you act with discipline.
This indicator does not place orders or manage real risk. The lines and labels show a model entry a model stop and two model targets built from the average range at entry and from recent swing points. Use them as references and not as hard rules. Always test on historical data and demo first. Past results do not guarantee anything in the future.
Credits and originality
All code in this publication is original and written for this indicator. The concept of the efficiency ratio originates from Perry Kaufman. The use of a daily anchored volume weighted average price is a standard industry tool. The specific combination of pulse from wick polarity strict sweep timing compression and the tunable Edge Score is unique to this script at the time of publication. If you reuse parts of the open source code in your own work remember to credit the author and contribute meaningful improvements.
How to read the table at a glance
Action reflects your current state.
IN LONG or IN SHORT appears while a trade is active.
LONG or SHORT appears when conditions for entry are met and the Edge threshold is satisfied.
WAIT appears when at least one gate is missing.
Session shows ON during your chosen windows.
Bias shows the color of the confirmation candle.
Pulse is the smoothed polarity number.
Comp shows current range divided by the average range. Values below one mean compression.
Edge L percent and Edge S percent show the long and short checklists as percents.
Final thoughts
Markets move because orders accumulate at certain prices and at certain times. The indicator tries to measure two things that often matter at those turning points. One is the existence of a hidden imbalance revealed by wick polarity and by sweeps of prior extremes. The other is the presence of energy stored in a coil that can release in the direction of a drift. Neither force guarantees profit. Together they can improve your selection and your timing.
Use the defaults for a few days so you learn the personality of the signals. After that adjust one group at a time. Start with the session filter and the Edge threshold. Then tune compression and the timer. Finally adjust the regime filters. Keep notes. You will learn which weights matter for your market and timeframe. The result is a process you can apply with consistency.
Disclaimer
This script and description are for education and analysis. They are not investment advice and they do not promise future results. Use at your own risk. Test thoroughly on historical data and in simulation before considering any live use.
Trailing Stop + Profit TargetTrailing Stop + Exit Confirmation is a manual-entry tool designed to help traders visually manage trades with dynamic trailing stops and profit targets, based on ATR projections with a toggle button to reset calculations in real-time. Contains a “Short” toggle to work for short positions as well, which automatically inverses the PT and SL lines when toggled on.
Primary Calculations: Utilizes a manually adjustable entry price (default: $5 — ideal for options traders) that (when adjusted and recalculated) populates the chart with an adaptive ATR-based trailing stop line, dynamic profit target line, and optional 21-day EMA for directional context.
Below the Entry Price is a fully functional, manual reset toggle to reset all parameters mid-session to assess risk-reward based on entry price, risk tolerance, etc. followed by the “Short” toggle.
Primary Directions/Functions:
Enter your trade price in the “Manual Entry Price” field.
The script will begin plotting a dynamic trailing stop and profit target based on current market conditions.
Use the reset toggle to clear all calculations and start a new position at any time.
Customizable Settings:
ATR Length and Multiplier
Risk/Reward Profit Target Multiplier
Toggle to show/hide trailing stop, target, and EMA lines
Options Trading Use Case:
This tool is especially useful for options traders looking to manage premium-based entries (e.g., $5.00) on intraday or swing trades. The dynamic stop and target lines provide clear visual cues for scaling out or exiting based on price action, while allowing for tighter or looser risk depending on volatility (ATR).
This tool does not auto-detect entries or backtest positions. It is intended to complement your entry signals, not generate them. I've written an Options Momentum Signal indicator you can find right here which functions well in tandem with this tool.
Made for traders who execute trades manually and want typical preset guidelines for profit and stop loss signals but lets you recalculate them by simply clicking a button, especially if any major news or downturn causes a big change in market conditions so you can make adjustments in real time.
Stochastic Enhanced [DCAUT]█ Stochastic Enhanced
📊 ORIGINALITY & INNOVATION
The Stochastic Enhanced indicator builds upon George Lane's classic momentum oscillator (developed in the late 1950s) by providing comprehensive smoothing algorithm flexibility. While traditional implementations limit users to Simple Moving Average (SMA) smoothing, this enhanced version offers 21 advanced smoothing algorithms, allowing traders to optimize the indicator's characteristics for different market conditions and trading styles.
Key Improvements:
Extended from single SMA smoothing to 21 professional-grade algorithms including adaptive filters (KAMA, FRAMA), zero-lag methods (ZLEMA, T3), and advanced digital filters (Kalman, Laguerre)
Maintains backward compatibility with traditional Stochastic calculations through SMA default setting
Unified smoothing algorithm applies to both %K and %D lines for consistent signal processing characteristics
Enhanced visual feedback with clear color distinction and background fill highlighting for intuitive signal recognition
Comprehensive alert system covering crossovers and zone entries for systematic trade management
Differentiation from Traditional Stochastic:
Traditional Stochastic indicators use fixed SMA smoothing, which introduces consistent lag regardless of market volatility. This enhanced version addresses the limitation by offering adaptive algorithms that adjust to market conditions (KAMA, FRAMA), reduce lag without sacrificing smoothness (ZLEMA, T3, HMA), or provide superior noise filtering (Kalman Filter, Laguerre filters). The flexibility helps traders balance responsiveness and stability according to their specific needs.
📐 MATHEMATICAL FOUNDATION
Core Stochastic Calculation:
The Stochastic Oscillator measures the position of the current close relative to the high-low range over a specified period:
Step 1: Raw %K Calculation
%K_raw = 100 × (Close - Lowest Low) / (Highest High - Lowest Low)
Where:
Close = Current closing price
Lowest Low = Lowest low over the %K Length period
Highest High = Highest high over the %K Length period
Result ranges from 0 (close at period low) to 100 (close at period high)
Step 2: Smoothed %K Calculation
%K = MA(%K_raw, K Smoothing Period, MA Type)
Where:
MA = Selected moving average algorithm (SMA, EMA, etc.)
K Smoothing = 1 for Fast Stochastic, 3+ for Slow Stochastic
Traditional Fast Stochastic uses %K_raw directly without smoothing
Step 3: Signal Line %D Calculation
%D = MA(%K, D Smoothing Period, MA Type)
Where:
%D acts as a signal line and moving average of %K
D Smoothing typically set to 3 periods in traditional implementations
Both %K and %D use the same MA algorithm for consistent behavior
Available Smoothing Algorithms (21 Options):
Standard Moving Averages:
SMA (Simple): Equal-weighted average, traditional default, consistent lag characteristics
EMA (Exponential): Recent price emphasis, faster response to changes, exponential decay weighting
RMA (Rolling/Wilder's): Smoothed average used in RSI, less reactive than EMA
WMA (Weighted): Linear weighting favoring recent data, moderate responsiveness
VWMA (Volume-Weighted): Incorporates volume data, reflects market participation intensity
Advanced Moving Averages:
HMA (Hull): Reduced lag with smoothness, uses weighted moving averages and square root period
ALMA (Arnaud Legoux): Gaussian distribution weighting, minimal lag with good noise reduction
LSMA (Least Squares): Linear regression based, fits trend line to data points
DEMA (Double Exponential): Reduced lag compared to EMA, uses double smoothing technique
TEMA (Triple Exponential): Further lag reduction, triple smoothing with lag compensation
ZLEMA (Zero-Lag Exponential): Lag elimination attempt using error correction, very responsive
TMA (Triangular): Double-smoothed SMA, very smooth but slower response
Adaptive & Intelligent Filters:
T3 (Tilson T3): Six-pass exponential smoothing with volume factor adjustment, excellent smoothness
FRAMA (Fractal Adaptive): Adapts to market fractal dimension, faster in trends, slower in ranges
KAMA (Kaufman Adaptive): Efficiency ratio based adaptation, responds to volatility changes
McGinley Dynamic: Self-adjusting mechanism following price more accurately, reduced whipsaws
Kalman Filter: Optimal estimation algorithm from aerospace engineering, dynamic noise filtering
Advanced Digital Filters:
Ultimate Smoother: Advanced digital filter design, superior noise rejection with minimal lag
Laguerre Filter: Time-domain filter with N-order implementation, adjustable lag characteristics
Laguerre Binomial Filter: 6-pole Laguerre filter, extremely smooth output for long-term analysis
Super Smoother: Butterworth filter implementation, removes high-frequency noise effectively
📊 COMPREHENSIVE SIGNAL ANALYSIS
Absolute Level Interpretation (%K Line):
%K Above 80: Overbought condition, price near period high, potential reversal or pullback zone, caution for new long entries
%K in 70-80 Range: Strong upward momentum, bullish trend confirmation, uptrend likely continuing
%K in 50-70 Range: Moderate bullish momentum, neutral to positive outlook, consolidation or mild uptrend
%K in 30-50 Range: Moderate bearish momentum, neutral to negative outlook, consolidation or mild downtrend
%K in 20-30 Range: Strong downward momentum, bearish trend confirmation, downtrend likely continuing
%K Below 20: Oversold condition, price near period low, potential bounce or reversal zone, caution for new short entries
Crossover Signal Analysis:
%K Crosses Above %D (Bullish Cross): Momentum shifting bullish, faster line overtakes slower signal, consider long entry especially in oversold zone, strongest when occurring below 20 level
%K Crosses Below %D (Bearish Cross): Momentum shifting bearish, faster line falls below slower signal, consider short entry especially in overbought zone, strongest when occurring above 80 level
Crossover in Midrange (40-60): Less reliable signals, often in choppy sideways markets, require additional confirmation from trend or volume analysis
Multiple Failed Crosses: Indicates ranging market or choppy conditions, reduce position sizes or avoid trading until clear directional move
Advanced Divergence Patterns (%K Line vs Price):
Bullish Divergence: Price makes lower low while %K makes higher low, indicates weakening bearish momentum, potential trend reversal upward, more reliable when %K in oversold zone
Bearish Divergence: Price makes higher high while %K makes lower high, indicates weakening bullish momentum, potential trend reversal downward, more reliable when %K in overbought zone
Hidden Bullish Divergence: Price makes higher low while %K makes lower low, indicates trend continuation in uptrend, bullish trend strength confirmation
Hidden Bearish Divergence: Price makes lower high while %K makes higher high, indicates trend continuation in downtrend, bearish trend strength confirmation
Momentum Strength Analysis (%K Line Slope):
Steep %K Slope: Rapid momentum change, strong directional conviction, potential for extended moves but also increased reversal risk
Gradual %K Slope: Steady momentum development, sustainable trends more likely, lower probability of sharp reversals
Flat or Horizontal %K: Momentum stalling, potential reversal or consolidation ahead, wait for directional break before committing
%K Oscillation Within Range: Indicates ranging market, sideways price action, better suited for range-trading strategies than trend following
🎯 STRATEGIC APPLICATIONS
Mean Reversion Strategy (Range-Bound Markets):
Identify ranging market conditions using price action or Bollinger Bands
Wait for Stochastic to reach extreme zones (above 80 for overbought, below 20 for oversold)
Enter counter-trend position when %K crosses %D in extreme zone (sell on bearish cross above 80, buy on bullish cross below 20)
Set profit targets near opposite extreme or midline (50 level)
Use tight stop-loss above recent swing high/low to protect against breakout scenarios
Exit when Stochastic reaches opposite extreme or %K crosses %D in opposite direction
Trend Following with Momentum Confirmation:
Identify primary trend direction using higher timeframe analysis or moving averages
Wait for Stochastic pullback to oversold zone (<20) in uptrend or overbought zone (>80) in downtrend
Enter in trend direction when %K crosses %D confirming momentum shift (bullish cross in uptrend, bearish cross in downtrend)
Use wider stops to accommodate normal trend volatility
Add to position on subsequent pullbacks showing similar Stochastic pattern
Exit when Stochastic shows opposite extreme with failed cross or bearish/bullish divergence
Divergence-Based Reversal Strategy:
Scan for divergence between price and Stochastic at swing highs/lows
Confirm divergence with at least two price pivots showing divergent Stochastic readings
Wait for %K to cross %D in direction of anticipated reversal as entry trigger
Enter position in divergence direction with stop beyond recent swing extreme
Target profit at key support/resistance levels or Fibonacci retracements
Scale out as Stochastic reaches opposite extreme zone
Multi-Timeframe Momentum Alignment:
Analyze Stochastic on higher timeframe (4H or Daily) for primary trend bias
Switch to lower timeframe (1H or 15M) for precise entry timing
Only take trades where lower timeframe Stochastic signal aligns with higher timeframe momentum direction
Higher timeframe Stochastic in bullish zone (>50) = only take long entries on lower timeframe
Higher timeframe Stochastic in bearish zone (<50) = only take short entries on lower timeframe
Exit when lower timeframe shows counter-signal or higher timeframe momentum reverses
Zone Transition Strategy:
Monitor Stochastic for transitions between zones (oversold to neutral, neutral to overbought, etc.)
Enter long when Stochastic crosses above 20 (exiting oversold), signaling momentum shift from bearish to neutral/bullish
Enter short when Stochastic crosses below 80 (exiting overbought), signaling momentum shift from bullish to neutral/bearish
Use zone midpoint (50) as dynamic support/resistance for position management
Trail stops as Stochastic advances through favorable zones
Exit when Stochastic fails to maintain momentum and reverses back into prior zone
📋 DETAILED PARAMETER CONFIGURATION
%K Length (Default: 14):
Lower Values (5-9): Highly sensitive to price changes, generates more frequent signals, increased false signals in choppy markets, suitable for very short-term trading and scalping
Standard Values (10-14): Balanced sensitivity and reliability, traditional default (14) widely used,适合 swing trading and intraday strategies
Higher Values (15-21): Reduced sensitivity, smoother oscillations, fewer but potentially more reliable signals, better for position trading and lower timeframe noise reduction
Very High Values (21+): Slow response, long-term momentum measurement, fewer trading signals, suitable for weekly or monthly analysis
%K Smoothing (Default: 3):
Value 1: Fast Stochastic, uses raw %K calculation without additional smoothing, most responsive to price changes, generates earliest signals with higher noise
Value 3: Slow Stochastic (default), traditional smoothing level, reduces false signals while maintaining good responsiveness, widely accepted standard
Values 5-7: Very slow response, extremely smooth oscillations, significantly reduced whipsaws but delayed entry/exit timing
Recommendation: Default value 3 suits most trading scenarios, active short-term traders may use 1, conservative long-term positions use 5+
%D Smoothing (Default: 3):
Lower Values (1-2): Signal line closely follows %K, frequent crossover signals, useful for active trading but requires strict filtering
Standard Value (3): Traditional setting providing balanced signal line behavior, optimal for most trading applications
Higher Values (4-7): Smoother signal line, fewer crossover signals, reduced whipsaws but slower confirmation, better for trend trading
Very High Values (8+): Signal line becomes slow-moving reference, crossovers rare and highly significant, suitable for long-term position changes only
Smoothing Type Algorithm Selection:
For Trending Markets:
ZLEMA, DEMA, TEMA: Reduced lag for faster trend entry, quick response to momentum shifts, suitable for strong directional moves
HMA, ALMA: Good balance of smoothness and responsiveness, effective for clean trend following without excessive noise
EMA: Classic choice for trending markets, faster than SMA while maintaining reasonable stability
For Ranging/Choppy Markets:
Kalman Filter, Super Smoother: Superior noise filtering, reduces false signals in sideways action, helps identify genuine reversal points
Laguerre Filters: Smooth oscillations with adjustable lag, excellent for mean reversion strategies in ranges
T3, TMA: Very smooth output, filters out market noise effectively, clearer extreme zone identification
For Adaptive Market Conditions:
KAMA: Automatically adjusts to market efficiency, fast in trends and slow in congestion, reduces whipsaws during transitions
FRAMA: Adapts to fractal market structure, responsive during directional moves, conservative during uncertainty
McGinley Dynamic: Self-adjusting smoothing, follows price naturally, minimizes lag in trending markets while filtering noise in ranges
For Conservative Long-Term Analysis:
SMA: Traditional choice, predictable behavior, widely understood characteristics
RMA (Wilder's): Smooth oscillations, reduced sensitivity to outliers, consistent behavior across market conditions
Laguerre Binomial Filter: Extremely smooth output, ideal for weekly/monthly timeframe analysis, eliminates short-term noise completely
Source Selection:
Close (Default): Standard choice using closing prices, most common and widely tested
HLC3 or OHLC4: Incorporates more price information, reduces impact of sudden spikes or gaps, smoother oscillator behavior
HL2: Midpoint of high-low range, emphasizes intrabar volatility, useful for markets with wide intraday ranges
Custom Source: Can use other indicators as input (e.g., Heikin Ashi close, smoothed price), creates derivative momentum indicators
📈 PERFORMANCE ANALYSIS & COMPETITIVE ADVANTAGES
Responsiveness Characteristics:
Traditional SMA-Based Stochastic:
Fixed lag regardless of market conditions, consistent delay of approximately (K Smoothing + D Smoothing) / 2 periods
Equal treatment of trending and ranging markets, no adaptation to volatility changes
Predictable behavior but suboptimal in varying market regimes
Enhanced Version with Adaptive Algorithms:
KAMA and FRAMA reduce lag by up to 40-60% in strong trends compared to SMA while maintaining similar smoothness in ranges
ZLEMA and T3 provide near-zero lag characteristics for early entry signals with acceptable noise levels
Kalman Filter and Super Smoother offer superior noise rejection, reducing false signals in choppy conditions by estimations of 30-50% compared to SMA
Performance improvements vary by algorithm selection and market conditions
Signal Quality Improvements:
Adaptive algorithms help reduce whipsaw trades in ranging markets by adjusting sensitivity dynamically
Advanced filters (Kalman, Laguerre, Super Smoother) provide clearer extreme zone readings for mean reversion strategies
Zero-lag methods (ZLEMA, DEMA, TEMA) generate earlier crossover signals in trending markets for improved entry timing
Smoother algorithms (T3, Laguerre Binomial) reduce false extreme zone touches for more reliable overbought/oversold signals
Comparison with Standard Implementations:
Versus Basic Stochastic: Enhanced version offers 21 smoothing options versus single SMA, allowing optimization for specific market characteristics and trading styles
Versus RSI: Stochastic provides range-bound measurement (0-100) with clear extreme zones, RSI measures momentum speed, Stochastic offers clearer visual overbought/oversold identification
Versus MACD: Stochastic bounded oscillator suitable for mean reversion, MACD unbounded indicator better for trend strength, Stochastic excels in range-bound and oscillating markets
Versus CCI: Stochastic has fixed bounds (0-100) for consistent interpretation, CCI unbounded with variable extremes, Stochastic provides more standardized extreme readings across different instruments
Flexibility Advantages:
Single indicator adaptable to multiple strategies through algorithm selection rather than requiring different indicator variants
Ability to optimize smoothing characteristics for specific instruments (e.g., smoother for crypto volatility, faster for forex trends)
Multi-timeframe analysis with consistent algorithm across timeframes for coherent momentum picture
Backtesting capability with algorithm as optimization parameter for strategy development
Limitations and Considerations:
Increased complexity from multiple algorithm choices may lead to over-optimization if parameters are curve-fitted to historical data
Adaptive algorithms (KAMA, FRAMA) have adjustment periods during market regime changes where signals may be less reliable
Zero-lag algorithms sacrifice some smoothness for responsiveness, potentially increasing noise sensitivity in very choppy conditions
Performance characteristics vary significantly across algorithms, requiring understanding and testing before live implementation
Like all oscillators, Stochastic can remain in extreme zones for extended periods during strong trends, generating premature reversal signals
USAGE NOTES
This indicator is designed for technical analysis and educational purposes to provide traders with enhanced flexibility in momentum analysis. The Stochastic Oscillator has limitations and should not be used as the sole basis for trading decisions.
Important Considerations:
Algorithm performance varies with market conditions - no single smoothing method is optimal for all scenarios
Extreme zone signals (overbought/oversold) indicate potential reversal areas but not guaranteed turning points, especially in strong trends
Crossover signals may generate false entries during sideways choppy markets regardless of smoothing algorithm
Divergence patterns require confirmation from price action or additional indicators before trading
Past indicator characteristics and backtested results do not guarantee future performance
Always combine Stochastic analysis with proper risk management, position sizing, and multi-indicator confirmation
Test selected algorithm on historical data of specific instrument and timeframe before live trading
Market regime changes may require algorithm adjustment for optimal performance
The enhanced smoothing options are intended to provide tools for optimizing the indicator's behavior to match individual trading styles and market characteristics, not to create a perfect predictive tool. Responsible usage includes understanding the mathematical properties of selected algorithms and their appropriate application contexts.
Exciting Candles by BitcoinBailyExciting Candles by BitcoinBaily — is a custom indicator that visually highlights "momentum" or "exciting" candlesticks on the chart.
It helps traders quickly identify candles with strong body-to-range ratios, i.e., candles showing strong price momentum (big move between open and close relative to the high-low range).
If the candle’s body is greater than or equal to the threshold percentage (say 85%), the bar is colored yellow. Otherwise, no color is applied.
Yellow Candle = Exciting Candle
The candle’s body occupies ≥ the set % (e.g., 85%) of the total high-low range.
Indicates strong momentum (buyers or sellers dominated most of that period).
No Color = Neutral / Normal Candle
Price moved both ways (upper & lower wicks), but neither buyers nor sellers fully dominated.
1. Range Breakout: When price breaks a sideways range and a yellow (exciting) candle appears,
it confirms that real momentum has entered — a good time to catch the move early.
2. Trend Pullback: If price dips to a moving average (like 20 or 50 SMA) and then forms a yellow
candle, it signals that buyers are regaining control — often a high-probability trend
continuation entry.
3. Exhaustion Top: A yellow bearish candle near a resistance area shows strong selling pressure
— a warning that the uptrend may be ending.
4. Sideways Market: When no yellow candles appear, the market lacks momentum — best to
stay out and avoid choppy trades.


