ATR Stop-Loss with Fibonacci Take-Profit [jpkxyz]ATR Stop-Loss with Fibonacci Take-Profit Indicator
This comprehensive indicator combines Average True Range (ATR) volatility analysis with Fibonacci extensions to create dynamic stop-loss and take-profit levels. It's designed to help traders set precise risk management levels and profit targets based on market volatility and mathematical ratios.
Two Operating Modes
Default Mode (Rolling Levels)
In default mode, the indicator continuously plots evolving stop-loss and take-profit levels based on real-time price action. These levels update dynamically as new bars form, creating rolling horizontal lines across the chart. I use this mode primarily to plot the rolling ATR-Level which I use to trail my Stop-Loss into profit.
Characteristics:
Levels recalculate with each new bar
All selected Fibonacci levels display simultaneously
Uses plot() functions with trackprice=true for price tracking
Custom Anchor Mode (Fixed Levels)
This is the primary mode for precision trading. You select a specific timestamp (typically your entry bar), and the indicator locks all calculations to that exact moment, creating fixed horizontal lines that represent your actual trade levels.
Characteristics:
Entry line (blue) marks your anchor point
Stop-loss calculated using ATR from the anchor bar
Fibonacci levels projected from entry-to-stop distance
Lines terminate when price breaks through them
Includes comprehensive alert system
Core Calculation Logic
ATR Stop-Loss Calculation:
Stop Loss = Entry Price ± (ATR × Multiplier)
Long positions: SL = Entry - (ATR × Multiplier)
Short positions: SL = Entry + (ATR × Multiplier)
ATR uses your chosen smoothing method (RMA, SMA, EMA, or WMA)
Default multiplier is 1.5, adjustable to your risk tolerance
Fibonacci Take-Profit Projection:
The distance from entry to stop-loss becomes the base unit (1.0) for Fibonacci extensions:
TP Level = Entry + (Entry-to-SL Distance × Fibonacci Ratio)
Available Fibonacci Levels:
Conservative: 0.618, 1.0, 1.618
Extended: 2.618, 3.618, 4.618
Complete range: 0.0 to 4.764 (23 levels total)
Multi-Timeframe Functionality
One of the indicator's most powerful features is timeframe flexibility. You can analyze on one timeframe while using stop-loss and take-profit calculations from another.
Best Practices:
Identify your entry point on execution timeframe
Enable "Custom Anchor" mode
Set anchor timestamp to your entry bar
Select appropriate analysis timeframe
Choose relevant Fibonacci levels
Enable alerts for automated notifications
Example Scenario:
Analyse trend on 4-hour chart
Execute entry on 5-minute chart for precision
Set custom anchor to your 5-minute entry bar
Configure timeframe setting to "4h" for swing-level targets
Select appropriate Fibonacci Extension levels
Result: Precise entry with larger timeframe risk management
Visual Intelligence System
Line Behaviour in Custom Anchor Mode:
Active levels: Lines extend to the right edge
Hit levels: Lines terminate at the breaking bar
Entry line: Always visible in blue
Stop-loss: Red line, terminates when hit
Take-profits: Green lines (1.618 level in gold for emphasis)
Customisation Options:
Line width (1-4 pixels)
Show/hide individual Fibonacci levels
ATR length and smoothing method
ATR multiplier for stop-loss distance
Поиск скриптов по запросу "entry"

BK AK-SILENCER (P8N)🚨Introducing BK AK-SILENCER (P8N) — Institutional Order Flow Tracking for Silent Precision🚨
After months of meticulous tuning and refinement, I'm proud to unleash the next weapon in my trading arsenal—BK AK-SILENCER (P8N).
🔥 Why "AK-SILENCER"? The True Meaning
Institutions don’t announce their moves—they move silently, hidden beneath the noise. The SILENCER is built specifically to detect and track these stealth institutional maneuvers, giving you the power to hunt quietly, execute decisively, and strike precisely before the market catches on.
🔹 "AK" continues the legacy, honoring my mentor, A.K., whose teachings on discipline, precision, and clarity form the cornerstone of my trading.
🔹 "SILENCER" symbolizes the stealth aspect of institutional trading—quiet but deadly moves. This indicator equips you to silently track, expose, and capitalize on their hidden footprints.
🧠 What Exactly is BK AK-SILENCER (P8N)?
It's a next-generation Cumulative Volume Delta (CVD) tool crafted specifically for traders who hunt institutional order flow, combining adaptive volatility bands, enhanced momentum gradients, and precise divergence detection into a single deadly-accurate weapon.
Built for silent execution—tracking moves quietly and trading with lethal precision.
⚙️ Core Weapon Systems
✅ Institutional CVD Engine
→ Dynamically measures hidden volume shifts (buying/selling pressure) to reveal institutional footprints that price alone won't show.
✅ Adaptive AK-9 Bollinger Bands
→ Bollinger Bands placed around a custom CVD signal line, pinpointing exactly when institutional accumulation or distribution reaches critical extremes.
✅ Gradient Momentum Intelligence
→ Color-coded momentum gradients reveal the strength, speed, and silent intent behind institutional order flow:
🟢 Strong Bullish (aggressive buying)
🟡 Moderate Bullish (steady accumulation)
🔵 Neutral (balance)
🟠 Moderate Bearish (quiet distribution)
🔴 Strong Bearish (aggressive selling)
✅ Silent Divergence Detection
→ Instantly spots divergence between price and hidden volume—your earliest indication that institutions are stealthily reversing direction.
✅ Background Flash Alerts
→ Visually highlights institutional extremes through subtle background flashes, alerting you quietly yet powerfully when market-moving players make their silent moves.
✅ Structural & Institutional Clarity
→ Optional structural pivots, standard deviation bands, volume profile anchors, and session lines clearly identify the exact levels institutions defend or attack silently.
🛡️ Why BK AK-SILENCER (P8N) is Your Edge
🔹 Tracks Institutional Footprints—Silently identifies hidden volume signals of institutional intentions before they’re obvious.
🔹 Precision Execution—Cuts through noise, allowing you to execute silently, confidently, and precisely.
🔹 Perfect for Traders Using:
Elliott Wave
Gann Methods (Angles, Squares)
Fibonacci Time & Price
Harmonic Patterns
Market Profile & Order Flow Analysis
🎯 How to Use BK AK-SILENCER (P8N)
🔸 Institutional Reversal Hunting (Stealth Mode)
Bearish divergence + CVD breaking below lower BB → stealth short signal.
Bullish divergence + CVD breaking above upper BB → quiet, early long entry.
🔸 Momentum Confirmation (Silent Strength)
Strong bullish gradient + CVD above upper BB → follow institutional buying quietly.
Strong bearish gradient + CVD below lower BB → confidently short institutional selling.
🔸 Noise Filtering (Patience & Precision)
Neutral gradient (blue) → remain quiet, wait patiently to strike precisely when institutional activity resumes.
🔸 Structural Precision (Institutional Levels)
Optional StdDev, POC, Value Areas, Session Anchors clearly identify exact institutional defense/offense zones.
🙏 Final Thoughts
Institutions move in silence, leaving subtle footprints. BK AK-SILENCER (P8N) is your specialized weapon for tracking and hunting their quiet, decisive actions before the market reacts.
🔹 Dedicated in deep gratitude to my mentor, A.K.—whose silent wisdom shapes every line of code.
🔹 Engineered for the disciplined, quiet hunter who knows when to wait patiently and when to strike decisively.
Above all, honor and gratitude to Gd—the ultimate source of wisdom, clarity, and disciplined execution. Without Him, markets are chaos. With Him, we move silently, purposefully, and precisely.
⚡ Stay Quiet. Stay Precise. Hunt Silently.
🔥 BK AK-SILENCER (P8N) — Track the Silent Moves. Strike with Precision. 🔥
May Gd bless every silent step you take. 🙏

Boomerang Trading Indicator# Boomerang News Trading Indicator
## Overview
The Boomerang Trading Indicator is designed to identify potential reversal opportunities following major economic news releases. This indicator analyzes the initial market reaction to news events and provides visual cues for potential counter-trend trading opportunities based on Fibonacci retracement levels.
## How It Works
### News Event Detection
- Automatically detects major news release times (NFP, CPI, FOMC, etc.)
- Analyzes the first significant price movement following news releases
- Requires minimum candle size threshold to filter out weak reactions
### First Move Analysis
The indicator employs multiple analytical methods to determine the initial market direction:
**Simple Analysis (High Confidence):**
- When the news candle has ≥70% body-to-total ratio, uses straightforward bullish/bearish classification
**Advanced Analysis (Complex Cases):**
- Volume-weighted direction analysis
- Momentum and wick pattern analysis
- Market structure and gap analysis
- Weighted voting system combining all methods
### Entry Signal Generation
Based on the "boomerang" concept where markets often reverse after initial news reactions:
**For Bullish First Moves (Price Up Initially):**
- Generates SHORT entry signals when price retraces to 1.25-1.5 Fibonacci levels
- Visual: Red triangles above price bars
**For Bearish First Moves (Price Down Initially):**
- Generates LONG entry signals when price retraces to -0.25 to -0.5 Fibonacci levels
- Visual: Green triangles below price bars
## Key Features
### Visual Elements
- **Fibonacci Levels**: Displays key retracement levels based on the initial reaction range
- **Entry Zones**: Clear visual marking of optimal entry areas
- **Direction Arrows**: Shows the initial market reaction direction
- **Target Levels**: Displays profit target zones at 50% and 100% retracement levels
### Information Panel
Real-time display showing:
- Current setup status
- First move direction and body percentage
- Recommended trade direction
- Key price levels (reaction high/low)
- Profit targets with historical success rates
### Alert System
- Pre-news warnings (customizable timing)
- News event notifications
- Setup activation alerts
- Entry signal notifications
### Success Tracking
- Visual "BOOM!" animations when targets are hit
- Target 1 (50% level): ~95% historical success rate
- Target 2 (Main target): ~80% historical success rate
## Configuration Options
### Time Settings
- News release hour and minute (customizable for different events)
- Pre-news alert timing
- Setup duration (default 60 bars after news)
### Fibonacci Levels
- Adjustable retracement percentages
- Customizable target levels
- Mid-level importance weighting
### Risk Management
- Minimum reaction candle size filter
- Maximum risk point setting
- Visual risk/reward display
### Display Options
- Toggle Fibonacci level visibility
- Toggle target level display
- Toggle animation effects
- Customizable alert preferences
## Applicable News Events
This indicator is designed for high-impact economic releases:
- Non-Farm Payrolls (NFP) - First Friday, 8:30 AM ET
- Consumer Price Index (CPI) - Monthly, 8:30 AM ET
- Producer Price Index (PPI) - Monthly, 8:30 AM ET
- Gross Domestic Product (GDP) - Quarterly, 8:30 AM ET
- FOMC Interest Rate Decisions - 8 times yearly, 2:00 PM ET
## Trading Strategy Framework
### Core Principle
Markets often overreact to news initially, then reverse toward more rational price levels. This "boomerang effect" creates short-term trading opportunities.
### Entry Strategy
1. Wait for significant initial reaction (>10 points minimum)
2. Identify the initial direction using multi-factor analysis
3. Trade opposite to the initial reaction when price reaches sweet spot zones
4. Use Fibonacci retracement levels as entry triggers
### Risk Management
- Always use appropriate position sizing
- Set stop losses beyond recent swing levels
- Consider market volatility and news importance
- Monitor for setup invalidation signals
## Important Notes
### Educational Purpose
This indicator is for educational and analytical purposes. Users should:
- Thoroughly test strategies in demo environments
- Understand the risks involved in news trading
- Consider market conditions and volatility
- Use proper risk management techniques
### Market Considerations
- High volatility during news events increases both opportunity and risk
- Spreads may widen significantly during news releases
- Different brokers may have varying execution conditions
- Economic calendar timing may vary between sources
### Limitations
- Past performance does not guarantee future results
- Market conditions can change, affecting strategy effectiveness
- News events may have unexpected outcomes affecting normal patterns
- Technical analysis should be combined with fundamental analysis
## Version Information
- Compatible with TradingView Pine Script v5
- Designed for 1-minute timeframe optimal performance
- Works on major forex pairs, indices, and commodities
- Regular updates based on market condition changes
---
**Disclaimer:** This indicator is provided for educational purposes only. Trading involves substantial risk and is not suitable for all investors. Past performance is not indicative of future results. Users should conduct their own research and consider their financial situation before making trading decisions.

Future is hereOverview
"Future is Here" is an original, multi-faceted Pine Script indicator designed to provide traders with a comprehensive toolset for identifying high-probability trading opportunities. By integrating volatility-based entry zones, trend-based price targets, momentum confirmation, dynamic support/resistance levels, and risk-reward ratio (RRR) calculations, this indicator offers a cohesive and actionable trading framework. Each feature is carefully designed to complement the others, ensuring a synergistic approach that enhances decision-making across various market conditions. This script is unique in its ability to combine these elements into a single, streamlined interface with clear visual cues and customizable alerts, making it suitable for both novice and experienced traders.
Key Features and How They Work Together
Volatility-Based Entry Zones
Purpose: Identifies overbought and oversold conditions using a volatility-adjusted moving average, helping traders spot potential reversal zones.
Mechanism: Utilizes a user-defined volatility length and multiplier to calculate dynamic overbought/oversold thresholds based on the standard deviation of price. Crossovers and crossunders of these levels trigger "Buy Zone" or "Sell Zone" labels.
Synergy: These zones act as the foundation for entry signals, which are later confirmed by momentum and trend filters to reduce false signals.
Trend-Based Price Targets
Purpose: Projects potential price targets based on the prevailing trend, giving traders clear objectives for profit-taking.
Mechanism: Combines a fast and slow moving average to determine trend direction, then calculates target prices using a multiplier of the price deviation from the slow MA. Labels display bullish or bearish targets when the fast MA crosses the slow MA.
Synergy: Works in tandem with entry zones and momentum signals to align targets with market conditions, ensuring traders aim for realistic price levels supported by trend strength.
Momentum Confirmation
Purpose: Validates entry signals by assessing momentum strength, filtering out weak setups.
Mechanism: Uses the momentum indicator to detect bullish or bearish momentum crossovers, labeling them as "Strong" or "Weak" based on a comparison with a smoothed momentum average.
Synergy: Enhances the reliability of buy/sell signals by ensuring momentum aligns with volatility zones and trend direction, reducing the risk of premature entries.
Dynamic Support/Resistance Levels
Purpose: Highlights key price levels where the market is likely to react, aiding in trade planning and risk management.
Mechanism: Detects pivot highs and lows over a user-defined lookback period, drawing horizontal lines for the most recent support and resistance levels (limited to two each for clarity). Labels mark these levels with price values.
Synergy: Complements entry zones and price targets by providing context for potential reversal or continuation points, helping traders set logical stop-losses or take-profits.
Buy/Sell Signals with Risk-Reward Ratios
Purpose: Generates precise buy/sell signals with integrated take-profit (TP), stop-loss (SL), and RRR calculations for disciplined trading.
Mechanism: Combines volatility zone crossovers, trend confirmation, and positive momentum to trigger signals. ATR-based TP and SL levels are calculated, and the RRR is displayed in labels for quick assessment.
Synergy: This feature ties together all previous components, ensuring signals are only generated when volatility, trend, and momentum align, while providing clear risk-reward metrics for trade evaluation.
Customizable Alerts
Purpose: Enables traders to stay informed of trading opportunities without constant chart monitoring.
Mechanism: Alert conditions are set for buy and sell signals, delivering notifications with the entry price for seamless integration into trading workflows.
Synergy: Enhances usability by allowing traders to act on high-probability setups identified by the indicator’s combined logic.
Originality
"Future is Here" is an original creation that distinguishes itself through its holistic approach to technical analysis. Unlike single-purpose indicators, it integrates volatility, trend, momentum, and support/resistance into a unified system, reducing the need for multiple scripts. The inclusion of RRR calculations directly in signal labels is a unique feature that empowers traders to evaluate trade quality instantly. The script’s design emphasizes clarity and efficiency, with cooldowns to prevent label clutter and a limit on support/resistance lines to maintain chart readability. This combination of features, along with its customizable parameters, makes it a versatile and novel tool for traders seeking a robust, all-in-one solution.
How to Use
Setup: Add the indicator to your TradingView chart and adjust input parameters (e.g., Volatility Length, Trend Length, TP/SL Multipliers) to suit your trading style and timeframe.
Interpretation:
Look for "Buy Zone" or "Sell Zone" labels to identify potential entry points.
Confirm entries with "Bull Mom" or "Bear Mom" labels and trend direction (Bull/Bear Target labels).
Use Support/Resistance lines to set logical TP/SL levels or anticipate reversals.
Evaluate Buy/Sell signals with TP, SL, and RRR for high-probability trades.
Alerts: Set up alerts for Buy/Sell signals to receive real-time notifications.
Customization: Fine-tune multipliers and lengths to adapt the indicator to different markets (e.g., stocks, forex, crypto) or timeframes.

TradePlanner ProPlan smarter. Trade with precision.
TradePlanner Pro is a professional-grade overlay tool designed to streamline your trading decisions by visually organizing your trade plans directly on the chart. Built for traders who value preparation and clarity, this script enables precise entry planning, risk management, and target visualization—all tailored per symbol.
Core Purpose
TradePlanner Pro helps you map out potential trades using pre-defined symbol-based presets. It dynamically calculates position sizes based on your account size or fixed risk, then visualizes key trade levels (Entry, Take Profits, Stop Loss) with profit/loss metrics in both dollar and percentage terms. It's the perfect companion for traders who prepare their setups in advance and want their plans clearly represented on the chart.
Key Features
🔹 Per-Symbol Presets: Define entries, up to 3 take-profit levels, and stop-losses for each ticker.
🔹 Dynamic Risk Sizing: Choose between percentage-based risk or fixed dollar risk per trade.
🔹 Visual Trade Mapping: Automatically plots Entry, TP1–TP3, and SL lines on your chart.
🔹 Real-Time P&L Labels: Displays profit/loss amounts and percentages, with optional R/R ratios.
🔹 Custom Investment Display: Shows how much capital is allocated per trade.
🔹 Clean, Configurable UI: Adjust label positions, font sizes, opacity, and label visibility to match your style.
Whether you're swing trading or day trading, TradePlanner Pro helps you stay disciplined, organized, and confident in your execution.
How to Use TradePlanner Pro – Step-by-Step Guide
TradePlanner Pro is designed to be easy to set up while giving you full control over how your trades are visualized and calculated. Here’s how to get started:
1. Start with Default Settings
By default, the script assumes:
Account Size: $10,000
Max Money per Trade (%): 1.0%
Max Risk (USD): 0 (disabled; only percentage risk is used)
This means the script will size each trade to risk 1% of your account balance per trade unless you override it with a fixed USD risk amount.
2. Set Up Your Symbol Presets
The "Symbol Presets" input is a flexible text area where you define trade setups for each ticker.
Format (one per line):
SYMBOL:Entry,TP1 ,SL
Example:
AAPL:250,260,270,240
MSFT:100,110,90
TSLA:180,200,170
You can include 1 to 3 take-profit levels.
The script will only activate for the current chart’s symbol, matching what's listed.
3. Customize Risk Parameters
You can use:
Account % Risk – Based on account size and % risk.
Fixed USD Risk – When a dollar amount is entered (>0), it takes priority and calculates share size based on the risk per share.
There's also an option to round share quantities down to whole units, which is useful for stock or crypto trading platforms that only allow whole-number units.
4. Choose What to Display
Toggle on/off these elements as needed:
Show Entry/TP/SL Lines
Show P&L Labels – Profit/loss amounts at each target and SL.
Show Amount Invested – Includes total dollar value in the quantity label.
Show Percentages – Adds % gain/loss to each label.
Show Risk/Reward Ratios – Optionally displayed beside or below TP labels.
You can further adjust:
Font size and label opacity
Label position offset – In percent of price range, so they don’t overlap the actual levels.
5. Read the Visual Outputs
Once the preset matches the current chart symbol:
Lines will appear for Entry, TP1-TP3, and Stop Loss.
Labels will display your:
Trade quantity (and invested amount)
Dollar and % profit at each target
Total loss at stop loss
Optional R/R ratios
Everything updates dynamically and adjusts to your current chart scale and bar availabilit

EMA Pullback System 1:5 RRR [SL]EMA Trend Pullback System (1:5 RRR)
Summary:
This indicator is designed to identify high-probability pullback opportunities along the main trend, providing trade signals that target a high 1:5 Risk/Reward Ratio. It is a trend-following strategy built for patient traders who wait for optimal setups.
Strategy Logic:
The system is based on three Exponential Moving Averages (EMAs): 21, 50, and 200.
BUY Signal:
Trend (Uptrend): The price must be above the 200 EMA.
Pullback: The price must pull back into the "Dynamic Support Zone" between the 21 EMA and 50 EMA.
Confirmation: A strong Bullish Confirmation Candle (e.g., Bullish Engulfing) must form within this zone.
SELL Signal:
Trend (Downtrend): The price must be below the 200 EMA.
Pullback: The price must rally back into the "Dynamic Resistance Zone" between the 21 EMA and 50 EMA.
Confirmation: A strong Bearish Confirmation Candle (e.g., Bearish Engulfing) must form within this zone.
Key Features:
Clearly plots the 21, 50, and 200 EMAs on the chart.
Displays BUY and SELL labels when the rules are met.
Automatically calculates and plots Stop Loss (SL) and Take Profit (TP) levels for each signal.
The Risk/Reward Ratio for the Take Profit level is customizable in the settings (Default: 1:5).
How to Use:
Best suited for higher timeframes like H1 and H4.
It is crucial to wait for the signal candle to close before considering an entry.
While this is an automated tool, for best results, combine its signals with your own analysis of Price Action and Market Structure.
Disclaimer:
This is an educational tool and not financial advice. Trading involves substantial risk. Always use proper risk management. It is essential to backtest any strategy before deploying it with real capital.

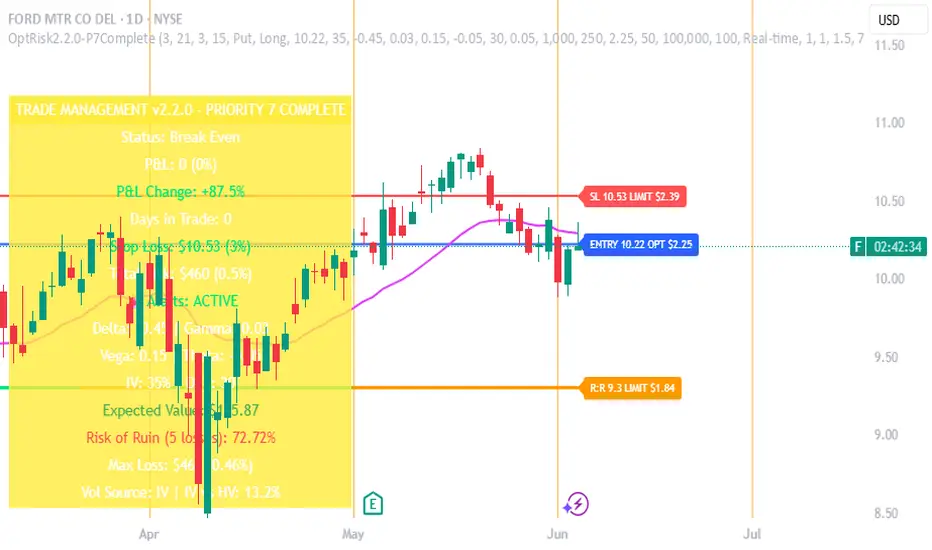
Options Risk Manager v2.2.0 - Priority 7 CompleteScript Description for TradingView Publication
Options Risk Manager v2.2.0 - Priority 7 Complete
What does this script do?
Options Risk Manager v2.2.0 is a comprehensive position management system designed specifically for options traders. The indicator calculates precise stop loss levels, risk/reward targets, and position sizing based on user-defined risk parameters. It provides real-time profit/loss tracking, options Greeks monitoring, and automated alert systems for critical price levels.
The script displays entry points, stop losses, and profit targets directly on the chart while continuously calculating position metrics including dollar risk, account exposure, and probability of success. Version 2.2.0 introduces Priority 7 advanced alerts with dynamic risk warnings and multi-condition notifications.
How does it do it?
The script performs several key calculations:
1. Risk-Based Stop Loss Calculation - Determines stop loss levels based on percentage of entry price, automatically adjusting for calls versus puts. Put positions place stops above entry, while calls place stops below.
2. Position Sizing Algorithm - Calculates optimal contract quantities using account size, risk
percentage, and stop distance to ensure consistent risk per trade regardless of underlying price.
3. Options-Specific P&L Tracking - Incorporates Delta, Gamma, Vega, and Theta to provide accurate profit/loss calculations for options positions, including time decay effects.
4. Three-Phase Trade Management - Implements systematic position management through Entry
Phase (initial risk), Profit Phase (approaching target), and Trailing Phase (EMA-based exit
management).
5. Multi-Level Alert System - Monitors price action, Greeks thresholds, time decay acceleration, and account risk levels to generate context-aware notifications.
How to use it?
Initial Setup:
1. Apply indicator to any optionable security
2. Toggle "In Position" ON when entering a trade
3. Set Direction (Call/Put) and Side (Long/Short)
4. Enter the underlying price at position entry
5. Specify number of contracts and risk percentage
Position Management:
Blue line shows entry price
Red line indicates stop loss level
Orange line displays risk/reward target
Purple EMA line activates after target hit
Monitor real-time P&L in trade panels
Alert Configuration:
Enable Advanced Alerts in settings
Set profit/loss notification thresholds
Configure Greek-based warnings
Activate time decay alerts for expiration
Risk Parameters:
Risk % determines stop distance from entry
Account Value sets position sizing limits
Contract Multiplier (standard = 100)
R:R Ratio defines profit targets
What makes it unique?
Options Risk Manager addresses the specific challenges of options trading that generic indicators miss. The script accounts for the inverse relationship in put options (profiting from price declines), incorporates Greeks for accurate P&L calculations, and provides options-specific limit orders for TradeStation integration.
The three-phase management system removes emotional decision-making by defining clear rules for position management. Phase transitions occur automatically based on price action, shifting from initial risk management to profit protection to trend-following modes.
Version 2.2.0's Priority 7 alert system provides intelligent notifications that include live metrics, risk warnings, and market context rather than simple price crosses.
Key Features Summary
Options-Specific Calculations - Proper handling of calls/puts with inverse relationships
Risk-Based Position Sizing - Consistent risk regardless of underlying price
Greeks Integration - Delta, Gamma, Vega, Theta for accurate tracking
Phase Management System - Systematic three-stage position handling
Advanced Alert System - Context-aware notifications with metrics
TradeStation Integration - Option limit orders for execution
Visual Risk Display - Clear chart overlays for all levels
Probability Calculator - Win/loss probability with expected value
Multi-Account Support - Scales from small to large accounts
Important Notes
This indicator requires manual input of option prices and Greeks (available from your broker's option chain). It functions as a risk management overlay and does not generate entry signals. The calculations assume standard options contracts of 100 shares.
Designed for TradeStation platform with full functionality. Basic features available on other platforms
without options data integration. Always verify calculations with your broker's risk system before placing
trades.
Kaufman Trend Strength Signal█ Overview
Kaufman Trend Strength Signal is an advanced trend detection tool that decomposes price action into its underlying directional trend and localized oscillation using a vector-based Kalman Filter.
By integrating adaptive smoothing and dynamic weighting via a weighted moving average (WMA), this indicator provides real-time insight into both trend direction and trend strength — something standard moving averages often fail to capture.
The core model assumes that observed price consists of two components:
(1) a directional trend, and
(2) localized noise or oscillation.
Using a two-step Predict & Update cycle, the filter continuously refines its trend estimate as new market data becomes available.
█ How It Works
This indicator employs a Kalman Filter model that separates the trend from short-term fluctuations in a price series.
Predict & Update Cycle : With each new bar, the filter predicts the price state and updates that prediction using the latest observed price, producing a smooth but adaptive trend line.
Trend Strength Normalization : Internally, the oscillator component is normalized against recent values (N periods) to calculate a trend strength score between -100 and +100.
(Note: The oscillator is not plotted on the chart but is used for signal generation.)
Filtered MA Line : The trend component is plotted as a smooth Kalman Filter-based moving average (MA) line on the main chart.
Threshold Cross Signals : When the internal trend strength crosses a user-defined threshold (default: ±60), visual entry arrows are displayed to signal momentum shifts.
█ Key Features
Adaptive Trend Estimation : Real-time filtering that adjusts dynamically to market changes.
Visual Buy/Sell Signals : Entry arrows appear when the trend strength crosses above or below the configured threshold.
Built-in Range Filter : The MA line turns blue when trend strength is weak (|value| < 10), helping you filter out choppy, sideways conditions.
█ How to Use
Trend Detection :
• Green MA = bullish trend
• Red MA = bearish trend
• Blue MA = no trend / ranging market
Entry Signals :
• Green triangle = trend strength crossed above +Threshold → potential bullish entry
• Red triangle = trend strength crossed below -Threshold → potential bearish entry
█ Settings
Entry Threshold : Level at which the trend strength triggers entry signals (default: 60)
Process Noise 1 & 2 : Control the filter’s responsiveness to recent price action. Higher = more reactive; lower = smoother.
Measurement Noise : Sets how much the filter "trusts" price data. High = smoother MA, low = faster response but more noise.
Trend Lookback (N2) : Number of bars used to normalize trend strength. Lower = more sensitive; higher = more stable.
Trend Smoothness (R2) : WMA smoothing applied to the trend strength calculation.
█ Visual Guide
Green MA Line → Bullish trend
Red MA Line → Bearish trend
Blue MA Line → Sideways/range
Green Triangle → Entry signal (trend strengthening)
Red Triangle → Entry signal (trend weakening)
█ Best Practices
In high-volatility conditions, increase Measurement Noise to reduce false signals.
Combine with other indicators (e.g., RSI, MACD, EMA) for confirmation and filtering.
Adjust "Entry Threshold" and noise settings depending on your timeframe and trading style.
❗ Disclaimer
This script is provided for educational purposes only and should not be considered financial advice or a recommendation to buy/sell any asset.
Trading involves risk. Past performance does not guarantee future results.
Always perform your own analysis and use proper risk management when trading.

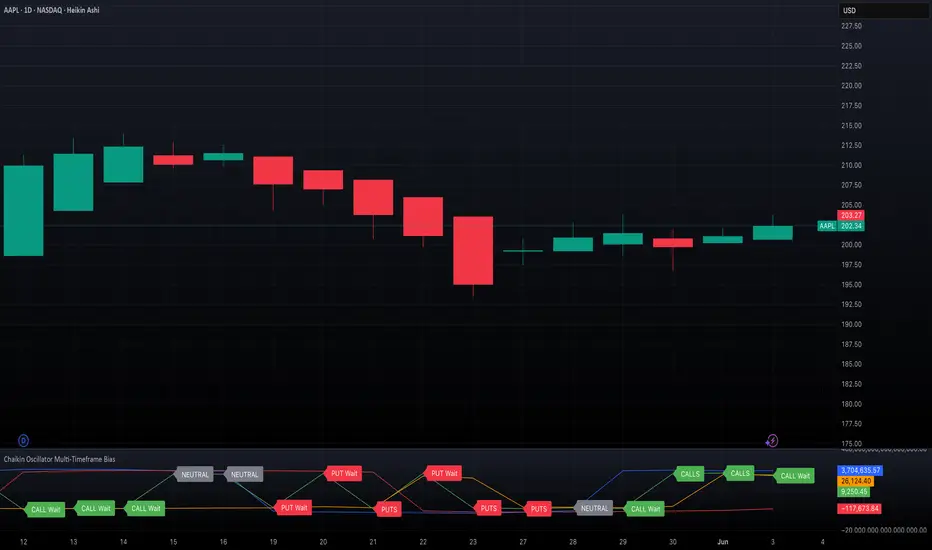
Chaikin Oscillator Multi-Timeframe BiasOverview
Chaikin Oscillator Multi-Timeframe Bias is an indicator designed to help traders align with institutional buying and selling activity by analyzing Chaikin Oscillator signals across two timeframes—a higher timeframe (HTF) for trend bias and a lower timeframe (LTF) for timing. This dual-confirmation model helps traders avoid false breakouts and trade in sync with market momentum and accumulation or distribution dynamics.
Core Concepts
The Chaikin Oscillator measures the momentum of accumulation and distribution based on price and volume. Institutional traders typically accumulate slowly and steadily, and the Chaikin Oscillator helps reveal this pattern. Multi-timeframe analysis confirms whether short-term price action supports the longer-term trend. This indicator applies a smoothing EMA to each Chaikin Oscillator to help confirm direction and reduce noise.
How to Use the Indicator
Start by selecting your timeframes. The higher timeframe, set by default to Daily, establishes the broader directional bias. The lower timeframe, defaulted to 30 minutes, identifies short-term momentum confirmation. The indicator displays one of five labels: CALL Bias, CALL Wait, PUT Bias, PUT Wait, or NEUTRAL. CALL Bias means both HTF and LTF are bullish, signaling a potential opportunity for long or call trades. CALL Wait indicates that the HTF is bullish, but the LTF hasn’t confirmed yet. PUT Bias signals bearish alignment in both HTF and LTF, while PUT Wait indicates HTF is bearish and LTF has not yet confirmed. NEUTRAL means there is no alignment between timeframes and directional trades are not advised.
Interpretation
When the Chaikin Oscillator is above zero and also above its EMA, this indicates bullish momentum and accumulation. When the oscillator is below zero and below its EMA, it suggests bearish momentum and distribution. Bias labels identify when both timeframes are aligned for a higher-probability directional setup. When a “Wait” label appears, it means one timeframe has confirmed bias but the other has not, suggesting the trader should monitor closely but delay entry.
Notes
This indicator includes alerts for both CALL and PUT bias confirmation when both timeframes are aligned. It works on all asset classes, including stocks, ETFs, cryptocurrencies, and futures. Timeframes are fully customizable, and users may explore combinations such as 1D and 1H, or 4H and 15M depending on their strategy. For best results, consider pairing this tool with volume, volatility, or price action analysis.
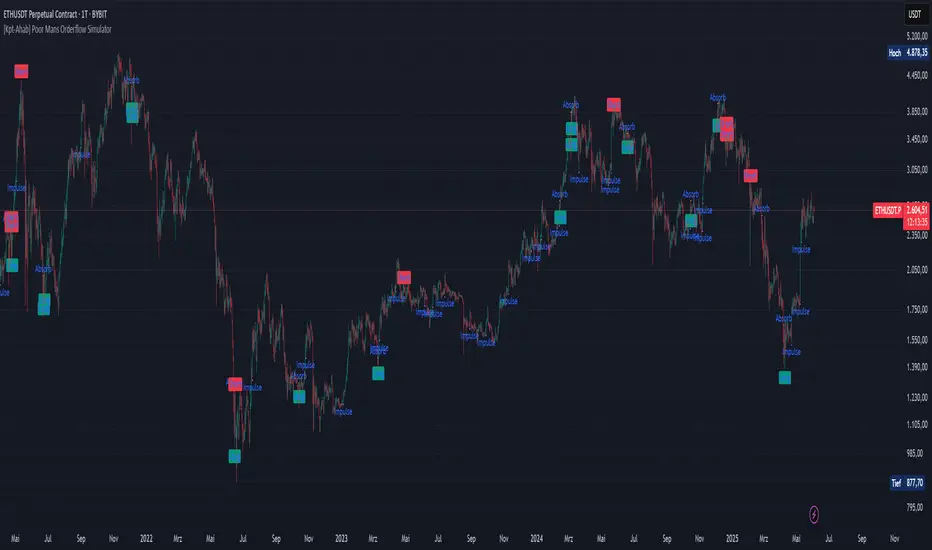
[Kpt-Ahab] Poor Mans Orderflow SimulatorScript Description – Poor Mans Orderflow Simulator
Purpose of the Script
This script simulates a simplified order flow approach ("Poor Man's Orderflow") without access to actual Bid/Ask data. The goal is to detect, quantify, and visualize patterns such as absorption, impulsive moves, and structured re-entry behaviors.
Calculation Logic
Absorption Candles
A candle is classified as "absorption" if:
The ratio of body size to full candle range is below a defined threshold,
Volume is significantly higher than the average of the last N periods,
The candle direction is negative (for long absorption) or positive (for short absorption).
These conditions define a candle with high activity but minimal price movement in the respective direction.
Impulse Candles
A candle is classified as "impulse" if:
The body-to-range ratio is high (indicating a strong directional move),
Volume exceeds the average significantly,
The price closes in the direction of the candle body (bullish or bearish).
Additionally, the average range of previous candles serves as a minimum benchmark for the impulse.
Cluster Detection
A cluster is detected when:
A minimum number of absorption candles is counted within a defined lookback period,
Either the long or short version of the absorption logic is used,
The result is a binary condition: cluster active or inactive.
Entry Signals (Re-entry)
An entry signal is generated when:
One or more absorption candles occurred in the last two bars,
A pullback against the direction of absorption occurs,
The current candle shows a directional move confirmed by a close in the expected direction.
These re-entry signals are evaluated separately for long and short scenarios.
Cluster-Confirmed Signals
A separate signal is generated when a valid re-entry setup occurs while a cluster is active. This represents a combined logic condition.
Alert Logic
The script provides a multi-layer alert framework:
Signal selection (Alertmode):
The user defines which signal type should trigger an alert (e.g. re-entry only, cluster only, combination, or impulse).
Optional filter (Filtermode):
A secondary filter limits alerts to cases where an additional condition (e.g. absorption cluster) is active.
Signal output:
As a simple binary value (+1 / –1) for classic alerts,
Or via an encoded Multibit signal, compatible with other modules in the djmad ecosystem.
These alerts are intended for integration with external systems or for use within platform-native visual or automation features.
Realtime ATR-Based Stop Loss Numerical OverlayRealtime ATR-Based Stop Loss Numerical Overlay
A simple, effective tool for dynamic risk management based on ATR (Average True Range) without adding cluttered and distracting lines all over your chart.
📌 Description
This script plots a real-time stop loss level using the Average True Range (ATR) on your chart, helping you set consistent, volatility-based stops. It supports both:
✅ Current chart timeframe
✅ Custom fixed timeframe inputs (1m, 5m, 15m, 1h, etc.)
The stop level is calculated as:
Stop = ATR × Multiplier
and updates in real-time. An overlay table displays on the bottom-right of your chart with the calculated stop value in a clean, simple way.
⚙️ Settings
ATR Timeframe Source:
Choose between using the current chart's timeframe or a fixed one (e.g. 5, 15, 60, D, etc).
ATR Length:
Period used to calculate the ATR (default is 14).
Stop Loss Multiplier:
Multiplies the ATR value to define your stop (e.g., 1.5 × ATR).
Wait for Timeframe Closes:
If enabled, the ATR value waits for the selected timeframe’s candle to close before updating. If unselected, it will update in real time.
🛠️ How to Use
Add this script to your chart from your indicators list.
Configure your desired timeframe, ATR length, and multiplier in the settings panel.
Use the value shown in the table overlay as your suggested stop loss distance from entry.
Adjust your position sizing accordingly to fit your risk tolerance.
This tool is especially useful for traders looking for adaptive risk management that evolves with market volatility — whether scalping intraday or swing trading.
💡 Pro Tip
The ATR stop can also be used to dynamically trail your stop behind price movement.

Ultimate Scalping Tool[BullByte]Overview
The Ultimate Scalping Tool is an open-source TradingView indicator built for scalpers and short-term traders released under the Mozilla Public License 2.0. It uses a custom Quantum Flux Candle (QFC) oscillator to combine multiple market forces into one visual signal. In plain terms, the script reads momentum, trend strength, volatility, and volume together and plots a special “candlestick” each bar (the QFC) that reflects the overall market bias. This unified view makes it easier to spot entries and exits: the tool labels signals as Strong Buy/Sell, Pullback (a brief retracement in a trend), Early Entry, or Exit Warning . It also provides color-coded alerts and a small dashboard of metrics. In practice, traders see green/red oscillator bars and symbols on the chart when conditions align, helping them scalp or trend-follow without reading multiple separate indicators.
Core Components
Quantum Flux Candle (QFC) Construction
The QFC is the heart of the indicator. Rather than using raw price, it creates a candlestick-like bar from the underlying oscillator values. Each QFC bar has an “open,” “high/low,” and “close” derived from calculated momentum and volatility inputs for that period . In effect, this turns the oscillator into intuitive candle patterns so traders can recognize momentum shifts visually. (For comparison, note that Heikin-Ashi candles “have a smoother look because take an average of the movement”. The QFC instead represents exact oscillator readings, so it reflects true momentum changes without hiding price action.) Colors of QFC bars change dynamically (e.g. green for bullish momentum, red for bearish) to highlight shifts. This is the first open-source QFC oscillator that dynamically weights four non-correlated indicators with moving thresholds, which makes it a unique indicator on its own.
Oscillator Normalization & Adaptive Weights
The script normalizes its oscillator to a fixed scale (for example, a 0–100 range much like the RSI) so that various inputs can be compared fairly. It then applies adaptive weighting: the relative influence of trend, momentum, volatility or volume signals is automatically adjusted based on current market conditions. For instance, in very volatile markets the script might weight volatility more heavily, or in a strong trend it might give extra weight to trend direction. Normalizing data and adjusting weights helps keep the QFC sensitive but stable (normalization ensures all inputs fit a common scale).
Trend/Momentum/Volume/Volatility Fusion
Unlike a typical single-factor oscillator, the QFC oscillator fuses four aspects at once. It may compute, for example, a trend indicator (such as an ADX or moving average slope), a momentum measure (like RSI or Rate-of-Change), a volume-based pressure (similar to MFI/OBV), and a volatility measure (like ATR) . These different values are combined into one composite oscillator. This “multi-dimensional” approach follows best practices of using non-correlated indicators (trend, momentum, volume, volatility) for confirmation. By encoding all these signals in one line, a high QFC reading means that trend, momentum, and volume are all aligned, whereas a neutral reading might mean mixed conditions. This gives traders a comprehensive picture of market strength.
Signal Classification
The script interprets the QFC oscillator to label trades. For example:
• Strong Buy/Sell : Triggered when the oscillator crosses a high-confidence threshold (e.g. breaks clearly above zero with strong slope), indicating a well-confirmed move. This is like seeing a big green/red QFC candle aligned with the trend.
• Pullbacks : Identified when the trend is up but momentum dips briefly. A Pullback Buy appears if the overall trend is bullish but the oscillator has a short retracement – a typical buying opportunity in an uptrend. (A pullback is “a brief decline or pause in a generally upward price trend”.)
• Early Buy/Sell : Marks an initial swing in the oscillator suggesting a possible new trend, before it is fully confirmed. It’s a hint of momentum building (an early-warning signal), not as strong as the confirmed “Strong” signal.
• Exit Warnings : Issued when momentum peaks or reverses. For instance, if the QFC bars reach a high and start turning red/green opposite, the indicator warns that the move may be ending. In other words, a Momentum Peak is the point of maximum strength after which weakness may follow.
These categories correspond to typical trading concepts: Pullback (temporary reversal in an uptrend), Early Buy (an initial bullish cross), Strong Buy (confirmed bullish momentum), and Momentum Peak (peak oscillator value suggesting exhaustion).
Filters (DI Reversal, Dynamic Thresholds, HTF EMA/ADX)
Extra filters help avoid bad trades. A DI Reversal filter uses the +DI/–DI lines (from the ADX system) to require that the trend direction confirms the signal . For example, it might ignore a buy signal if the +DI is still below –DI. Dynamic Thresholds adjust signal levels on-the-fly: rather than fixed “overbought” lines, they move with volatility so signals happen under appropriate market stress. An optional High-Timeframe EMA or ADX filter adds a check against a larger timeframe trend: for instance, only taking a trade if price is above the weekly EMA or if weekly ADX shows a strong trend. (Notably, the ADX is “a technical indicator used by traders to determine the strength of a price trend”, so requiring a high-timeframe ADX avoids trading against the bigger trend.)
Dashboard Metrics & Color Logic
The Dashboard in the Ultimate Scalping Tool (UST) serves as a centralized information hub, providing traders with real-time insights into market conditions, trend strength, momentum, volume pressure, and trade signals. It is highly customizable, allowing users to adjust its appearance and content based on their preferences.
1. Dashboard Layout & Customization
Short vs. Extended Mode : Users can toggle between a compact view (9 rows) and an extended view (13 rows) via the `Short Dashboard` input.
Text Size Options : The dashboard supports three text sizes— Tiny, Small, and Normal —adjustable via the `Dashboard Text Size` input.
Positioning : The dashboard is positioned in the top-right corner by default but can be moved if modified in the script.
2. Key Metrics Displayed
The dashboard presents critical trading metrics in a structured table format:
Trend (TF) : Indicates the current trend direction (Strong Bullish, Moderate Bullish, Sideways, Moderate Bearish, Strong Bearish) based on normalized trend strength (normTrend) .
Momentum (TF) : Displays momentum status (Strong Bullish/Bearish or Neutral) derived from the oscillator's position relative to dynamic thresholds.
Volume (CMF) : Shows buying/selling pressure levels (Very High Buying, High Selling, Neutral, etc.) based on the Chaikin Money Flow (CMF) indicator.
Basic & Advanced Signals:
Basic Signal : Provides simple trade signals (Strong Buy, Strong Sell, Pullback Buy, Pullback Sell, No Trade).
Advanced Signal : Offers nuanced signals (Early Buy/Sell, Momentum Peak, Weakening Momentum, etc.) with color-coded alerts.
RSI : Displays the Relative Strength Index (RSI) value, colored based on overbought (>70), oversold (<30), or neutral conditions.
HTF Filter : Indicates the higher timeframe trend status (Bullish, Bearish, Neutral) when using the Leading HTF Filter.
VWAP : Shows the V olume-Weighted Average Price and whether the current price is above (bullish) or below (bearish) it.
ADX : Displays the Average Directional Index (ADX) value, with color highlighting whether it is rising (green) or falling (red).
Market Mode : Shows the selected market type (Crypto, Stocks, Options, Forex, Custom).
Regime : Indicates volatility conditions (High, Low, Moderate) based on the **ATR ratio**.
3. Filters Status Panel
A secondary panel displays the status of active filters, helping traders quickly assess which conditions are influencing signals:
- DI Reversal Filter: On/Off (confirms reversals before generating signals).
- Dynamic Thresholds: On/Off (adjusts buy/sell thresholds based on volatility).
- Adaptive Weighting: On/Off (auto-adjusts oscillator weights for trend/momentum/volatility).
- Early Signal: On/Off (enables early momentum-based signals).
- Leading HTF Filter: On/Off (applies higher timeframe trend confirmation).
4. Visual Enhancements
Color-Coded Cells : Each metric is color-coded (green for bullish, red for bearish, gray for neutral) for quick interpretation.
Dynamic Background : The dashboard background adapts to market conditions (bullish/bearish/neutral) based on ADX and DI trends.
Customizable Reference Lines : Users can enable/disable fixed reference lines for the oscillator.
How It(QFC) Differs from Traditional Indicators
Quantum Flux Candle (QFC) Versus Heikin-Ashi
Heikin-Ashi candles smooth price by averaging (HA’s open/close use averages) so they show trend clearly but hide true price (the current HA bar’s close is not the real price). QFC candles are different: they are oscillator values, not price averages . A Heikin-Ashi chart “has a smoother look because it is essentially taking an average of the movement”, which can cause lag. The QFC instead shows the raw combined momentum each bar, allowing faster recognition of shifts. In short, HA is a smoothed price chart; QFC is a momentum-based chart.
Versus Standard Oscillators
Common oscillators like RSI or MACD use fixed formulas on price (or price+volume). For example, RSI “compares gains and losses and normalizes this value on a scale from 0 to 100”, reflecting pure price momentum. MFI is similar but adds volume. These indicators each show one dimension: momentum or volume. The Ultimate Scalping Tool’s QFC goes further by integrating trend strength and volatility too. In practice, this means a move that looks strong on RSI might be downplayed by low volume or weak trend in QFC. As one source notes, using multiple non-correlated indicators (trend, momentum, volume, volatility) provides a more complete market picture. The QFC’s multi-factor fusion is unique – it is effectively a multi-dimensional oscillator rather than a traditional single-input one.
Signal Style
Traditional oscillators often use crossovers (RSI crossing 50) or fixed zones (MACD above zero) for signals. The Ultimate Scalping Tool’s signals are custom-classified: it explicitly labels pullbacks, early entries, and strong moves. These terms go beyond a typical indicator’s generic “buy”/“sell.” In other words, it packages a strategy around the oscillator, which traders can backtest or observe without reading code.
Key Term Definitions
• Pullback : A short-term dip or consolidation in an uptrend. In this script, a Pullback Buy appears when price is generally rising but shows a brief retracement. (As defined by Investopedia, a pullback is “a brief decline or pause in a generally upward price trend”.)
• Early Buy/Sell : An initial or tentative entry signal. It means the oscillator first starts turning positive (or negative) before a full trend has developed. It’s an early indication that a trend might be starting.
• Strong Buy/Sell : A confident entry signal when multiple conditions align. This label is used when momentum is already strong and confirmed by trend/volume filters, offering a higher-probability trade.
• Momentum Peak : The point where bullish (or bearish) momentum reaches its maximum before weakening. When the oscillator value stops rising (or falling) and begins to reverse, the script flags it as a peak – signaling that the current move could be overextended.
What is the Flux MA?
The Flux MA (Moving Average) is an Exponential Moving Average (EMA) applied to a normalized oscillator, referred to as FM . Its purpose is to smooth out the fluctuations of the oscillator, providing a clearer picture of the underlying trend direction and strength. Think of it as a dynamic baseline that the oscillator moves above or below, helping you determine whether the market is trending bullish or bearish.
How it’s calculated (Flux MA):
1.The oscillator is normalized (scaled to a range, typically between 0 and 1, using a default scale factor of 100.0).
2.An EMA is applied to this normalized value (FM) over a user-defined period (default is 10 periods).
3.The result is rescaled back to the oscillator’s original range for plotting.
Why it matters : The Flux MA acts like a support or resistance level for the oscillator, making it easier to spot trend shifts.
Color of the Flux Candle
The Quantum Flux Candle visualizes the normalized oscillator (FM) as candlesticks, with colors that indicate specific market conditions based on the relationship between the FM and the Flux MA. Here’s what each color means:
• Green : The FM is above the Flux MA, signaling bullish momentum. This suggests the market is trending upward.
• Red : The FM is below the Flux MA, signaling bearish momentum. This suggests the market is trending downward.
• Yellow : Indicates strong buy conditions (e.g., a "Strong Buy" signal combined with a positive trend). This is a high-confidence signal to go long.
• Purple : Indicates strong sell conditions (e.g., a "Strong Sell" signal combined with a negative trend). This is a high-confidence signal to go short.
The candle mode shows the oscillator’s open, high, low, and close values for each period, similar to price candlesticks, but it’s the color that provides the quick visual cue for trading decisions.
How to Trade the Flux MA with Respect to the Candle
Trading with the Flux MA and Quantum Flux Candle involves using the MA as a trend indicator and the candle colors as entry and exit signals. Here’s a step-by-step guide:
1. Identify the Trend Direction
• Bullish Trend : The Flux Candle is green and positioned above the Flux MA. This indicates upward momentum.
• Bearish Trend : The Flux Candle is red and positioned below the Flux MA. This indicates downward momentum.
The Flux MA serves as the reference line—candles above it suggest buying pressure, while candles below it suggest selling pressure.
2. Interpret Candle Colors for Trade Signals
• Green Candle : General bullish momentum. Consider entering or holding a long position.
• Red Candle : General bearish momentum. Consider entering or holding a short position.
• Yellow Candle : A strong buy signal. This is an ideal time to enter a long trade.
• Purple Candle : A strong sell signal. This is an ideal time to enter a short trade.
3. Enter Trades Based on Crossovers and Colors
• Long Entry : Enter a buy position when the Flux Candle turns green and crosses above the Flux MA. If it turns yellow, this is an even stronger signal to go long.
• Short Entry : Enter a sell position when the Flux Candle turns red and crosses below the Flux MA. If it turns purple, this is an even stronger signal to go short.
4. Exit Trades
• Exit Long : Close your buy position when the Flux Candle turns red or crosses below the Flux MA, indicating the bullish trend may be reversing.
• Exit Short : Close your sell position when the Flux Candle turns green or crosses above the Flux MA, indicating the bearish trend may be reversing.
•You might also exit a long trade if the candle changes from yellow to green (weakening strong buy signal) or a short trade from purple to red (weakening strong sell signal).
5. Use Additional Confirmation
To avoid false signals, combine the Flux MA and candle signals with other indicators or dashboard metrics (e.g., trend strength, momentum, or volume pressure). For example:
•A yellow candle with a " Strong Bullish " trend and high buying volume is a robust long signal.
•A red candle with a " Moderate Bearish " trend and neutral momentum might need more confirmation before shorting.
Practical Example
Imagine you’re scalping a cryptocurrency:
• Long Trade : The Flux Candle turns yellow and is above the Flux MA, with the dashboard showing "Strong Buy" and high buying volume. You enter a long position. You exit when the candle turns red and dips below the Flux MA.
• Short Trade : The Flux Candle turns purple and crosses below the Flux MA, with a "Strong Sell" signal on the dashboard. You enter a short position. You exit when the candle turns green and crosses above the Flux MA.
Market Presets and Adaptation
This indicator is designed to work on any market with candlestick price data (stocks, crypto, forex, indices, etc.). To handle different behavior, it provides presets for major asset classes. Selecting a “Stocks,” “Crypto,” “Forex,” or “Options” preset automatically loads a set of parameter values optimized for that market . For example, a crypto preset might use a shorter lookback or higher sensitivity to account for crypto’s high volatility, while a stocks preset might use slightly longer smoothing since stocks often trend more slowly. In practice, this means the same core QFC logic applies across markets, but the thresholds and smoothing adjust so signals remain relevant for each asset type.
Usage Guidelines
• Recommended Timeframes : Optimized for 1 minute to 15 minute intraday charts. Can also be used on higher timeframes for short term swings.
• Market Types : Select “Crypto,” “Stocks,” “Forex,” or “Options” to auto tune periods, thresholds and weights. Use “Custom” to manually adjust all inputs.
• Interpreting Signals : Always confirm a signal by checking that trend, volume, and VWAP agree on the dashboard. A green “Strong Buy” arrow with green trend, green volume, and price > VWAP is highest probability.
• Adjusting Sensitivity : To reduce false signals in fast markets, enable DI Reversal Confirmation and Dynamic Thresholds. For more frequent entries in trending environments, enable Early Entry Trigger.
• Risk Management : This tool does not plot stop loss or take profit levels. Users should define their own risk parameters based on support/resistance or volatility bands.
Background Shading
To give you an at-a-glance sense of market regime without reading numbers, the indicator automatically tints the chart background in three modes—neutral, bullish and bearish—with two levels of intensity (light vs. dark):
Neutral (Gray)
When ADX is below 20 the market is considered “no trend” or too weak to trade. The background fills with a light gray (high transparency) so you know to sit on your hands.
Bullish (Green)
As soon as ADX rises above 20 and +DI exceeds –DI, the background turns a semi-transparent green, signaling an emerging uptrend. When ADX climbs above 30 (strong trend), the green becomes more opaque—reminding you that trend-following signals (Strong Buy, Pullback) carry extra weight.
Bearish (Red)
Similarly, if –DI exceeds +DI with ADX >20, you get a light red tint for a developing downtrend, and a darker, more solid red once ADX surpasses 30.
By dynamically varying both hue (green vs. red vs. gray) and opacity (light vs. dark), the background instantly communicates trend strength and direction—so you always know whether to favor breakout-style entries (in a strong trend) or stay flat during choppy, low-ADX conditions.
The setup shown in the above chart snapshot is BTCUSD 15 min chart : Binance for reference.
Disclaimer
No indicator guarantees profits. Backtest or paper trade this tool to understand its behavior in your market. Always use proper position sizing and stop loss orders.
Good luck!
- BullByte

Levels & Flow📌 Overview
Levels & Flow is a visual trading tool that combines daily pivot levels with a dynamic EMA ribbon to help traders identify structure, momentum, and key decision zones in the market.
This script is designed for discretionary traders who rely on clean visual cues for intraday and swing trading strategies.
⚙️ Key Features
Daily Pivot, Support, and Resistance Lines
Automatically plots the daily pivot level based on the previous day’s OHLC data, along with calculated support and resistance levels.
Fibonacci Retracement Levels
Two dashed lines above and below the pivot represent the retracement of the pivot-resistance and pivot-support range, forming the boundaries of the “no-trade zone.”
No-Trade Zone (Shaded Box)
A gray shaded box between the two Fibonacci levels to visually mark a high-chop/low-conviction zone.
Trend-Based Candle Coloring (Current Day Only)
Candles are colored green if the close is above the pivot, red if below (only on the current trading day).
Bullish/Bearish Trend Label
A small table in the bottom-right corner displays “Bullish” or “Bearish” depending on whether price is above or below the pivot.
20-EMA Gradient Ribbon
A stack of 20 EMAs, each smoothed and color-coded from blue to green to reflect short- to long-term trend alignment.
Cumulative EMA with Adaptive Weighting
An intelligent moving average line that adjusts weight distribution among the 20 EMAs based on recent predictive accuracy using a learning rate and lookback period.
🧠 How It Works
📍 Levels
The script calculates daily pivot, resistance, and support levels using standard formulas:
Pivot = (High + Low + Close) / 3
Resistance = (2 × Pivot) – Low
Support = (2 × Pivot) – High
These levels update each day and extend 143 bars to the right.
📏 Fib Lines
Fib Up = Pivot + (Resistance – Pivot) × 0.382
Fib Down = Pivot – (Pivot – Support) × 0.382
These lines form the “no-trade zone” box.
📈 EMA Ribbon
20 EMAs starting from the user-defined Base Length, each incremented by 1
Each EMA is smoothed using the Smoothing Period
Color-coded from blue to green for intuitive visual flow
Filled between EMAs to visualize trend strength and alignment
🧠 Cumulative EMA Learning
Each EMA’s historical error is calculated over a Lookback Period
Lower-error EMAs receive higher weight; weights are normalized to sum to 1
The result is a cumulative EMA that adapts based on historical predictive power
🔧 User Inputs
Input
Base EMA Length: Sets the period for the shortest EMA (default: 20)
Smoothing Period: Smooths all EMAs and the cumulative EMA
Lookback for Learning: Number of bars to evaluate EMA prediction accuracy
Learning Rate: Adjusts how quickly weights shift in favor of more accurate EMAs
✅ How to Use It
Use the pivot level to define directional bias.
Watch for price breakouts above resistance or breakdowns below support to consider entry.
Avoid trading inside the shaded zone, where direction is less reliable.
Use the EMA ribbon gradient to confirm short/long alignment.
The cumulative EMA helps define trend with noise reduction.
🧪 Best For
Intraday traders who want to blend structure with flow
Swing traders needing clean daily levels with dynamic confirmation
Anyone looking to avoid choppy zones and improve visual clarity
⚠️ Disclaimer
This script is for educational and informational purposes only. It does not constitute financial advice or a trading recommendation. Always test scripts in simulation or on demo accounts before live use. Use at your own risk.

Stoch Quad Oscillator📘 Stoch Quad Oscillator – User Guide
✅ Purpose
The Stoch Quad Oscillator is a multi-timeframe stochastic oscillator tool that helps traders detect oversold and overbought conditions, momentum shifts, and quad rotation signals using four distinct stochastic configurations. It includes visual cues, customizable parameters, and background highlights to improve decision-making during trend reversals or momentum surges.
🛠️ Inputs & Parameters
⏱ Timeframe
Timeframe for Stochastic Calculation: Defines which chart timeframe to use for stochastic calculations (default is "1" minute). This enables multi-timeframe analysis while on a lower timeframe chart.
📈 Stochastic Parameters
Four different stochastic configurations are used:
Label %K Length %D Smoothing Notes
K9 D3 9 3 Fastest, short-term view
K14 D3 14 3 Moderately short-term
K40 D4 40 4 Medium-term trend view
K60 D10 60 10 Long-term strength
Smoothing Type: Choose between SMA or EMA to control how smoothed the %D line is.
🎯 Levels
Overbought Level: Default 80
Oversold Level: Default 20
These are used to indicate overextended price conditions on any of the stochastic plots.
🔄 Quad Rotation Detection Settings
When enabled, the script detects synchronized oversold/overbought conditions with strong momentum using all 4 stochastic readings.
Enable Quad Rotation: Toggles detection on or off
Slope Calculation Bars: Number of bars used to calculate slope of %D lines
Slope Threshold: Minimum slope strength for signal (higher = stronger confirmation)
Oversold Quad Level: Total of all four stochastic values that define a quad oversold zone
Overbought Quad Level: Total of all four stochastic values that define a quad overbought zone
Oversold Quad Highlight Color: Background color when oversold quad is triggered
Overbought Quad Highlight Color: Background color when overbought quad is triggered
Slope Averaging Method: Either Simple Average or Weighted Average (puts more weight on higher timeframes)
Max Signal Bar Window: Defines how recent the signal must be to be considered valid
📊 Plots & Visual Elements
📉 Stochastic %D Lines
Each stochastic is plotted separately:
K9 D3 – Red
K14 D3 – Orange
K40 D4 – Fuchsia
K60 D10 – Silver
These help visualize short to long-term momentum simultaneously.
📏 Horizontal Reference Lines
Overbought Line (80) – Red
Oversold Line (20) – Green
These help you identify threshold breaches visually.
🌈 Background Highlighting
The indicator provides background highlights to mark potential signal zones:
✅ All Oversold or Overbought Conditions
When all four stochastics are either above overbought or below oversold:
Bright Red if all are overbought
Bright Green if all are oversold
🚨 Quad Rotation Signal Zones (if enabled)
Triggered when:
The combined sum of all four stochastic levels is extremely low/high (below/above oversoldQuadLevel or overboughtQuadLevel)
The average slope of the 4 %D lines is sharply positive (> slopeThreshold)
Highlights:
Custom Red Tint = Strong overbought quad signal
Custom Green Tint = Strong oversold quad signal
These zones can indicate momentum shifts or reversal potential when used with price action or other tools.
⚠️ Limitations & Considerations
This indicator does not provide trade signals. It visualizes conditions and potential setups.
It is best used in confluence with price action, support/resistance levels, and other indicators.
False positives may occur in ranging markets. Reduce reliance on slope thresholds during low volatility.
Quad signals rely on slope strength, which may lag slightly behind sudden reversals.
🧠 Tips for Use
Combine with volume, MACD, or PSAR to confirm direction before entry.
Watch for divergences between price and any of the stochastics.
Use on higher timeframes (e.g., 5m–30m) to filter for swing trading setups; use shorter TFs (1m–5m) for scalping signals.
Adjust oversoldQuadLevel and overboughtQuadLevel based on market conditions (e.g., in trending vs ranging markets).

Guppy Multiple Moving Average (GMMA)The GMMA Momentum Indicator plots 12 EMAs on your chart, divided into two groups:
Short-term EMAs (6 lines, default periods: 3, 5, 8, 10, 12, 15): Represent short-term trader sentiment and momentum.
Long-term EMAs (6 lines, default periods: 30, 35, 40, 45, 50, 60): Reflect long-term investor behavior and broader market trends.
By analyzing the interaction between these two groups, the indicator identifies:
Bullish and bearish trends based on the relative positions of the short- and long-term EMAs.
Momentum strength through the spread or convergence of the EMAs.
Potential reversals or breakouts via compression signals.
This PineScript version enhances the traditional GMMA by adding visual cues like background colors, bearish signals, and compression detection, making it ideal for swing traders seeking clear, actionable insights.
The GMMA Momentum Indicator provides several key features:
1. Trend Identification
Bullish Trend: When the short-term EMAs (green lines) are above the long-term EMAs (blue lines) and spreading apart, it signals strong upward momentum. The chart background turns light green to highlight this condition.
Bearish Trend: When the short-term EMAs cross below the long-term EMAs and converge, it indicates downward momentum. The background turns light red, and an orange downward triangle appears above the bar to mark a new bearish signal.
2. Momentum Analysis
The spread between the short-term EMAs reflects the strength of short-term momentum. A wide spread suggests strong momentum, while a tight grouping indicates weakening momentum or consolidation. Similarly, the long-term EMAs act as dynamic support or resistance, guiding traders on the broader trend.
3. Compression Detection
Compression occurs when both the short-term and long-term EMAs converge, signaling low volatility and a potential breakout or reversal. A yellow upward triangle appears below the bar when compression is detected, alerting traders to watch for price action.
4. Visual Cues
Green short-term EMAs: Show short-term trader activity.
Blue long-term EMAs: Represent long-term investor sentiment.
Background colors: Light green for bullish trends, light red for bearish trends, and transparent for neutral conditions.
Orange downward triangles: Mark new bearish trends.
Yellow upward triangles: Indicate compression, hinting at potential breakouts.
How to Use the GMMA Momentum Indicator for Swing Trading
Swing trading involves capturing price moves over days to weeks, and the GMMA Momentum Indicator is an excellent tool for this strategy. Here’s how to use it effectively:
1. Identifying Trade Entries
Buy Opportunities:
Look for a bullish trend (green background) where the short-term EMAs are above the long-term EMAs and spreading apart, indicating strong momentum.
A compression signal (yellow triangle) followed by a breakout above resistance or a bullish candlestick pattern can confirm an entry.
Example: On a daily chart, if the short-term EMAs cross above the long-term EMAs and the background turns green, consider entering a long position, especially if volume supports the move.
Sell Opportunities:
Watch for a bearish signal (orange downward triangle) or a bearish trend (red background) where the short-term EMAs cross below the long-term EMAs.
Example: If the short-term EMAs collapse below the long-term EMAs and an orange triangle appears, it may signal a shorting opportunity or a time to exit longs.
2. Managing Trades
Use the long-term EMAs as dynamic support (in uptrends) or resistance (in downtrends) to set stop-loss levels or trail stops.
Monitor the spread of the short-term EMAs. A widening spread suggests the trend is strong, while convergence may indicate it’s time to take profits or tighten stops.
3. Anticipating Reversals
Compression signals (yellow triangles) highlight periods of low volatility, often preceding significant price moves. Combine these with price action (e.g., breakouts or reversals) or other indicators (e.g., RSI or volume) for confirmation.
Example: If a compression signal appears near a key support level and the price breaks upward, it could signal the start of a new bullish swing.
4. Best Practices
Timeframes: The indicator works well on daily or 4-hour charts for swing trading, but you can adjust the EMA periods for shorter (e.g., 1-hour) or longer (e.g., weekly) timeframes.
Confirmation: Combine the GMMA with other tools like support/resistance levels, candlestick patterns, or oscillators (e.g., MACD) to reduce false signals.
Risk Management: Always use proper position sizing and stop-losses, as EMAs are lagging indicators and may produce delayed signals in choppy markets.

OTE & A-B-C Zone Indicator SwiftEdgeOTE & A-B-C Zone Indicator SwiftEdge
Overview
The OTE & A-B-C Zone Indicator SwiftEdge is a versatile tool designed to help traders identify high-probability trading setups using a combination of Optimal Trade Entry (OTE) zones, Fibonacci levels, and A-B-C price patterns. This indicator is particularly useful for traders who rely on price action and Fibonacci-based strategies to find entry points, set stop-losses, and target potential take-profit levels. By integrating swing point detection, trend analysis, and Fibonacci projections, SwiftEdge provides a clear visual framework for making informed trading decisions across various timeframes.
What It Does
SwiftEdge identifies key price levels and zones to guide your trading:
OTE Zone: Highlights the Optimal Trade Entry zone between swing points A (swing high) and B (swing low) using Fibonacci retracement levels (default: 0.618 to 0.786). This zone represents a high-probability area for price reversals, making it an ideal entry point for trades.
A-B-C Pattern: Marks the latest swing points as A (swing high), B (swing low), and C (projected take-profit level) with dashed lines and labels. A solid line connects A to B to C, visually illustrating the price movement from entry to target.
Take-Profit Zones: Projects three customizable take-profit levels (TP1, TP2, TP3) based on Fibonacci extensions (default: 1.272, 1.618, 2.0) from the A-B swing, helping traders plan exits with favorable risk-reward ratios.
How It Works
SwiftEdge combines several technical components to create a cohesive trading system:
Swing Point Detection: Identifies significant swing highs (A) and swing lows (B) using a dynamic lookback period that adjusts to the selected timeframe. On lower timeframes like 1-minute charts, an ATR-based filter reduces noise by requiring price movements to exceed a threshold (0.5 * ATR(14)).
Trend Analysis: Uses an Exponential Moving Average (EMA) to determine the trend direction (default: 50-period EMA on 1H). The indicator marks uptrends (price above EMA) in green and downtrends (price below EMA) in red, ensuring trades align with the market's direction.
Fibonacci Levels: Applies Fibonacci retracement to define the OTE zone between A and B, and Fibonacci extensions to project take-profit levels (C) beyond the initial swing. This approach leverages the natural tendency of markets to respect Fibonacci ratios for reversals and extensions.
Visual Clarity: Displays only the latest A-B-C pattern with three dashed lines (A, B, C) and a solid connecting line, ensuring the chart remains uncluttered and easy to interpret.
The combination of these elements creates a structured setup where the OTE zone (between A and B) serves as an entry point, while the projected C level offers a target, all within the context of the prevailing trend. This synergy makes SwiftEdge a powerful tool for traders seeking to combine price action, trend analysis, and Fibonacci strategies.
How to Use
Add the Indicator: Apply the indicator to your chart via TradingView's indicator menu.
Identify the Trend: The OTE zone and A-B-C pattern will be colored green in uptrends (price above EMA) or red in downtrends (price below EMA). Use this to determine the market direction.
Entry Point: Look for price reversals within the OTE zone (between A and B). This zone is typically between the 0.618 and 0.786 Fibonacci retracement levels of the A-B swing, making it a high-probability area for entries.
Stop-Loss: Place your stop-loss below the OTE zone in an uptrend (or above in a downtrend) to protect against false breakouts.
Take-Profit Targets: Use the projected take-profit zones (TP1, TP2, TP3) as potential exit levels. These are based on Fibonacci extensions and can be toggled on/off in the settings.
Customization:
Adjust the Fibonacci levels for the OTE zone (Fibonacci Level 1 and Fibonacci Level 2) to suit your strategy.
Modify the take-profit levels (Fibonacci Extension Level for TP1/TP2/TP3) to target different extension ratios.
Change the lookback period (Base Lookback Period) and EMA period (Base EMA Period) to fine-tune swing point detection and trend sensitivity.
Customize colors for uptrends, downtrends, and A-B-C lines to match your preferences.
What Makes It Unique
SwiftEdge stands out by integrating swing point detection, Fibonacci-based OTE zones, and A-B-C price patterns into a single, visually intuitive indicator. Unlike standalone Fibonacci tools or trend indicators, SwiftEdge combines these elements to provide a complete trading setup: it identifies entry zones (OTE), confirms trend direction (EMA), and projects take-profit targets (Fibonacci extensions). The dynamic timeframe adjustment ensures consistent performance across all chart intervals, while the clean A-B-C visualization (with only the latest pattern displayed) prevents chart clutter, making it easier to focus on the most relevant price levels.
Notes
This indicator is designed for traders familiar with price action and Fibonacci strategies. It does not guarantee profits and should be used in conjunction with other analysis tools and proper risk management.
Performance may vary depending on market conditions and timeframe. Test the indicator on a demo account before using it in live trading.
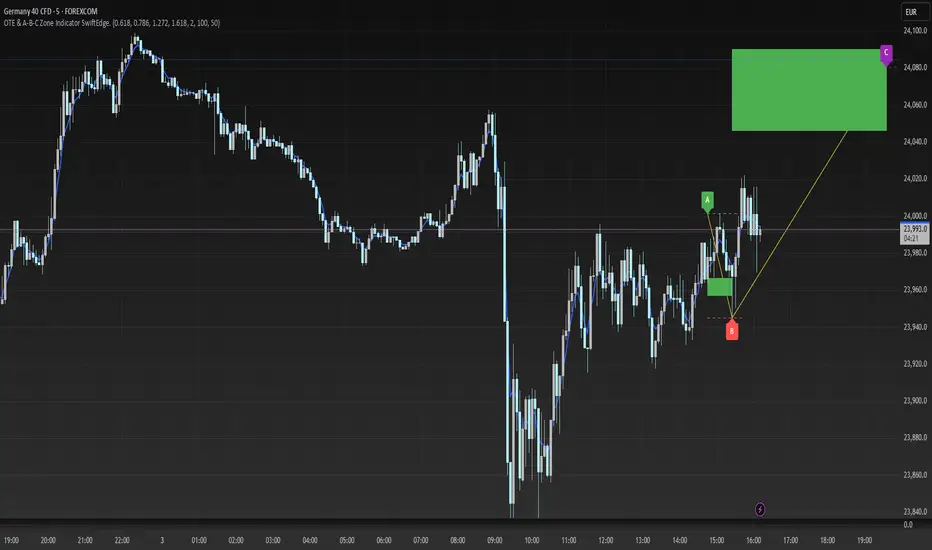
[blackcat] L3 Cloud PioneerOVERVIEW
The L3 Cloud Pioneer indicator combines elements of the Ichimoku Kinko Hyo system with Donchian Channels to provide a robust trend-following tool. This enhanced version includes detailed trade signal labels and alerts, helping traders identify potential entry and exit points more clearly. By plotting dynamic cloud areas and providing visual cues, this indicator aids in making informed trading decisions 📊📉↗️.
FEATURES
Calculates key Ichimoku components using custom Donchian Channel logic:
Conversion Line (based on highest/highest values over specified periods).
Base Line.
Leading Spans.
Lagging Span 2.
Plots a dynamic cloud area between Leading Span 1 and Leading Span 2, colored based on trend direction 🎨.
Identifies trend changes and provides clear entry/exit signals:
LE: Long Entry (when trend turns bullish).
SE: Short Entry (when trend turns bearish).
XL: Exit Long (price crosses below Leading Span 1 during an uptrend).
RL: Re-enter Long (price crosses above Leading Span 1 during an uptrend).
XS: Exit Short (price crosses above Leading Span 1 during a downtrend).
RS: Re-enter Short (price crosses below Leading Span 1 during a downtrend).
Displays corresponding labels on the chart for easy visualization, complete with tooltips for additional information 🏷️.
Generates alerts for each signal event to keep users informed about potential trades 🔔.
Supports customizable input parameters for conversion line, base line, and lagging span periods ⚙️.
HOW TO USE
Add the indicator to your TradingView chart by selecting it from the indicators list.
Adjust the input parameters (Conversion Line Periods, Base Line Periods, Lagging Span 2 Periods) to fit your preferences.
Observe the plotted cloud and labels for trend direction and potential trade opportunities.
Set up alerts based on the generated signals to receive notifications when conditions are met 📲.
Combine this indicator with other tools for confirmation before making trading decisions.
DETAILED SIGNAL LOGIC
Trend Determination:
The script determines the trend direction by comparing leading_line1 and leading_line2.
If leading_line1 is above leading_line2, the trend is considered bullish (isBullish). Otherwise, it's bearish (isBearish).
Signal Conditions:
Long Entry (LE): Triggered when the trend turns bullish from bearish.
Short Entry (SE): Triggered when the trend turns bearish from bullish.
Exit Long (XL): Triggered when the price crosses below leading_line1 during an uptrend.
Re-enter Long (RL): Triggered when the price crosses above leading_line1 during an uptrend.
Exit Short (XS): Triggered when the price crosses above leading_line1 during a downtrend.
Re-enter Short (RS): Triggered when the price crosses below leading_line1 during a downtrend.
Label Styling:
Labels are color-coded for quick identification:
Green for long entries and re-entries.
Red for short entries and exits.
Blue for exiting long positions.
Orange for re-entering short positions.
Tooltips provide additional context for each label.
Alert Configuration:
Alerts are generated for each signal condition, ensuring traders are notified promptly.
Users can set up these alerts within TradingView by creating new alerts and selecting the appropriate conditions.
LIMITATIONS
The indicator may lag behind price action due to its use of moving averages and channel calculations 🕒.
False signals can occur in choppy or sideways markets 🌪️.
Users should always confirm signals with other forms of analysis.
NOTES
Ensure that you have sufficient historical data available for accurate calculations.
Test the indicator thoroughly on demo accounts before applying it to live trading 🔍.
Customize the appearance and parameters as needed to fit your trading strategy.
For better risk management, consider integrating stop-loss and take-profit levels into your trading plan.
To optimize performance, manage old labels by deleting them after a certain period to avoid clutter on the chart.
Auto Trend Channel + Buy/Sell AlertsThis indicator automatically detects trend channels using a linear regression line, and dynamically plots upper and lower channel boundaries based on standard deviation. It helps traders identify potential Buy and Sell zones with clear visual signals and customizable alerts.
💡 How It Works:
🧠 Regression-Based Channel: Calculates the central trend line using ta.linreg() over a user-defined length.
📏 Dynamic Boundaries: Upper and lower channel lines are offset by a multiplier of the standard deviation for precision volatility tracking.
✅ Buy Signals: Triggered when price crosses above the lower boundary — potential bounce entry.
❌ Sell Signals: Triggered when price crosses below the upper boundary — potential reversal exit.
🔔 Alerts Enabled: Get real-time alerts when price touches the channel lines.

ICT SMC Liquidity Grabs and OBsICT SMC Liquidity Grabs + Order Blocks + Fibonacci OTE Levels
A High-Probability Entry Engine for Smart Money Concept Traders
This script combines three powerful Smart Money Concepts (SMC) into a single tool: Liquidity Grabs, Order Block Zones, and Fibonacci OTE Levels, allowing traders to identify institutional entry models with clean, rule-based visual signals.
It’s designed to simplify SMC trading by highlighting confluence zones where price is likely to reverse or continue — with clear visual zones, entry arrows, and take profit projections.
🔍 What This Script Does:
Detects Liquidity Grabs
Identifies when price sweeps above/below the highest high or lowest low within a user-defined lookback period and closes back inside.
Plots orange labels on the chart to signal potential liquidity events (LG-H / LG-L).
Plots Order Blocks After Liquidity Grabs
After a liquidity grab, the script looks for displacement candles (strong bullish or bearish moves) and draws highlighted OB zones extending several bars to the right.
These zones represent potential institutional footprints for price reversals.
Draws Fibonacci OTE Levels (Optimal Trade Entry)
Uses recent swing high and low pivots to automatically calculate OTE zones (default: 62% and 75% retracement levels).
Draws these retracement zones for both bullish and bearish setups.
Marks Valid OTE Entry Zones
Buy/Sell zones only trigger when:
A liquidity grab occurs,
Price enters the OTE zone,
And a strong confirming candle is present.
Plots green/red arrows for valid buy/sell OTE entries.
Auto-Draws Take Profit Zones
TP1 = Previous swing high/low
TP2 = Risk-based R-multiplied extension (e.g., 1.5R — customizable)
Alerts
Triggers alerts when valid buy or sell OTE setups are detected.
⚙️ Customization Features:
Toggle each feature: Liquidity Grabs, Order Blocks, Fibonacci OTE levels
Set Fibonacci retracement percentages (e.g., 0.62 / 0.75)
Adjust lookback window for liquidity detection
Customize the take-profit multiplier (R-based)
Full control over visuals: colors, labels, and lines
💡 How to Use:
Use this script to scan for high-confluence trade setups based on Smart Money principles.
Combine with session timing (e.g., New York open), major swing structure, or Kill Zone windows for maximum edge.
Look for arrows inside OB zones or OTE levels following liquidity sweeps for cleaner entries.
🔗 Works Best With:
✅ First FVG — Opening Range Fair Value Gap Detector: Identify early inefficiencies to set the narrative for the day.
✅ Liquidity Levels — Smart Swing Lows: Spot key structural lows that can fuel stop hunts and reversals.
✅ ICT Turtle Soup — Liquidity Reversal: Add a classic reversal pattern to your toolkit to catch fakeouts cleanly.
Together, these tools build a complete Smart Money ecosystem for entry precision, risk management, and price behavior forecasting.

Enhanced Execution ToolA comprehensive position sizing calculator for disciplined risk management
Description :
This tool provides traders with precise position sizing calculations based on their account parameters and market conditions. The indicator calculates optimal position sizes for different entry scenarios while maintaining strict risk control.
Key Features:
Multiple entry options (High, Close, Manual)
Flexible stop loss configuration (LoD or Previous Day Low)
Account-based risk management (1% risk by default)
ATR-based distance metrics for volatility assessment
Clear visual table displaying all critical trade parameters
How to Use:
Configure your account size and risk percentage
Select your preferred entry methods (High/Close/Manual)
Choose stop loss reference (Low of Day or Previous Day Low)
View calculated position sizes and risk parameters
For manual entries, input your desired entry and stop prices
Input Parameters:
Account Configuration: Set your capital and risk tolerance
Entry Options: Choose which entry methods to display
Stop Loss: Select stop loss reference level
Technical Settings: Adjust ATR length and distance limits
Display Options: Customize table appearance
Output Includes:
Risk amount in dollars
Risk as percentage of entry price
Entry to stop loss as percentage of ATR
Stop loss price
Entry price
Position size as % of account
Share quantity
Ideal For:
Traders who want to maintain consistent risk management
Those who need quick position sizing calculations
Investors who trade with multiple entry strategies
Note: Always verify calculations before executing trades. This tool is designed to assist with trade planning, not as trade advice.

Range Filter Buy and Sell 5min## **Enhanced Range Filter Strategy: A Comprehensive Overview**
### **1. Introduction**
The **Enhanced Range Filter Strategy** is a powerful technical trading system designed to identify high-probability trading opportunities while filtering out market noise. It utilizes **range-based trend filtering**, **momentum confirmation**, and **volatility-based risk management** to generate precise entry and exit signals. This strategy is particularly useful for traders who aim to capitalize on trend-following setups while avoiding choppy, ranging market conditions.
---
### **2. Key Components of the Strategy**
#### **A. Range Filter (Trend Determination)**
- The **Range Filter** smooths price fluctuations and helps identify clear trends.
- It calculates an **adjusted price range** based on a **sampling period** and a **multiplier**, ensuring a dynamic trend-following approach.
- **Uptrends:** When the current price is above the range filter and the trend is strengthening.
- **Downtrends:** When the price falls below the range filter and momentum confirms the move.
#### **B. RSI (Relative Strength Index) as Momentum Confirmation**
- RSI is used to **filter out weak trades** and prevent entries during overbought/oversold conditions.
- **Buy Signals:** RSI is above a certain threshold (e.g., 50) in an uptrend.
- **Sell Signals:** RSI is below a certain threshold (e.g., 50) in a downtrend.
#### **C. ADX (Average Directional Index) for Trend Strength Confirmation**
- ADX ensures that trades are only taken when the trend has **sufficient strength**.
- Avoids trading in low-volatility, ranging markets.
- **Threshold (e.g., 25):** Only trade when ADX is above this value, indicating a strong trend.
#### **D. ATR (Average True Range) for Risk Management**
- **Stop Loss (SL):** Placed **one ATR below** (for long trades) or **one ATR above** (for short trades).
- **Take Profit (TP):** Set at a **3:1 reward-to-risk ratio**, using ATR to determine realistic price targets.
- Ensures volatility-adjusted risk management.
---
### **3. Entry and Exit Conditions**
#### **📈 Buy (Long) Entry Conditions:**
1. **Price is above the Range Filter** → Indicates an uptrend.
2. **Upward trend strength is positive** (confirmed via trend counter).
3. **RSI is above the buy threshold** (e.g., 50, to confirm momentum).
4. **ADX confirms trend strength** (e.g., above 25).
5. **Volatility is supportive** (using ATR analysis).
#### **📉 Sell (Short) Entry Conditions:**
1. **Price is below the Range Filter** → Indicates a downtrend.
2. **Downward trend strength is positive** (confirmed via trend counter).
3. **RSI is below the sell threshold** (e.g., 50, to confirm momentum).
4. **ADX confirms trend strength** (e.g., above 25).
5. **Volatility is supportive** (using ATR analysis).
#### **🚪 Exit Conditions:**
- **Stop Loss (SL):**
- **Long Trades:** 1 ATR below entry price.
- **Short Trades:** 1 ATR above entry price.
- **Take Profit (TP):**
- Set at **3x the risk distance** to achieve a favorable risk-reward ratio.
- **Ranging Market Exit:**
- If ADX falls below the threshold, indicating a weakening trend.
---
### **4. Visualization & Alerts**
- **Colored range filter line** changes based on trend direction.
- **Buy and Sell signals** appear as labels on the chart.
- **Stop Loss and Take Profit levels** are plotted as dashed lines.
- **Gray background highlights ranging markets** where trading is avoided.
- **Alerts trigger on Buy, Sell, and Ranging Market conditions** for automation.
---
### **5. Advantages of the Enhanced Range Filter Strategy**
✅ **Trend-Following with Noise Reduction** → Helps avoid false signals by filtering out weak trends.
✅ **Momentum Confirmation with RSI & ADX** → Ensures that only strong, valid trades are executed.
✅ **Volatility-Based Risk Management** → ATR ensures adaptive stop loss and take profit placements.
✅ **Works on Multiple Timeframes** → Effective for day trading, swing trading, and scalping.
✅ **Visually Intuitive** → Clearly displays trade signals, SL/TP levels, and trend conditions.
---
### **6. Who Should Use This Strategy?**
✔ **Trend Traders** who want to enter trades with momentum confirmation.
✔ **Swing Traders** looking for medium-term opportunities with a solid risk-reward ratio.
✔ **Scalpers** who need precise entries and exits to minimize false signals.
✔ **Algorithmic Traders** using alerts for automated execution.
---
### **7. Conclusion**
The **Enhanced Range Filter Strategy** is a powerful trading tool that combines **trend-following techniques, momentum indicators, and risk management** into a structured, rule-based system. By leveraging **Range Filters, RSI, ADX, and ATR**, traders can improve trade accuracy, manage risk effectively, and filter out unfavorable market conditions.
This strategy is **ideal for traders looking for a systematic, disciplined approach** to capturing trends while **avoiding market noise and false breakouts**. 🚀

Ryna 3 EMA Multi-Timeframe Indicator**EMA Multi-Timeframe Strategy (Pine Script v6)**
This TradingView indicator is designed to assist traders using a **multi-timeframe trend-following strategy** based on Exponential Moving Averages (EMAs).
**Core Functionality**
- **Trend Identification:**
Uses a configurable **EMA (e.g., EMA 50)** on a **higher timeframe** (e.g., H1, D1, W1) to determine the market bias:
- If price is **above** the trend EMA → **Long bias**
- If price is **below** the trend EMA → **Short bias**
- **Entry Signals:**
Uses two EMAs (fast & slow, e.g., EMA 8 & EMA 21) on either:
- The **current chart timeframe**, or
- A **separately selected timeframe** (e.g., entry on M15, trend on H1)
→ Signals are generated based on **EMA crossovers**:
- **Bullish crossover** (fast crosses above slow) → Long signal
- **Bearish crossover** (fast crosses below slow) → Short signal
- Only when aligned with the higher-timeframe trend
- **Visual Output:**
- Optional display of entry EMAs when sourced from the trend timeframe
- Always displays the trend EMA
- Entry signals shown with triangle markers on the chart
- **Info Panel (Top Center):**
- Shows selected timeframes and EMA settings
- Indicates current trend bias (LONG / SHORT / NEUTRAL)
- Notes if entry EMAs are hidden due to settings
- **Alerts:**
- Optional alerts for long and short entry signals based on EMA crossovers
#### **User Inputs**
- **Trend Timeframe & EMA Length**
- **Entry Timeframe & EMA Fast/Slow Lengths**
- **Option to show/hide entry EMAs when using the trend timeframe**
- **Option to show/hide Infobox on Chart**
AsianRange&Midnight 2.2### Midnight Setup: Trading Strategy
#### **Bias Definition (Trend Identification)**
- The Daily (D) bias is defined the previous day and validated on the line chart.
- On the Daily chart, identify the nearest V-shaped formation that has broken close to the current price. This formation determines the Daily bias direction.
#### **H4 Bias Analysis (Trend Confirmation)**
- Switch to an H4 chart to refine the analysis.
- Identify a similar V-shaped formation that has broken in the H4 timeframe.
- If the Daily and H4 biases are aligned, the setup is valid.
#### **Entry Strategy (Position Entries)**
- **Bearish Bias (D and H4 identical):**
- Short entry at the high level of the Midnight range.
- **Bullish Bias (D and H4 identical):**
- Long entry at the low level of the Midnight range.
#### **Bias Divergence (Context Adaptation)**
- If the H4 bias is opposite to the Daily bias, this indicates an H4 retracement of the Daily bias.
- Enter a counter-trend trade with reduced risk.
- No TP target beyond 50% of the extension validating the Daily break. It is also not recommended to enter against this divergence beyond 50%.
#### **Divergence Scenarios (Reactions to Divergences)**
- **Daily Bearish Bias, H4 Bullish Bias:**
- Long entry at the Midnight Low.
- **Daily Bullish Bias, H4 Bearish Bias:**
- Short entry at the Midnight High.
#### **Daily Bias Resumption (Trend Alignment)**
- As soon as the H4 bias resumes the Daily bias direction, follow this trend and adjust the position accordingly.
#### **Instructions for Divergent Bias (Managing Divergence)**
- When holding a position with a divergent bias, it is crucial to manage it carefully.
- Exit counter-trend trades as soon as the H4 bias realigns with the Daily bias.
- Limit the duration of counter-trend trades per session and adjust the H4 bias for the next session if needed.
#### **SL/TP Management (Profit Taking and Protection Optimization)**
- **Take Profit (TP):**
- Entry in M15 with a minimum RR of 3.
- TP at 5H NYE, or RR 5, or 15H NYE.
- **Stop Loss (SL):**
- Minimum 15 pips, placed just above the nearest swing to the entry point to protect capital.
- **Red Announcement Days:**
- Either abstain from trading or set a 40-pip SL to limit volatility impact.
- **At 6H/7H NYE:**
- Manage the trade based on its progress: exit, set to BE (Break Even), or keep the SL in place.
- Any SL adjustment outside these rules can only be made if supported by data or backtests.
#### **Risk Management (Capital Protection)**
- Maximum risk of **1% of capital per trade** (allowing for **10 consecutive losses** without significantly affecting capital).
- In case of a loss, **reduce risk by 50% on the next trade** until the loss is recovered.
#### **Efficiency Conditions (When This Setup Works Best)**
- This setup is particularly effective in **strong trends**, where the market has a clear direction.
- It is **less effective in ranging markets**, where prices move within a narrow range without a clear trend.
Setup Midnight : Stratégie de Trading
