Fractals + FVG [Combined]Звісно, ось варіант опису англійською, який можна використати для публікації індикатора в TradingView.
Description
This script combines two powerful and widely-used trading concepts into a single, comprehensive indicator: Bill Williams Fractals with dynamic support/resistance lines and Fair Value Gaps (FVG) based on the popular logic from LuxAlgo.
The goal is to provide a cleaner chart by merging two essential tools, allowing traders to analyze market structure and imbalances simultaneously.
Features
1. Williams Fractals with Invalidation Lines
This part of the indicator identifies classic Bill Williams fractals and enhances them with a unique visualization feature.
Fractal Detection: Automatically identifies both bullish (bottom) and bearish (top) fractals. You can choose between a 3-bar or 5-bar pattern in the settings.
Dynamic S/R Lines: A horizontal line is automatically drawn from every confirmed fractal, acting as a potential support or resistance level.
Automatic Invalidation: A line is considered "invalidated" or breached when the body of a candle closes past it. When this happens, the line stops extending, changes its color to the "invalidated" color, and remains on the chart as a historical reference. This provides a clear, objective signal that a level has been broken.
Customization: You can fully customize the colors for the support, resistance, and invalidated lines to match your chart theme.
2. Fair Value Gaps (FVG) / Imbalance
This module incorporates the robust FVG detection logic from LuxAlgo to automatically identify and display market imbalances.
FVG Detection: Highlights bullish and bearish Fair Value Gaps on the chart with colored boxes, representing inefficiencies in price delivery.
Automatic Mitigation: The FVG boxes are automatically removed from the chart once the price has "mitigated" or filled the gap, keeping your workspace clean and focused on active imbalances.
Multi-Timeframe (MTF): You can set the indicator to find and display FVGs from a higher timeframe directly on your current chart.
Dashboard: An optional on-screen dashboard provides a quick summary of the total count of bullish/bearish FVGs and the percentage that have been mitigated.
Full Customization: Control the colors of FVG boxes, extend their length, and configure other visual style settings.
How to Use
Fractal Lines: Use the active support and resistance lines as key levels for potential bounces or breaks. A line's invalidation can serve as confirmation of a shift in market structure.
FVG Zones: Fair Value Gaps often act as "magnets" for price. Use these zones as potential targets for your trades or as areas of interest for entries when price retraces to fill the imbalance.
Combined Strategy: The true power of this indicator comes from combining both concepts. For example, a bullish FVG forming near a key fractal support level can create a high-probability confluence zone for a long entry. Similarly, a break and invalidation of a fractal resistance line might signal that price is heading towards the next bearish FVG above.
This indicator is a tool for analysis and should be used in conjunction with your own trading strategy and risk management rules.
Поиск скриптов по запросу "gaps"

Nifty50 Swing Trading Super Indicator# 🚀 Nifty50 Swing Trading Super Indicator - Complete Guide
**Created by:** Gaurav
**Date:** August 8, 2025
**Version:** 1.0 - Optimized for Indian Markets
---
## 📋 Table of Contents
1. (#quick-start-guide)
2. (#indicator-overview)
3. (#installation-instructions)
4. (#parameter-settings)
5. (#signal-interpretation)
6. (#trading-strategy)
7. (#risk-management)
8. (#optimization-tips)
9. (#troubleshooting)
---
## 🎯 Quick Start Guide
### What You Get
✅ **2 Complete Pine Script Indicators:**
- `swing_trading_super_indicator.pine` - Universal version for all markets
- `nifty_optimized_super_indicator.pine` - Specifically optimized for Nifty50 & Indian stocks
✅ **Key Features:**
- Multi-component signal confirmation system
- Optimized for daily and 3-hour timeframes
- Built-in risk management with dynamic stops and targets
- Real-time signal strength monitoring
- Gap analysis for Indian market characteristics
### Immediate Setup
1. Copy the Pine Script code from `nifty_optimized_super_indicator.pine`
2. Paste into TradingView Pine Editor
3. Add to chart on daily or 3-hour timeframe
4. Look for 🚀BUY and 🔻SELL signals
5. Use the information table for signal confirmation
---
## 🔍 Indicator Overview
### Core Components Integration
**🎯 Range Filter (35% Weight)**
- Primary trend identification using adaptive volatility filtering
- Optimized sampling period: 21 bars for Indian market volatility
- Enhanced range multiplier: 3.0 to handle market gaps
- Provides trend direction and strength measurement
**⚡ PMAX (30% Weight)**
- Volatility-adjusted trend confirmation using ATR-based calculations
- Dynamic multiplier adjustment based on market volatility
- 14-period ATR with 2.5 multiplier for swing trading sensitivity
- Offers trailing stop functionality
**🏗️ Support/Resistance (20% Weight)**
- Dynamic level identification using pivot point analysis
- Tighter channel width (3%) for precise Indian market levels
- Enhanced strength calculation with historical interaction weighting
- Provides entry/exit timing and breakout signals
**📊 EMA Alignment (15% Weight)**
- Multi-timeframe moving average confirmation
- Key EMAs: 9, 21, 50, 200 (popular in Indian markets)
- Hierarchical alignment scoring for trend strength
- Additional trend validation layer
### Advanced Features
**🌅 Gap Analysis**
- Automatic detection of significant price gaps (>2%)
- Gap strength measurement and impact on signals
- Specific optimization for Indian market overnight gaps
- Visual gap markers on chart
**⏰ Multi-Timeframe Integration**
- Higher timeframe bias from daily/weekly data
- Configurable daily bias weight (default 70%)
- 3-hour confirmation for precise entry timing
- Prevents counter-trend trades against major timeframe
**🛡️ Risk Management**
- Dynamic stop-loss calculation using multiple methods
- Automatic profit target identification
- Position sizing guidance based on signal strength
- Anti-whipsaw logic to prevent false signals
---
## 📥 Installation Instructions
### Step 1: Access TradingView
1. Open TradingView.com
2. Navigate to Pine Editor (bottom panel)
3. Create a new indicator
### Step 2: Copy the Code
**For Nifty50 & Indian Stocks (Recommended):**
```pinescript
// Copy entire content from nifty_optimized_super_indicator.pine
```
**For Universal Use:**
```pinescript
// Copy entire content from swing_trading_super_indicator.pine
```
### Step 3: Configure and Apply
1. Click "Add to Chart"
2. Select daily or 3-hour timeframe
3. Adjust parameters if needed (defaults are optimized)
4. Enable alerts for signal notifications
### Step 4: Verify Installation
- Check that all components are visible
- Confirm information table appears in top-right
- Test with known trending stocks for signal validation
---
## ⚙️ Parameter Settings
### 🎯 Range Filter Settings
```
Sampling Period: 21 (optimized for Indian market volatility)
Range Multiplier: 3.0 (handles overnight gaps effectively)
Source: Close (most reliable for swing trading)
```
### ⚡ PMAX Settings
```
ATR Length: 14 (standard for daily/3H timeframes)
ATR Multiplier: 2.5 (balanced for swing trading sensitivity)
Moving Average Type: EMA (responsive to price changes)
MA Length: 14 (matches ATR period for consistency)
```
### 🏗️ Support/Resistance Settings
```
Pivot Period: 8 (shorter for Indian market dynamics)
Channel Width: 3% (tighter for precise levels)
Minimum Strength: 3 (higher quality levels only)
Maximum Levels: 4 (focus on strongest levels)
Lookback Period: 150 (sufficient historical data)
```
### 🚀 Super Indicator Settings
```
Signal Sensitivity: 0.65 (balanced for swing trading)
Trend Strength Requirement: 0.75 (high quality signals)
Gap Threshold: 2.0% (significant gap detection)
Daily Bias Weight: 0.7 (strong higher timeframe influence)
```
### 🎨 Display Options
```
Show Range Filter: ✅ (trend visualization)
Show PMAX: ✅ (trailing stops)
Show S/R Levels: ✅ (key price levels)
Show Key EMAs: ✅ (trend confirmation)
Show Signals: ✅ (buy/sell alerts)
Show Trend Background: ✅ (visual trend state)
Show Gap Markers: ✅ (gap identification)
```
---
## 📊 Signal Interpretation
### 🚀 BUY Signals
**Requirements for BUY Signal:**
- Price above Range Filter with upward trend
- PMAX showing bullish direction (MA > PMAX line)
- Support/resistance breakout or favorable positioning
- EMA alignment supporting upward movement
- Higher timeframe bias confirmation
- Overall signal strength > 75%
**Signal Strength Indicators:**
- **90-100%:** Extremely strong - Maximum position size
- **80-89%:** Very strong - Large position size
- **75-79%:** Strong - Standard position size
- **65-74%:** Moderate - Reduced position size
- **<65%:** Weak - Wait for better opportunity
### 🔻 SELL Signals
**Requirements for SELL Signal:**
- Price below Range Filter with downward trend
- PMAX showing bearish direction (MA < PMAX line)
- Resistance breakdown or unfavorable positioning
- EMA alignment supporting downward movement
- Higher timeframe bias confirmation
- Overall signal strength > 75%
### ⚖️ NEUTRAL Signals
**Characteristics:**
- Conflicting signals between components
- Low overall signal strength (<65%)
- Range-bound market conditions
- Wait for clearer directional bias
### 📈 Information Table Guide
**Component Status:**
- **BULL/BEAR:** Current signal direction
- **Strength %:** Component contribution strength
- **Status:** Additional context (STRONG/WEAK/ACTIVE/etc.)
**Overall Signal:**
- **🚀 STRONG BUY:** All systems aligned bullish
- **🔻 STRONG SELL:** All systems aligned bearish
- **⚖️ NEUTRAL:** Mixed or weak signals
---
## 💼 Trading Strategy
### Daily Timeframe Strategy
**Setup:**
1. Apply indicator to daily chart of Nifty50 or Indian stocks
2. Wait for 🚀BUY or 🔻SELL signal with >75% strength
3. Confirm higher timeframe bias alignment
4. Check for significant support/resistance levels
**Entry:**
- Enter on signal bar close or next bar open
- Use 3-hour chart for precise entry timing
- Avoid entries during major news events
- Consider gap analysis for overnight positions
**Position Sizing:**
- **>90% Strength:** 3-4% of portfolio
- **80-89% Strength:** 2-3% of portfolio
- **75-79% Strength:** 1-2% of portfolio
- **<75% Strength:** Avoid or minimal size
### 3-Hour Timeframe Strategy
**Setup:**
1. Confirm daily timeframe bias first
2. Apply indicator to 3-hour chart
3. Look for signals aligned with daily trend
4. Use for entry/exit timing optimization
**Entry Refinement:**
- Wait for 3H signal confirmation
- Enter on pullbacks to key levels
- Use tighter stops for better risk/reward
- Monitor intraday support/resistance
### Risk Management Rules
**Stop Loss Placement:**
1. **Primary:** Use indicator's dynamic stop level
2. **Secondary:** Below/above nearest support/resistance
3. **Maximum:** 2-3% of portfolio per trade
4. **Trailing:** Move stops with PMAX line
**Profit Taking:**
1. **Target 1:** First resistance/support level (50% position)
2. **Target 2:** Second resistance/support level (30% position)
3. **Runner:** Trail remaining 20% with PMAX
**Position Management:**
- Review positions at daily close
- Adjust stops based on new signals
- Exit if trend changes to opposite direction
- Reduce size during high volatility periods
---
## 🎯 Optimization Tips
### For Nifty50 Trading
- Use daily timeframe for primary signals
- Monitor sector rotation impact
- Consider index futures for better liquidity
- Watch for RBI policy and global cues impact
### For Individual Stocks
- Verify stock follows Nifty correlation
- Check sector-specific news and events
- Ensure adequate liquidity for position size
- Monitor earnings calendar for volatility
### Market Condition Adaptations
**Trending Markets:**
- Increase position sizes for strong signals
- Use wider stops to avoid whipsaws
- Focus on trend continuation signals
- Reduce counter-trend trading
**Range-Bound Markets:**
- Reduce position sizes
- Use tighter stops and quicker profits
- Focus on support/resistance bounces
- Increase signal strength requirements
**High Volatility Periods:**
- Reduce overall exposure
- Use smaller position sizes
- Increase stop-loss distances
- Wait for clearer signals
### Performance Monitoring
- Track win rate and average profit/loss
- Monitor signal quality over time
- Adjust parameters based on market changes
- Keep trading journal for pattern recognition
---
## 🔧 Troubleshooting
### Common Issues
**Q: Signals appear too frequently**
A: Increase "Trend Strength Requirement" to 0.8-0.9
**Q: Missing obvious trends**
A: Decrease "Signal Sensitivity" to 0.5-0.6
**Q: Too many false signals**
A: Enable "3H Confirmation" and increase strength requirements
**Q: Indicator not loading**
A: Check Pine Script version compatibility (requires v5)
### Parameter Adjustments
**For More Sensitive Signals:**
- Decrease Signal Sensitivity to 0.5-0.6
- Decrease Trend Strength Requirement to 0.6-0.7
- Increase Range Filter multiplier to 3.5-4.0
**For More Conservative Signals:**
- Increase Signal Sensitivity to 0.7-0.8
- Increase Trend Strength Requirement to 0.8-0.9
- Enable all confirmation features
### Performance Issues
- Reduce lookback periods if chart loads slowly
- Disable some visual elements for better performance
- Use on liquid stocks/indices for best results
---
## 📞 Support & Updates
This super indicator combines the best of Range Filter, PMAX, and Support/Resistance analysis specifically optimized for Indian market swing trading. The multi-component approach significantly improves signal quality while the built-in risk management features help protect capital.
**Remember:** No indicator is 100% accurate. Always combine with proper risk management, market analysis, and your trading experience for best results.
**Happy Trading! 🚀**

FVG 9:31–10:00 AM ETFVG 9:31–10:00 AM ET - Script Description
What This Script Does
This indicator finds **Fair Value Gaps (FVGs)** that form during the first 29 minutes of the U.S. stock market (9:31 AM to 10:00 AM Eastern Time). A Fair Value Gap is a price imbalance where there's a gap between candles that often becomes an important support or resistance level.
Key Features:
- **Time Window**: Only looks for FVGs between 9:31-10:00 AM ET (most important opening period)
- **One Per Day**: Finds only the first FVG that forms in this time window each day
- **Visual Display**: Draws a purple box around the gap with a clear "FVG" label
- **Price Tracking**: Monitors when price comes back to test the gap level
- **Alert System**: Sends notifications when price returns to the FVG zone
How FVGs Are Detected:
- **Bullish FVG**: When there's a gap up (low of middle candle is above high of 3rd candle back)
- **Bearish FVG**: When there's a gap down (high of middle candle is below low of 3rd candle back)
The 9:31-10:00 AM window is chosen because this is when institutions and algorithms create their biggest price moves right after market open, making these gaps very reliable.
Customization Options
User Settings
Extend FVG Box (Bars)
- **What it does**: Makes the purple box longer to the right
- **Default**: 0 (box ends right after the gap forms)
- **Options**: Any number from 0 to 100+
- **When to use**:
- Keep at 0 for clean historical view
- Set to 10-20 to track the gap during the current session
- Set higher for longer reference
Code Settings (Can Be Changed)
Time Window
- **Start**: 9:31 AM Eastern Time
- **End**: 10:00 AM Eastern Time
- **Can modify**: Change the hour/minute numbers in the code
Visual Style
- **Color**: Purple with see-through background
- **Label**: Shows "FVG" text in white
- **Can modify**: Change colors and transparency in the code
How to Use:
Setup
Chart Settings
1. Use 1-minute, 5-minute, or 15-minute charts (works best on these timeframes)
2. Apply to liquid markets like ES, NQ, major stocks, or forex pairs
3. Set the "Extend FVG Box" to your preference (start with 0 or 10)
What You'll See
- A purple box appears when an FVG forms during 9:31-10:00 AM
- Box shows the exact price levels of the gap
- "FVG" label appears on the box
- Only one FVG per day will be marked
Trading Strategies
Basic FVG Trading
1. **Wait for Formation**: Let the purple box appear during 9:31-10:00 AM
2. **Watch Price Movement**: See if price moves away from the gap
3. **Enter on Retest**: When price comes back to the purple box area, consider entering
4. **Trade Direction**:
- Bullish FVG = look for long opportunities when price retests
- Bearish FVG = look for short opportunities when price retests
Entry Methods
- **Bounce Play**: Enter when price touches the FVG box and bounces away
- **Break Play**: Enter if price strongly breaks through the FVG box
- **Rejection Play**: Enter opposite direction if price gets rejected at the FVG
Risk Management
Stop Losses
- Place stops just outside the FVG box (a few ticks beyond the gap)
- If trading a bounce, stop goes on opposite side of the gap
- If trading a break, stop goes back inside the gap
Position Sizing
- Start small until you understand how FVGs work in your market
- Bigger gaps = smaller position size (more risk)
- Smaller gaps = can use larger position size
Profit Targets
- Take profits at obvious levels like round numbers, previous highs/lows
- Consider taking half profits at 1:1 risk/reward ratio
- Let some position run if the move is strong
Best Practices
When It Works Best
- High-volume stocks and futures (ES, NQ work great)
- Normal market days without major news during the 9:31-10:00 window
- When there's clear institutional activity in the opening period
When to Be Careful
- Low-volume stocks or markets
- Major economic news releases during the time window
- Market holidays when volume is low
- Very choppy or sideways days
Alert Usage
- The script will alert you when price comes back to test the FVG
- Don't trade the alert blindly - always check the current market situation
- Use the alert as a heads-up to start watching the setup more closely
Tips for Success
- The earlier the FVG forms in the 9:31-10:00 window, often the more significant it is
- FVGs that form with high volume are usually more reliable
- Always consider the overall market direction - don't fight the main trend
- Practice on paper first to understand how FVGs behave in your chosen market
🔗 Works Best With:
✅ Liquidity Levels — Smart Swing Lows: Spot key structural lows that can fuel stop hunts and reversals.
✅ ICT Turtle Soup — Liquidity Reversal: Add a classic reversal pattern to your toolkit to catch fakeouts cleanly.
✅ ICT SMC Liquidity Grabs and OBs- Liquidity Grabs, Order Block Zones, and Fibonacci OTE Levels, allowing traders to identify institutional entry models with clean, rule-based visual signals.
This script is most valuable for day traders who want to catch institutional moves right after market open, but it can also help swing traders identify important intraday levels.
✅ ICT Macro Zones (Grey Box Version)- It tracks real-time highs and lows for each Silver Bullet session.
✅ Weekly Opening Gap (cryptonnnite)

Neuracap Gap AnalysisThe Neuracap Gap Analysis indicator is a comprehensive tool designed to identify and track price gaps, special candlestick patterns, and high-volume breakout signals. It combines multiple trading strategies into one powerful indicator for gap trading, pattern recognition, and momentum analysis.
🎯 What This Indicator Does
1. Gap Detection & Tracking
Automatically identifies price gaps (up and down)
Tracks gap fills with visual boxes that extend until closed
Manages gap history with customizable limits
Color-coded visualization (Green = Gap Up, Red = Gap Down)
2. Upside Tasuki Gap Pattern
Identifies the bullish continuation pattern
Colors candles yellow when pattern is detected
Confirms trend continuation signals
3. Episodic Pivot Detection
High-volume breakout identification
EMA filter ensures signals only in uptrends
Strong momentum confirmation
Fuchsia-colored candles with arrow markers
🔍 How to Use for Trading
📈 Gap Trading Strategy
Gap Up Trading:
Wait for gap up (green box appears)
Check volume - Higher volume = stronger signal
Entry options:
Aggressive: Enter at market open
Conservative: Wait for pullback to gap level
Stop loss: Below the gap fill level
Target: Previous resistance or 2:1 risk/reward
Gap Down Trading:
Identify gap down (red box appears)
Look for bounce opportunities
Entry: When price shows reversal signs
Stop: Below recent lows
Target: Gap fill level
💫 Tasuki Gap Strategy
Yellow candle indicates bullish continuation
Confirms uptrend is likely to continue
Entry: On next candle after pattern
Stop: Below the gap low
Target: Next resistance level
🚀 Episodic Pivot Strategy
Fuchsia candle + arrow = High probability breakout
All conditions met:
Price above EMA 20, 50, 200
High volume (2x+ average)
Strong price move (4%+)
Entry: At close or next open
Stop: Below EMA 20 or recent swing low
Target: Measured move or next resistance
📊 Reading the Visual Signals
Gap Boxes
🟢 Green Box: Gap up - potential bullish continuation
🔴 Red Box: Gap down - potential bounce or bearish continuation
Box extends until gap is filled
Box disappears when gap closes
Candle Colors
🟡 Yellow: Tasuki gap pattern (bullish continuation)
🟪 Fuchsia: Episodic pivot (high-volume breakout)
⬜ Normal: No special pattern detected
Arrows & Markers
⬆️ Triangle Arrow: Episodic pivot confirmation
💡 Trading Tips & Best Practices
✅ Do's
Combine with trend analysis - Trade gaps in direction of trend
Check volume - Higher volume = more reliable signals
Use multiple timeframes - Confirm on higher timeframes
Risk management - Always set stop losses
Wait for confirmation - Don't chase, let signals develop
❌ Don'ts
Don't trade all gaps - Focus on high-quality setups
Avoid low volume - Weak volume = unreliable signals
Don't ignore trend - Counter-trend trading is risky
Don't overtrade - Quality over quantity
Don't ignore context - Consider market conditions
⚠️ Risk Management
Position sizing: Risk 1-2% per trade
Stop losses: Always define before entry
Target levels: Set realistic profit targets
Market conditions: Avoid trading in choppy markets
📈 Performance Optimization
For Conservative Traders:
Increase minimum gap size to 1%
Set volume multiplier to 3.0x
Only trade episodic pivots in strong uptrends
Wait for gap fill confirmation
For Aggressive Traders:
Decrease minimum gap size to 0.3%
Set volume multiplier to 1.5x
Trade both gap types
Enter on pattern confirmation
🚨 Alert Setup
The indicator provides alerts for:
Gap Up Detected
Gap Down Detected
Upside Tasuki Gap
Episodic Pivot
Recommended: Enable all alerts and filter manually based on your strategy.
📝 Summary
This indicator excels at identifying high-probability trading opportunities through gap analysis, pattern recognition, and momentum confirmation. Use it as part of a complete trading system with proper risk management for best results.

Price Ranged FVG📌 Price Ranged FVG
Is a clean and efficient tool designed to detect Fair Value Gaps (FVGs) with adjustable filters and structural context. It’s especially useful for traders looking to filter out insignificant gaps and focus on high-probability areas, particularly around swing breaks or structural shifts.
🧠 What is a Fair Value Gap (FVG)?
A Fair Value Gap appears when there’s a price imbalance between candles — typically after a strong move — where the market skips over certain price levels without trading there. These zones can act as potential areas for price to return to (mean reversion), or serve as support/resistance depending on market structure.
🔍 FVG Detection Types
You can choose between three different detection modes under the "FVG Detection" input:
Same Type: Only detects FVGs where the last 3 candles are in the same direction (all bullish or all bearish).
All: Detects any FVG, regardless of candle direction.
Twin Close: Detects FVGs only when the last two candles are in the same direction and close accordingly — offering a stricter confirmation.
🎯 FVG % Filters
To filter out noise or insignificant gaps, this indicator includes:
Minimum FVG % Filter: Ignores FVGs smaller than your specified percentage of the current close.
Maximum FVG % Filter: Ignores overly large gaps that may be unreliable or caused by anomalies.
These filters help focus on relevant FVGs that are more likely to act as reaction zones.
🏛 Structural Context (Swing Highs and Lows)
The indicator plots swing highs and swing lows with dots to provide structure-based context:
Set Swing Strength to 3 for detecting internal structure (shorter-term moves).
Use a higher setting like 5 to focus on external structure (more significant highs/lows).
These levels can help you determine whether an FVG is forming within a consolidation, breakout, or key structural transition.
✅ Use Case (My Personal Workflow)
I personally use this indicator to:
Filter out weak or irrelevant FVGs using the % filters.
Watch for price interaction at swing breaks — especially when an FVG aligns with a break in internal or external structure.
Refine entry and exit planning in confluence with other tools or strategies.
⚠️ Disclaimer
This indicator is not financial advice. It is a technical analysis tool intended to support your own decision-making process. Always do your own research and risk management.

D3m4h GIFVGDescription
D3m4h GIFVG is an indicator designed to automatically detect market imbalances—often referred to as FVGs (Fair Value Gaps)—and potential pivot-based shifts in market structure. It offers a dynamic approach to visualizing supply/demand inefficiencies and pivot-based trend changes. Key features include:
1. Pivot-Based Bullish/Bearish Detection
The indicator identifies higher-high/lower-low pivot logic as well as “outside bar” pivots.
It tracks when the market transitions from bullish to bearish ranges, or vice versa, by using multiple checks:
Pivot low/high detection
Break-of-structure (when price crosses the last pivot)
Opposing FVG detection to confirm an intraday pivot shift
2. FVG (Fair Value Gap) Detection
The script automatically scans for bullish or bearish FVG conditions:
Bullish FVG: Candle at position (bar_index - 2) has a high below the current candle’s low.
Bearish FVG: Candle at position (bar_index - 2) has a low above the current candle’s high.
When it detects an FVG, it draws a box on the chart to highlight the price gap (yellow boxes by default).
3. Pivot Range FVG
If an FVG forms while the market is in a bullish pivot range, the script can paint a special “blue” FVG to underscore its significance. The same logic applies if a newly formed FVG appears in a bearish pivot range.
4. Filled Gap Cleanup
You can optionally hide standard FVG boxes once they’re filled. For example, if the candle’s body (or candle range) covers that gap, the box is removed to keep your chart clean.
5. Pivot-Range FVG “Raided” Cleanup
If the pivot-based FVG is later filled from the opposing direction, it turns green and can optionally remove itself after a set number of bars.
6. Informative Table
A small table on the chart optionally displays whether or not the pivot-based FVG has been “raided”. You can toggle this table on/off in the settings.
How It Works
1. Pivot Shifts
The script tracks the last pivot high/low using a combination of candle-based pivot detection and break-of-structure checks (when price crosses the last pivot in the opposite direction).
When a shift is detected, the pivot range ID increments—this helps the script know when to remove old pivot-based FVGs or draw new ones.
2. FVG Formation
Each new bar checks if a bullish or bearish FVG formed (comparing the high of bar two bars ago to the current low, or the low of bar two bars ago to the current high).
If one is found, a box is drawn to highlight the imbalance. Its color and extension depend on script settings.
3. Imbalance or Pivot FVG
Standard imbalance boxes appear in yellow.
If the new imbalance coincides with a bullish or bearish pivot range, a special “pivot imbalance” box in blue is drawn.
3. Hide Filled
If a newly formed candle’s body fully covers the FVG, the box is considered filled. If Hide Filled Gaps is enabled, the box is deleted once it’s covered.
4. Raid Status
For the pivot-based (blue) FVG, once price invalidates it from the opposite side, it changes color to green and gets removed after a user-defined number of bars.
How to Use
1. Look for FVGs
Observe yellow boxes to identify potential intraday imbalances. Watch for price returning to fill these zones.
If you see a “blue” box, it signifies a pivot-based FVG in line with a recognized shift in structure—arguably a higher-probability zone.
2. “Hide Filled Gaps”
Turn this on if you only want to see currently active or partially filled imbalances. The script cleans up old, fully covered boxes to keep your chart neat.
3. Pivot Shifts
Note the script’s internal pivot logic. Each new pivot re-defines bullish or bearish states. Use these states to gauge the short-term trend shifts.
4. Toggle the Table
You can show or hide the chart table by enabling/disabling “Show Table” from the inputs. This table indicates if the pivot-based “GIFVG” has been “raided” or not.
5. Extend Count
Adjust the extendCount in the code if you want FVG boxes to extend further or shorter in time.
Underlying Concepts
Fair Value Gaps
Market inefficiencies that occur when price jumps, leaving a “gap” from the candle 2 bars ago to the current candle. They can act like mini supply/demand zones where price may revisit for balance.
Pivot Ranges
The script tries to maintain an internal sense of whether the market is in a bullish or bearish pivot range. When it sees a contrary FVG or break-of-structure, it flips the pivot state.
Outside Bars
A candle that has both a higher high and a lower low than the previous bar. The script uses these to mark significant pivot shifts.
By combining pivot-based logic with FVG detection, the D3m4h GIFVG indicator helps highlight potential areas of liquidity or unfilled value. Traders can use these zones to plan entries/exits or to confirm short-term trend shifts.

FVG Radar [Mr_Rakun]The FVG Radar indicator is designed to automatically detect Fair Value Gaps (FVG) on your TradingView chart. It visually highlights bullish and bearish gaps with colored boxes and provides alerts when specific conditions are met.
How It Works
Fair Value Gap (FVG) Detection:
The script identifies gaps based on previous price action. A bullish FVG is recognized when there is a gap below a higher low candle, and a bearish FVG when there is a gap above a lower high candle.
Radar Area:
A yellow “Radar Area” box is drawn on the chart using upper and lower bands defined as a percentage above and below the current price. This area helps you visualize where the price is relative to these bands.
Alerts:
Alerts are triggered based on user-defined conditions:
When price crosses half of the gap (if the "Clear FVG When Price Reaches Half" option is enabled).
When price fully fills the gap (if the option is disabled).
The alert will only be activated after waiting a specified number of bars post-gap formation (as set by the "Wait X Bars After FVG Formation" parameter).
Input Parameters
Radar Upper Band (%):
Sets the upper threshold percentage relative to the current price for the radar area.
Radar Lower Band (%):
Sets the lower threshold percentage relative to the current price for the radar area.
Minimum FVG Size (%):
Determines the minimum size (as a percentage) for a gap to be recognized as a valid FVG.
Clear FVG When Price Reaches Half:
If enabled, the FVG will be cleared when the price reaches the midpoint of the gap. If disabled, the entire gap must be filled before it is cleared.
Wait X Bars After FVG Formation:
Specifies the number of bars to wait after an FVG is detected before triggering an alert. This delay helps to avoid premature alerts.
Bullish and Bearish FVG Colors and Opacity:
Customize the appearance of the FVG boxes for bullish (green) and bearish (red) gaps, including the opacity of these visual elements.
How to Use
Add the Indicator:
Load the FVG Radar indicator on your TradingView chart.
Customize Settings:
Adjust the input parameters based on your trading style and the market’s volatility. The radar area settings help you set your own visual reference for price deviations.
Monitor the Chart:
Watch for the colored boxes that represent FVGs. The boxes will display the size of the gap as a percentage.
Respond to Alerts:
When an alert is triggered after the specified number of bars, it indicates that the price has interacted with the gap. Use this information to guide your trading decisions.
Türkçe --------------------------------------------
FVG Radar göstergesi, TradingView grafiğinizde Fair Value Gap (FVG) – yani adil değer boşluklarını – otomatik olarak tespit etmek için tasarlanmıştır. Bu boşluklar, yükseliş ve düşüş boşluklarını farklı renkli kutularla vurgular ve belirli koşullar sağlandığında uyarılar verir.
Nasıl Çalışır
Fair Value Gap (FVG) Tespiti:
Gösterge, önceki fiyat hareketlerine dayalı olarak boşlukları belirler. Yükseliş boşluğu, düşük seviyenin yukarıdaki mumun altındaki boşlukla oluştuğu durumlarda; düşüş boşluğu ise, yüksek seviyenin aşağıdaki mumun üstünde boşluk oluştuğunda tespit edilir.
Radar Alanı:
Grafikte, mevcut fiyata göre belirlenen üst ve alt yüzde bantlarına dayalı olarak sarı renkte “Radar Alanı” kutusu çizilir. Bu alan, fiyatın bu bantlara göre nerede olduğunu görsel olarak anlamanıza yardımcı olur.
Uyarılar:
Kullanıcının belirlediği koşullara göre uyarılar verilir:
Fiyat, boşluğun yarısına ulaştığında (eğer "FVG'nin yarısına ulaştığında temizle" seçeneği etkinse).
Fiyat boşluğu tamamen doldurduğunda (seçenek devre dışı bırakıldığında).
Uyarı, boşluk oluşumundan sonra belirlenen bar sayısı kadar bekledikten sonra tetiklenir ("FVG Oluşumundan Sonra X Bar Bekle" parametresi).
Giriş Parametreleri
Radar Upper Band (%):
Mevcut fiyata göre radar alanı için üst eşik yüzdesini ayarlar.
Radar Lower Band (%):
Mevcut fiyata göre radar alanı için alt eşik yüzdesini ayarlar.
Minimum FVG Size (%):
Bir boşluğun geçerli bir FVG olarak tanınabilmesi için gereken minimum boyutu (yüzde olarak) belirler.
FVG'nin yarısına ulaştığında temizle:
Etkinse, fiyat boşluğun orta noktasına ulaştığında boşluk temizlenir. Devre dışı bırakılırsa, boşluğun tamamen doldurulması gerekir.
FVG Oluşumundan Sonra X Bar Bekle:
Bir FVG tespit edildikten sonra uyarı tetiklenmeden önce beklenmesi gereken bar sayısını belirler. Bu gecikme, erken uyarıların önüne geçmeyi amaçlar.
Yükseliş ve Düşüş FVG Renkleri ve Opaklık:
Yükseliş boşlukları (yeşil) ve düşüş boşlukları (kırmızı) için kutuların görünümünü ve opaklığını özelleştirmenize olanak tanır.
Nasıl Kullanılır
Göstergeyi Ekleyin:
FVG Radar göstergesini TradingView grafiğinize ekleyin.
Ayarları Özelleştirin:
Ticaret tarzınıza ve piyasanın oynaklığına göre giriş parametrelerini ayarlayın. Radar alanı ayarları, fiyat sapmalarını kendi görsel referansınızla tanımlamanıza yardımcı olur.
Grafiği İzleyin:
FVG’leri temsil eden renkli kutuları takip edin. Kutular, boşluğun yüzdelik büyüklüğünü gösterecektir.
Uyarılara Tepki Verin:
Belirlenen bar sayısı sonrasında tetiklenen uyarı, fiyatın boşluk ile etkileşime girdiğini gösterir. Bu bilgiyi, ticaret kararlarınızı yönlendirmek için kullanın.

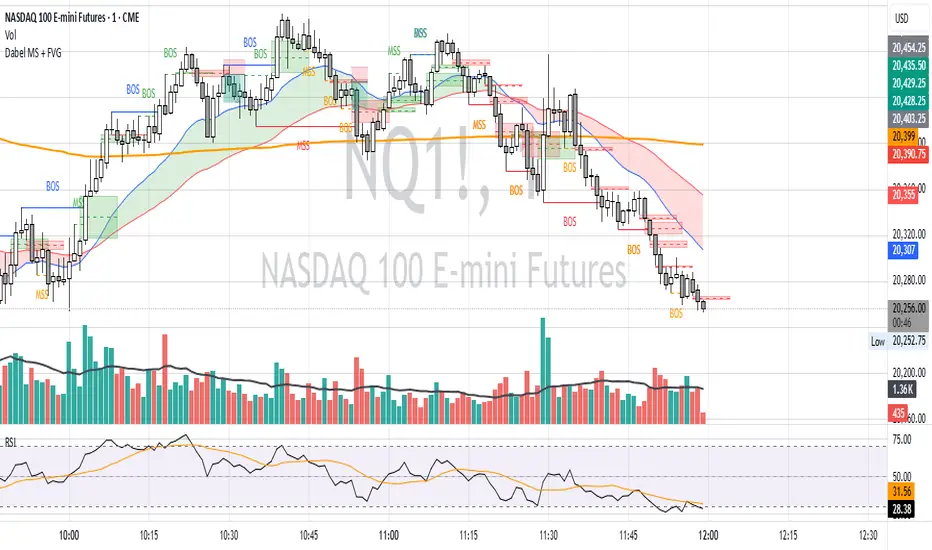
Dabel MS + FVGThis script is designed to assist traders by identifying market structures, imbalances, and potential trade opportunities using Break of Structure (BOS) and Market Structure Shifts (MSS). It visually highlights imbalances in price action, key pivots, and market structure changes, providing actionable information for making trading decisions.
Key features:
Imbalances Detection: Highlights bullish and bearish price gaps (Fair Value Gaps) using colored boxes. Users can choose the line style (solid, dashed, or dotted) for imbalance midlines.
Market Structure Analysis: Tracks pivot highs and lows to identify BOS and MSS in two separate market structures with adjustable pivot strengths.
Customizable Visualization: Allows users to choose line styles, colors, and display options for both imbalances and market structures.
Alerts: Alerts traders when BOS or MSS occur, helping to monitor the market effectively.
Trading Strategy
Imbalance Trading:
Imbalances (gaps) represent areas where supply or demand was left unfilled. These gaps often act as magnet zones where the price revisits to fill.
Bullish Imbalance: Look for buying opportunities when price enters a green imbalance zone.
Bearish Imbalance: Look for selling opportunities when price enters a red imbalance zone.
Use the midline of the imbalance box as a key reference point for potential reversals.
Break of Structure (BOS) and Market Structure Shift (MSS):
BOS: Indicates a continuation of the existing trend. For example:
Bullish BOS: Look for continuation in the uptrend after a high is broken.
Bearish BOS: Look for continuation in the downtrend after a low is broken.
MSS: Suggests a potential reversal in market structure. For example:
Bullish MSS: Indicates a possible shift from a bearish to bullish market.
Bearish MSS: Indicates a potential shift from a bullish to bearish market.
Multiple Market Structures:
This script provide two sets of market structures, allowing traders to compare short-term and long-term trends.
Adjust the pivot strength to suit your trading style (lower for intraday trading, higher for swing or positional trading).
Entry and Exit:
Entry: Look for entries near imbalances or after confirmed BOS/MSS in line with the overall trend.
Exit: Place stop-loss below/above recent pivots and take profit at nearby support/resistance or imbalance zones.
For New Traders
Focus on Basics: Understand what BOS and MSS mean and how they signal trend direction or reversals.
Use Alerts: Rely on the script's alert system to catch important moments without staring at charts all day.
Start Small: Test this strategy on a demo account before using it live. You can understand it more with practice.
FVG Detector (Gholam version)The Fair Value Gap (FVG) Detector is a powerful tool designed to identify and highlight potential imbalance areas in the market. Fair Value Gaps, also known as "FVG" or "Liquidity Gaps," are price ranges where there has been little or no trading activity. These gaps can often act as key levels of support or resistance and may represent areas where price is likely to return to for a fill, providing potential trading opportunities.
This indicator automatically scans and marks these gaps on the chart, helping traders quickly spot areas of interest for potential reversals or continuation patterns.

FVG Breakout/BreakdownThe FVG Breakout/Breakdown indicator is designed to identify potential breakout and breakdown opportunities in the market, based on the concept of Fair Value Gaps (FVGs). FVGs are areas where price moves too quickly, leaving behind gaps between candlesticks, often seen as areas of inefficiency or imbalance that the market tends to revisit.
Key Concepts:
Fair Value Gaps (FVG):
FVG occurs when a price gap is created between candlesticks, typically when the high of one candle is lower than the low of the previous candle (for a bearish FVG) or the low of one candle is higher than the high of the previous candle (for a bullish FVG).
These gaps represent an imbalance between buying and selling pressure, and the market often revisits them, making them valuable for identifying potential entry points.
Bullish FVG: This occurs when the low of the current candle is higher than the high of the previous candle.
Condition: low > high
Bearish FVG: This occurs when the high of the current candle is lower than the low of the previous candle.
Condition: high < low
Breakout/Breakdown Signals:
Breakout: A bullish breakout signal occurs when the price breaks above a defined resistance level after an FVG gap. This suggests that the market may continue moving higher.
Breakdown: A bearish breakdown signal occurs when the price breaks below a defined support level after an FVG gap. This suggests that the market may continue moving lower.
NWOG (New Week Opening Gap):
The NWOG can be used as an additional factor to confirm the FVG signal. The gap between Friday's close and Monday's open is a crucial level for identifying the start of a new move for the week.
NWOG helps to further refine the timing of breakout or breakdown signals, only triggering them when price moves relative to the Monday Open and shows a new direction.
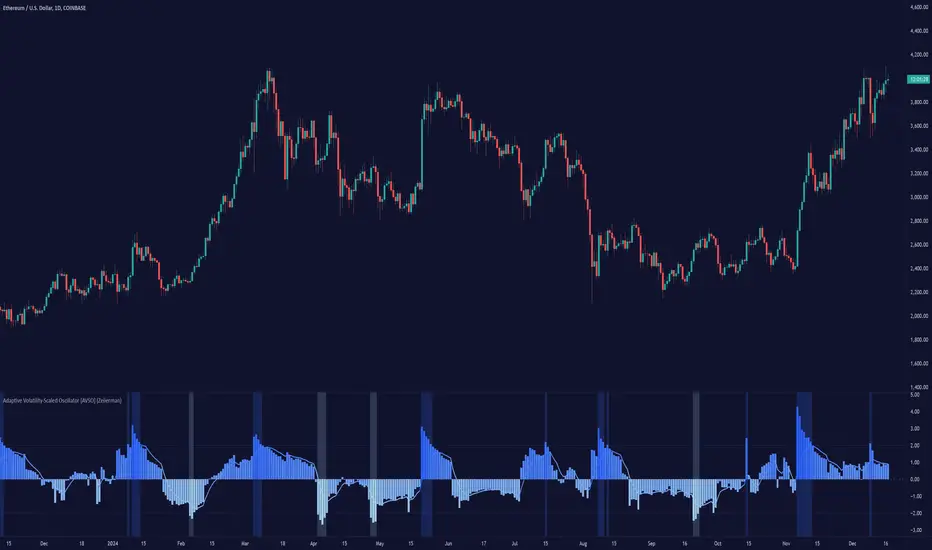
Adaptive Volatility-Scaled Oscillator [AVSO] (Zeiierman)█ Overview
The Adaptive Volatility-Scaled Oscillator (AVSO) is a dynamic trading indicator that measures and visualizes volatility-adjusted market behavior. By scaling various metrics (such as volume, price changes, standard deviation, ATR, and Yang-Zhang volatility) and applying adaptive smoothing, AVSO helps traders identify market conditions where volatility deviates significantly from the norm.
This indicator uses standardized scaling (Z-Score logic) to highlight periods of abnormally high or low volatility relative to recent history. With gradient coloring and clear volatility zones, AVSO provides a visually intuitive way to analyze market volatility and adapt trading strategies accordingly.
█ How It Works
⚪ Scaling Metrics: The indicator scales user-selected metrics (e.g., volume, ATR, standard deviation) relative to the market and price, providing a standardized volatility measure.
⚪ Z-Score Standardization: The scaled metric is normalized using a Z-Score to measure how far current volatility deviates from its recent mean.
Positive Z-Score: Above-average volatility.
Negative Z-Score: Below-average volatility.
⚪ Adaptive Smoothing: An Adaptive EMA smooths the Z-Score, dynamically adjusting its length based on the strength of the volatility. Stronger deviations result in shorter smoothing, increasing responsiveness.
█ Unique Feature: Yang-Zhang Volatility
The Yang-Zhang volatility estimator sets this indicator apart by providing a more robust and accurate measure of volatility compared to traditional methods like ATR or standard deviation.
⚪ What Makes Yang-Zhang Volatility Unique?
Comprehensive Calculation: It combines overnight price gaps (log returns from the previous close to the current open) and intraday price movements (high, low, and close).
Accurate for Gapped Markets: Traditional volatility measures can misrepresent price movement when significant gaps occur between sessions. Yang-Zhang accounts for these gaps, making it highly reliable for assets prone to overnight price jumps, such as stocks, cryptocurrencies, and futures.
Adaptable to Real Market Conditions : By including both close-to-open returns and intraday volatility, it provides a balanced and adaptive measure that captures the full volatility picture.
⚪ Why This Matters to Traders
Better Volatility Insights: Yang-Zhang offers a clearer view of true market volatility, especially in markets with price gaps or uneven trading sessions.
Improved Trade Timing: By identifying volatility spikes and calm periods more effectively, traders can time their entries and exits with greater confidence.
█ How to Use
Identify High and Low Volatility
A high Z-Score (>2) indicates significant market volatility. This can signal momentum-driven moves, breakouts, or areas of increased risk.
A low Z-Score (<-2) suggests low volatility or a calm market environment. This often occurs before a potential breakout or reversal.
Trade Signals
High Volatility Zones (background highlight): Monitor for potential breakouts, trend continuations, or reversals.
Low Volatility Zones: Anticipate range-bound conditions or upcoming volatility spikes.
█ Settings
Source: Select the price source for scaling calculations (close, high, low, open).
Metric Measure: Choose the volatility measure:
Volume: Scales raw volume.
Close: Uses closing price changes.
Standard Deviation: Price dispersion.
ATR: Average True Range.
Yang: Yang-Zhang volatility estimate.
Bars to Analyze: Number of historical bars used to calculate the mean and standard deviation of the scaled metric.
ATR / Standard Deviation Period: Lookback period for ATR or Standard Deviation calculation.
Yang Volatility Period: Period for the Yang-Zhang volatility estimator.
Smoothing Period: Base smoothing length for the adaptive smoothing line.
-----------------
Disclaimer
The information contained in my Scripts/Indicators/Ideas/Algos/Systems does not constitute financial advice or a solicitation to buy or sell any securities of any type. I will not accept liability for any loss or damage, including without limitation any loss of profit, which may arise directly or indirectly from the use of or reliance on such information.
All investments involve risk, and the past performance of a security, industry, sector, market, financial product, trading strategy, backtest, or individual's trading does not guarantee future results or returns. Investors are fully responsible for any investment decisions they make. Such decisions should be based solely on an evaluation of their financial circumstances, investment objectives, risk tolerance, and liquidity needs.
My Scripts/Indicators/Ideas/Algos/Systems are only for educational purposes!
XAUUSD Weekly Gap Indicator (oberlunar)The XAUUSD Weekly Gap Indicator is a technical tool designed specifically for tracking weekly price gaps in the XAUUSD (gold) market. It identifies and visualizes the price difference between the Friday close and the Monday open, providing valuable insights into market dynamics over the weekend.
Gap Detection:
Measures the price difference between Friday's closing price and Monday's opening price.
Highlights whether the gap is bullish (Monday opens above Friday’s close) or bearish (Monday opens below Friday’s close).
Visualization:
Draws a line or rectangle to connect the Friday close and the Monday open, clearly marking the gap on the chart.
Displays an indicator label with the gap value, often in pips or points, to quantify the gap size.
Color Coding:
Green: Bullish gap (positive price movement).
Red: Bearish gap (negative price movement).
Market Sentiment:
Large gaps can indicate significant market sentiment shifts due to weekend events, such as economic reports or geopolitical news.
Support and Resistance:
Weekly gaps often act as temporary support or resistance levels, as the market may attempt to revisit or "fill" the gap.
Trading Strategies:
Gap Filling: XAUUSD often tends to "fill" these gaps, providing trading opportunities.
Continuation or Reversal: The reaction to the gap can signal whether the trend is likely to continue or reverse.

Custom V2 KillZone US / FVG / EMAThis indicator is designed for traders looking to analyze liquidity levels, opportunity zones, and the underlying trend across different trading sessions. Inspired by the ICT methodology, this tool combines analysis of Exponential Moving Averages (EMA), session management, and Fair Value Gap (FVG) detection to provide a structured and disciplined approach to trading effectively.
Indicator Features
Identifying the Underlying Trend with Two EMAs
The indicator uses two EMAs on different, customizable timeframes to define the underlying trend:
EMA1 (default set to a daily timeframe): Represents the primary underlying trend.
EMA2 (default set to a 4-hour timeframe): Helps identify secondary corrections or impulses within the main trend.
These two EMAs allow traders to stay aligned with the market trend by prioritizing trades in the direction of the moving averages. For example, if prices are above both EMAs, the trend is bullish, and long trades are favored.
Analysis of Market Sessions
The indicator divides the day into key trading sessions:
Asian Session
London Session
US Pre-Open Session
Liquidity Kill Session
US Kill Zone Session
Each session is represented by high and low zones as well as mid-lines, allowing traders to visualize liquidity levels reached during these periods. Tracking the price levels in different sessions helps determine whether liquidity levels have been "swept" (taken) or not, which is essential for ICT methodology.
Liquidity Signal ("OK" or "STOP")
A specific signal appears at the end of the "Liquidity Kill" session (just before the "US Kill Zone" session):
"OK" Signal: Indicates that liquidity conditions are favorable for trading the "US Kill Zone" session. This means that liquidity levels have been swept in previous sessions (Asian, London, US Pre-Open), and the market is ready for an opportunity.
"STOP" Signal: Indicates that it is not favorable to trade the "US Kill Zone" session, as certain liquidity conditions have not been met.
The "OK" or "STOP" signal is based on an analysis of the high and low levels from previous sessions, allowing traders to ensure that significant liquidity zones have been reached before considering positions in the "Kill Zone".
Detection of Fair Value Gaps (FVG) in the US Kill Zone Session
When an "OK" signal is displayed, the indicator identifies Fair Value Gaps (FVG) during the "US Kill Zone" session. These FVGs are areas where price may return to fill an "imbalance" in the market, making them potential entry points.
Bullish FVG: Detected when there is a bullish imbalance, providing a buying opportunity if conditions align with the underlying trend.
Bearish FVG: Detected when there is a bearish imbalance, providing a selling opportunity in the trend direction.
FVG detection aligns with the ICT Silver Bullet methodology, where these imbalance zones serve as probable entry points during the "US Kill Zone".
How to Use This Indicator
Check the Underlying Trend
Before trading, observe the two EMAs (daily and 4-hour) to understand the general market trend. Trades will be prioritized in the direction indicated by these EMAs.
Monitor Liquidity Signals After the Asian, London, and US Pre-Open Sessions
The high and low levels of each session help determine if liquidity has already been swept in these areas. At the end of the "Liquidity Kill" session, an "OK" or "STOP" label will appear:
"OK" means you can look for trading opportunities in the "US Kill Zone" session.
"STOP" means it is preferable not to take trades in the "US Kill Zone" session.
Look for Opportunities in the US Kill Zone if the Signal is "OK"
When the "OK" label is present, focus on the "US Kill Zone" session. Use the Fair Value Gaps (FVG) as potential entry points for trades based on the ICT methodology. The identified FVGs will appear as colored boxes (bullish or bearish) during this session.
Use ICT Methodology to Manage Your Trades
Follow the FVGs as potential reversal zones in the direction of the trend, and manage your positions according to your personal strategy and the rules of the ICT Silver Bullet method.
Customizable Settings
The indicator includes several customization options to suit the trader's preferences:
EMA: Length, source (close, open, etc.), and timeframe.
Market Sessions: Ability to enable or disable each session, with color and line width settings.
Liquidity Signals: Customization of colors for the "OK" and "STOP" labels.
FVG: Option to display FVGs or not, with customizable colors for bullish and bearish FVGs, and the number of bars for FVG extension.
-------------------------------------------------------------------------------------------------------------
Cet indicateur est conçu pour les traders souhaitant analyser les niveaux de liquidité, les zones d’opportunité, et la tendance de fond à travers différentes sessions de trading. Inspiré de la méthodologie ICT, cet outil combine l'analyse des moyennes mobiles exponentielles (EMA), la gestion des sessions de marché, et la détection des Fair Value Gaps (FVG), afin de fournir une approche structurée et disciplinée pour trader efficacement.

FVG Price & Volume Graph [LuxAlgo]The FVG Price & Volume Graph tool plot recently detected fair value gaps relative to the volume traded within their area during their formation. This allows us to effectively visualize significant fair value gaps caused by high liquidity.
The indicator also returns levels from the fair value gaps areas average with the highest associated volume.
Do note that the indicator can consider the chart's visible range when being computed, which will recalculate the indicator when the chart's visible range changes.
🔶 USAGE
Fair Value Gaps (FVG) are core price action concepts occurring when the disparity between supply and demand is significant. Price has a tendency to come back to those areas and mitigating them, that is filling them.
The provided tools allow for effective visualization of both FVG's area's height as well as the volume originating from their creation, which is defined by the total traded volume located within the FVG during its creation. FVG's with more associated volume are displayed to the rightmost of the chart.
Users can determine the amount of most recent FVG's to display from the "Display Amount" setting. Disabling the "Consider Mitigation" setting will return mitigated FVGs in the plot, which can be useful to know where most FVGs were located.
We can use the area average of the FVGs with the most associated volume as potential support/resistance levels. Users can extend more FVG's averages by increasing the "Highest Volume Averages" setting.
🔹 Visualizing Volume/Price Relationships of FVG's
A linear regression is fit between FVG's areas average and their associated volume, with this linear regression helping us see where FVG's with specific volume might be located in the future based on existing FVG's.
Note that FVG's do not tend to exhibit linear relationships with their associated volume, the provided linear regression can give a general sense of tendency, but nothing necessarily accurate.
🔶 DETAILS
🔹 Intrabar Data TF
Given a formation of three candles causing an FVG, the volume traded within that FVG area is obtained by looking at the lower timeframe intrabar candles located within the intermediary candle of the formation. The volume of the intrabar candles located within the FVG areas is added up to obtain the associated volume of the FVG.
Using a lower "Intrabar Data TF" allows obtaining more precise volume results, at the cost of computation time and data availability (if there is a high difference between the "Intrabar Data TF" and the chart TF then less FVG can have their associated volume calculated due to Tradingview limitations).
🔹 Display
Users have access to multiple graphical settings affecting how the indicator is displayed.
The "Graph Resolution" setting determines the length of the X axis, with higher values returning more precise results on the location of FVGs over the X axis. Users can also control the number of labels displayed on the X-axis using the numerical input to the right of "Show X-Axis Labels".
Additionally, users can color FVG areas using a gradient relative to the size of the area, or the volume associated with the FVG.
🔶 SETTINGS
Display Amount: Amount of most recent FVGs to display.
Highest Volume Averages: Amount of FVG averages levels with the highest volume to display and extend.
Consider Mitigation: Only display unmitigated FVGs.
Filter FVGs Outside Visible Range: Only display FVGs areas that are located within the user chart visible range.
Intrabar Data TF: Timeframe used to obtain intrabar data. Should be lower than the user chart timeframe.

FVG Instantaneous Mitigation Signals [LuxAlgo]The FVG Instantaneous Mitigation Signals indicator detects and highlights "instantaneously" mitigated fair value gaps (FVG), that is FVGs that get mitigated one bar after their creation, returning signals upon mitigation.
Take profit/stop loss areas, as well as a trailing stop loss are also included to complement the signals.
🔶 USAGE
Instantaneous Fair Value Gap mitigation is a new concept introduced in this script and refers to the event of price mitigating a fair value gap one bar after its creation.
The resulting signal sentiment is opposite to the bias of the mitigated fair value gap. As such an instantaneously mitigated bearish FGV results in a bullish signal, while an instantaneously mitigated bullish FGV results in a bearish signal.
Fair value gap areas subject to instantaneous mitigation are highlighted alongside their average level, this level is extended until reached in a direction opposite to the FVG bias and can be used as a potential support/resistance level.
Users can filter out less volatile fair value gaps using the "FVG Width Filter" setting, with higher values highlighting more volatile fair value gaps subject to instantaneous mitigation.
🔹 TP/SL Areas
Users can enable take-profit/stop-loss areas. These are displayed upon a new signal formation, with an area starting from the mitigated FVG area average to this average plus/minus N ATRs, where N is determined by their respective multiplier settings.
Using a higher multiplier will return more distant areas from the price, requiring longer-term variations to be reached.
🔹 Trailing Stop Loss
A trailing-stop loss is included, increasing when the price makes a new higher high or lower low since the trailing has been set. Using a higher trailing stop multiplier will allow its initial position to be further away from the price, reducing its chances of being hit.
The trailing stop can be reset on "Every Signal", whether they are bullish or bearish, or only on an "Inverse Signal", which will reset the trailing when a signal of opposite bias is detected, this will preserve an existing trailing stop when a new signal of the same bias to the present one is detected.
🔶 DETAILS
Fair Value Gaps are ubiquitous to price action traders. These patterns arise when there exists a disparity between supply and demand. The action of price coming back and filling these imbalance areas is referred to as "mitigation" or "rebalancing".
"Instantaneous mitigation" refers to the event of price quickly mitigating a prior fair value gap, which in the case of this script is one bar after their creation. These events are indicative of a market more attentive to imbalances, and more willing to correct disparities in supply and demand.
If the market is particularly sensitive to imbalances correction then these can be excessively corrected, leading to further imbalances, highlighting a potential feedback process.
🔶 SETTINGS
FVG Width Filter: Filter out FVGs with thinner areas from returning a potential signal.
🔹 TP/SL
TP Area: Enable take-profit areas for new signals.
Multiplier: Control the distance from the take profit and the price, with higher values returning more distant TP's.
SL Area: Enable stop-loss areas for new signals.
Multiplier: Control the distance from the stop loss and the price, with higher values returning more distant SL's.
🔹 Trailing Stop
Reset Trailing Stop: Determines when the trailing stop is reset.
Multiplier: Controls the initial position of the trailing stop, with higher values returning more distant trailing stops.

Precise Gap FinderPrecise Gap Finder
This indicator identifies Fair Value Gaps (FVGs) in price action and it is perfect for traders looking to exploit price imbalances and capitalize on trading opportunities.
How It Works:
The Precise Gap Finder detects Fair Value Gaps by analyzing three consecutive candles. A gap is identified when the middle candle’s price range (open to close) is not overlapped by the high and low prices of the surrounding candles. This indicates a price imbalance, which can be a strong signal for potential market moves.
How to Use for Trading:
Identify Entry Points: Use the highlighted Fair Value Gaps to spot potential entry points. An upward FVG can indicate a potential buying opportunity, while a downward FVG can signal a potential selling opportunity.
Confirm Trends: Combine the FVG signals with other technical indicators to confirm trends and enhance the accuracy of your trades.
Risk Management: Use FVGs to identify potential stop-loss and take-profit levels. Gaps can serve as natural support and resistance levels.
Backtesting: Analyze historical data to understand how FVGs have impacted price movements in the past, helping you refine your trading strategy

Morning & Evening Star [TradingFinder] Stock Indices Gap Candle🔵 Introduction
In "technical analysis", there are certain reversal patterns that alert us to a potential reversal of a stock's previous trajectory.
Two significant patterns in this regard are the "Morning Star" pattern and the "Evening Star" pattern, which are formed by a combination of three different candlesticks and are considered as reversal patterns.
Here, we will examine how to identify these patterns and how to respond to them.
🟣 Morning Star Pattern
This pattern forms at the end of a downtrend and indicates the beginning of an uptrend.
The pattern consists of three candlesticks in the following order :
1.A large bearish candlestick
2.A candlestick with a short body
3.A bullish candlestick
With the formation of the morning star pattern, it is expected that the stock price will change direction and continue to rise. Therefore, in such situations, it is advisable to enter a long position and follow the uptrend.
Signs of the morning star pattern :
•The first sign of this pattern is the presence of a small-bodied candlestick at the end of the trend, accompanied by a gap from the previous candlestick (a bearish candlestick with a large body). Therefore, the bodies of the first and second candlesticks do not overlap.
•The second candlestick indicates market confusion and uncertainty. The color of the middle candlestick is not significant.
•The third candlestick must be positive and have a higher price than the previous candlestick (i.e., the small-bodied candlestick).
•The closing price of the third candlestick must be higher than half of the first candlestick.
🟣 Evening Star Pattern
This pattern forms at the end of an uptrend and indicates the beginning of a downtrend.
The pattern consists of three candlesticks in the following order :
1.A large bullish candlestick
2.A candlestick with a short body
3.A bearish candlestick
With the formation of the evening star pattern, it is expected that the stock price will change direction and continue to fall. Therefore, in such situations where this pattern is identified, it is advisable to refrain from entering a long position.
If the stock is traded in a two-way market, it is possible to profit by taking a short position after the formation of the evening star pattern.
Signs of the evening star pattern :
•The first sign of this pattern is the presence of a small-bodied candlestick at the end of the trend, accompanied by a gap from the previous candlestick (a bullish candlestick with a large body). Therefore, the bodies of the first and second candlesticks do not overlap.
•The second candlestick indicates market confusion and uncertainty. The color of the middle candlestick is not significant.
•The third candlestick must be negative and have a lower price than the previous candlestick (i.e., the small-bodied candlestick).
•The closing price of the third candlestick must be lower than half of the first candlestick.
🔵 How to Use
The "Filter" and "Market" features are available in the settings section, allowing you to customize the output of the indicator according to your needs.
With the "Filter" feature, you can filter the "Morning Star" and "Evening Star" patterns as "strong" or "weak." The difference between strong and weak patterns lies in their "Candle Body."
In strong patterns, the candle bodies account for more than 80% of the total candle range, while in weak patterns, the bodies comprise between 60% to 80% of the candle range.
If the "Filter" feature is set to "On," only strong patterns will be displayed. If it's set to "Off," all patterns will be displayed. By default, it's set to "Off."
The "Market" feature allows you to include "gaps" in your pattern identification calculations. You can choose between "Forex" and "Stock" modes. In the Forex pattern, calculations are performed without considering gaps since there are fewer gaps in the Forex market.
If gap calculations were to be part of the pattern identification conditions, only a very small number of patterns would be identified. However, in the "Stock" mode, gaps are considered as part of the identification conditions.

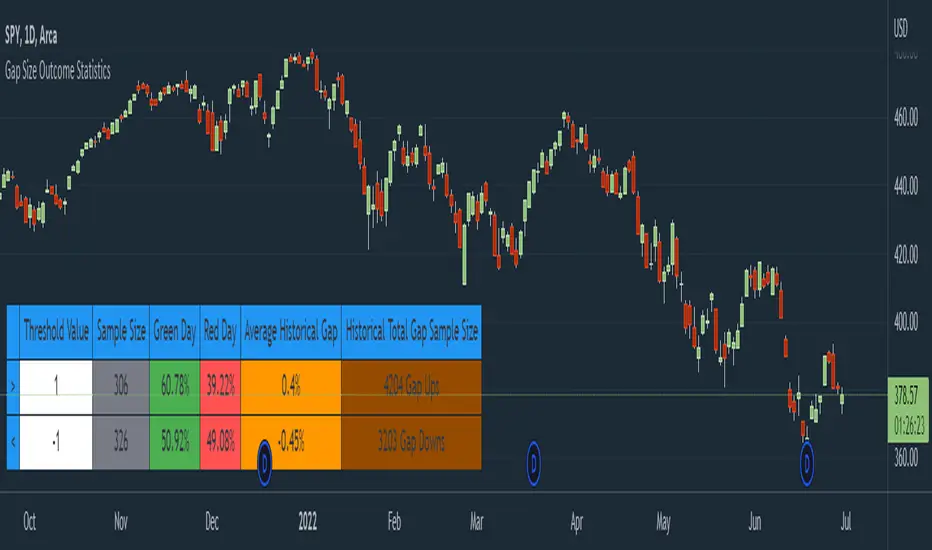
Gap Size Outcome Statistics [vnhilton]This indicator displays a table with statistics showing the outcomes of gap ups or downs based on your threshold (i.e. does the day end in green or red?). This can be useful for trading, where you're using relevant ETFs & see that they've gapped up/down, & can assume based on statistics that the ETF will end in green/red depending on which has the higher probability (however, you can use these on any other instruments such as stocks to find edges e.g. seeing whether stock XYZ is more likely to end in green/red when it gaps up 100%).
The table also includes sample sizes for your threshold tests for more confidence in the statistics, & also displays average gap up & downs & their respective sample sizes as well. This indicator is intended to be used on the daily timeframe, but can be used on lower or higher timeframes if you prefer.
In the chart snapshot image above, we can see that when the SPY gaps up > 1%, the day is more likely to end in green than in red. But when the SPY gaps down < -1%, it's also more likely to end in green than in red.
( IMPORTANT NOTE : There's 1 limitation with this indicator & it's that it assumes that days where close=open are green days, & that 0% gaps exact are considered gap ups.)
How to avoid repainting when using security() - PineCoders FAQNOTE
The non-repainting technique in this publication that relies on bar states is now deprecated, as we have identified inconsistencies that undermine its credibility as a universal solution. The outputs that use the technique are still available for reference in this publication. However, we do not endorse its usage. See this publication for more information about the current best practices for requesting HTF data and why they work.
This indicator shows how to avoid repainting when using the security() function to retrieve information from higher timeframes.
What do we mean by repainting?
Repainting is used to describe three different things, in what we’ve seen in TV members comments on indicators:
1. An indicator showing results that change during the realtime bar, whether the script is using the security() function or not, e.g., a Buy signal that goes on and then off, or a plot that changes values.
2. An indicator that uses future data not yet available on historical bars.
3. An indicator that uses a negative offset= parameter when plotting in order to plot information on past bars.
The repainting types we will be discussing here are the first two types, as the third one is intentional—sometimes even intentionally misleading when unscrupulous script writers want their strategy to look better than it is.
Let’s be clear about one thing: repainting is not caused by a bug ; it is caused by the different context between historical bars and the realtime bar, and script coders or users not taking the necessary precautions to prevent it.
Why should repainting be avoided?
Repainting matters because it affects the behavior of Pine scripts in the realtime bar, where the action happens and counts, because that is when traders (or our systems) take decisions where odds must be in our favor.
Repainting also matters because if you test a strategy on historical bars using only OHLC values, and then run that same code on the realtime bar with more than OHLC information, scripts not properly written or misconfigured alerts will alter the strategy’s behavior. At that point, you will not be running the same strategy you tested, and this invalidates your test results , which were run while not having the additional price information that is available in the realtime bar.
The realtime bar on your charts is only one bar, but it is a very important bar. Coding proper strategies and indicators on TV requires that you understand the variations in script behavior and how information available to the script varies between when the script is running on historical and realtime bars.
How does repainting occur?
Repainting happens because of something all traders instinctively crave: more information. Contrary to trader lure, more information is not always better. In the realtime bar, all TV indicators (a.k.a. studies ) execute every time price changes (i.e. every tick ). TV strategies will also behave the same way if they use the calc_on_every_tick = true parameter in their strategy() declaration statement (the parameter’s default value is false ). Pine coders must decide if they want their code to use the realtime price information as it comes in, or wait for the realtime bar to close before using the same OHLC values for that bar that would be used on historical bars.
Strategy modelers often assume that using realtime price information as it comes in the realtime bar will always improve their results. This is incorrect. More information does not necessarily improve performance because it almost always entails more noise. The extra information may or may not improve results; one cannot know until the code is run in realtime for enough time to provide data that can be analyzed and from which somewhat reliable conclusions can be derived. In any case, as was stated before, it is critical to understand that if your strategy is taking decisions on realtime tick data, you are NOT running the same strategy you tested on historical bars with OHLC values only.
How do we avoid repainting?
It comes down to using reliable information and properly configuring alerts, if you use them. Here are the main considerations:
1. If your code is using security() calls, use the syntax we propose to obtain reliable data from higher timeframes.
2. If your script is a strategy, do not use the calc_on_every_tick = true parameter unless your strategy uses previous bar information to calculate.
3. If your script is a study and is using current timeframe information that is compared to values obtained from a higher timeframe, even if you can rely on reliable higher timeframe information because you are correctly using the security() function, you still need to ensure the realtime bar’s information you use (a cross of current close over a higher timeframe MA, for example) is consistent with your backtest methodology, i.e. that your script calculates on the close of the realtime bar. If your system is using alerts, the simplest solution is to configure alerts to trigger Once Per Bar Close . If you are not using alerts, the best solution is to use information from the preceding bar. When using previous bar information, alerts can be configured to trigger Once Per Bar safely.
What does this indicator do?
It shows results for 9 different ways of using the security() function and illustrates the simplest and most effective way to avoid repainting, i.e. using security() as in the example above. To show the indicator’s lines the most clearly, price on the chart is shown with a black line rather than candlesticks. This indicator also shows how misusing security() produces repainting. All combinations of using a 0 or 1 offset to reference the series used in the security() , as well as all combinations of values for the gaps= and lookahead= parameters are shown.
The close in the call labeled “BEST” means that once security has reached the upper timeframe (1 day in our case), it will fetch the previous day’s value.
The gaps= parameter is not specified as it is off by default and that is what we need. This ensures that the value returned by security() will not contain na values on any of our chart’s bars.
The lookahead security() to use the last available value for the higher timeframe bar we are using (the previous day, in our case). This ensures that security() will return the value at the end of the higher timeframe, even if it has not occurred yet. In our case, this has no negative impact since we are requesting the previous day’s value, with has already closed.
The indicator’s Settings/Inputs allow you to set:
- The higher timeframe security() calls will use
- The source security() calls will use
- If you want identifying labels printed on the lines that have no gaps (the lines containing gaps are plotted using very thick lines that appear as horizontal blocks of one bar in length)
For the lines to be plotted, you need to be on a smaller timeframe than the one used for the security() calls.
Comments in the code explain what’s going on.
Look first. Then leap.

Gap Gain Test V1.0 by @overratedtraderOddball indicators for entertainment purposes only. This is best used on daily chart.
Look at the 20 ALMA to gauge likelihood of stock following its up or down gap.
- if above the 20 ALMA , follow the gap direction
- if below the 20 ALMA , take counter trend trade
If stock gaps up AND closes higher than it opens, that gain % (close/open) is colored green and if stock gaps down and closes lower than it opens, that gain % (close/open) is colored green
Conversely if the stock gaps up BUT closes lower than it opens, red and if a stop gaps down but closes higher than it opens, red.
Enjoy and follow me on twitter @overratedtrader for more nonsensical and out-of-the-box ideas.

Bitcoin vs M2 Global Liquidity (Lead 3M) - Table Ticker═══════════════════════════════════════════════════════════════
Bitcoin vs M2 Global Liquidity - Regression Indicator
═══════════════════════════════════════════════════════════════
TECHNICAL SPECS
• Pine Script v6
• Overlay: false (separate pane)
• Data sources: 5 M2 series + 4 FX pairs (request.security)
• Calculation: Rolling OLS linear regression with configurable lead
• Output: Regression line + ±1σ/±2σ confidence bands + R² ticker
CORE FUNCTIONALITY
Aggregates M2 money supply from 5 central banks (CN, US, EU, JP, GB),
converts to USD, applies time-lead, runs rolling linear regression
vs Bitcoin price, plots predicted value with confidence intervals.
CONFIGURABLE PARAMETERS
Input Controls:
• Lead Period: 0-365 days (default: 90)
• Lookback Window: 50-2000 bars (default: 750)
• Bands: Toggle ±1σ and ±2σ visibility
• Colors: BTC, M2, regression line, confidence zones
• Ticker: Position, size, colors, transparency
Advanced Settings:
• Table display: R², lead, M2 total, country breakdown (%)
• Ticker customization: 9 position options, 6 text sizes
• Border: Width 0-10px, color, outline-only mode
DATA AGGREGATION
Sources (via request.security):
• ECONOMICS:CNM2, USM2, EUM2, JPM2, GBM2
• FX_IDC:CNYUSD, JPYUSD (others: FX:EURUSD, GBPUSD)
• Conversion: All M2 → USD → Sum / 1e12 (trillions)
REGRESSION ENGINE
• Arrays: m2Array, btcArray (dynamic sizing, auto-trim)
• Window: Rolling (lookbackPeriod bars)
• Lead: Time-shift via array indexing (i + leadPeriodDays)
• Calc: Manual OLS (covariance/variance), no built-in ta functions
• Outputs: slope, intercept, r2, stdResiduals
CONFIDENCE BANDS
±1σ and ±2σ calculated from standard deviation of residuals.
Fill zones between upper/lower bounds with configurable transparency.
ALERTS
5 pre-configured alertcondition():
• Divergence > 15%
• Price crosses ±1σ bands (up/down)
• Price crosses ±2σ bands (up/down)
TICKER TABLE
Dynamic table.new() with 9 rows:
• R² value (4 decimals)
• Lead period (days + months)
• M2 Global total (trillions USD)
• Country breakdown: CN, US, EU, JP, GB (absolute + %)
• Optional: Hide/show M2 details
VISUAL CUSTOMIZATION
All plot() elements support:
• Color picker inputs (group="Couleurs")
• Line width: 1-3px
• Transparency: 0-100% for zones
• Offset: M2 plot has +leadPeriodDays offset option
PERFORMANCE
• Max arrays size: lookbackPeriod + leadPeriodDays + 200
• Calculations: Only when array.size >= lookbackPeriod + leadPeriodDays
• Table update: barstate.islast (once per bar)
• Request.security: gaps_off mode
CODE STRUCTURE
1. Inputs (lines 7-54)
2. Data fetch (lines 56-76)
3. M2 aggregation (line 78)
4. Array management (lines 84-95)
5. Regression calc (lines 97-172)
6. Prediction + bands (lines 174-183)
7. Plots (lines 185-199)
8. Ticker table (lines 201-236)
9. Alerts (lines 238-246)
DEPENDENCIES
None. Pure Pine Script v6. No external libraries.
LIMITATIONS
• Daily timeframe recommended (1D)
• Requires 750+ bars history for optimal calculation
• M2 data availability: TradingView ECONOMICS feed
• Max lines: 500 (declared in indicator())
CUSTOMIZATION EXAMPLES
• Shorter lookback (200d): More reactive, lower R²
• Longer lookback (1500d): More stable, regime mixing
• No bands: Set showBands=false for clean view
• Different lead: Test 60d, 120d for sensitivity analysis
TECHNICAL NOTES
• Manual OLS implementation (no ta.linreg)
• Array-based lead application (not plot offset)
• M2 values stored in trillions (/ 1e12) for readability
• Residuals array cleared/rebuilt each calculation
OPEN SOURCE
Code fully visible. Modify, fork, analyze freely.
No hidden calculations. No proprietary data.
VERSION
1.0 | November 2025 | Pine Script v6
═══════════════════════════════════════════════════════════════

RSI Value Table – match builtin🧭 Overview
“RSI Value Table – match builtin” displays the exact RSI value (identical to TradingView’s built-in RSI) for any selected timeframe — directly on your chart.
It’s designed for professional traders who need quick RSI confirmation without switching panels or opening multiple indicators.
⚙️ Core Logic
Reads RSI from any timeframe using request.security() with gaps_off and lookahead_off — ensuring a perfect match with the native RSI.
Optional EMA smoothing (non-standard) for visual stability.
Color-coded cell:
🟩 Green → RSI > 50 (bullish momentum)
🟥 Red → RSI < 50 (bearish momentum)
🟨 Yellow → Neutral zone around 50
Adjustable table position: top/bottom, left/right corners.
⚡ Alerts
Built-in alert conditions trigger automatically:
RSI > 50 → bullish momentum confirmation.
RSI < 50 → bearish momentum confirmation.
📈 How to Use
Select your preferred RSI timeframe (e.g., Daily, Weekly, 4H).
Watch the color-coded cell:
Green → trade long bias only.
Red → short bias only.
Ideal as a confirmation module for multi-timeframe systems or smart signal engines.

ADX MTF mura visionOverview
ADX MTF — mura vision measures trend strength and visualizes a higher-timeframe (HTF) ADX on any chart. The current-TF ADX is drawn as a line; the HTF ADX is rendered as “step” segments to reflect closed HTF bars without repainting. Optional soft fills highlight the 20–25 (trend forming) and 40–50 (strong trend) zones.
How it works
ADX (current TF) : Classic Wilder formulation using DI components and RMA smoothing.
HTF ADX : Requested via request.security(..., lookahead_off, gaps_off).
When a new HTF bar opens, the previous value is frozen as a horizontal segment.
The current HTF bar is shown as a live moving segment.
This staircase look is expected on lower timeframes.
Auto timeframe mapping
If “Auto” is selected, the HTF is derived from the chart TF:
<30m → 60m, 30–<240m → 240m, 240m–<1D → 1D, 1D → 1W, 1W/2W → 1M, ≥1M → same.
Inputs
DI Length and ADX Smoothing — core ADX parameters.
Higher Time Frame — Auto or a fixed TF.
Line colors/widths for current ADX and HTF ADX.
Fill zone 20–25 and Fill zone 40–50 — optional light background fills.
Number of HTF ADX Bars — limits stored HTF segments to control chart load.
Reading the indicator
ADX < 20: typically range-bound conditions; trend setups require extra caution.
20–25: trend emergence; breakouts and continuation structures gain validity.
40–50: strong trend; favor continuation and manage with trailing stops.
>60 and turning down: possible trend exhaustion or transition toward range.
Note: ADX measures strength, not direction. Combine with your directional filter (e.g., price vs. MA, +DI/−DI, structure/levels).
Non-repainting behavior
HTF values use lookahead_off; closed HTF bars are never revised.
The only moving piece is the live segment for the current HTF bar.
Best practices
Use HTF ADX as a regime filter; time entries with the current-TF ADX rising through your threshold.
Pair with ATR-based stops and a MA/structure filter for direction.
Consider higher thresholds on highly volatile altcoins.
Performance notes
The script draws line segments for HTF bars. If your chart becomes heavy, reduce “Number of HTF ADX Bars.”
Disclaimer
This script is for educational purposes only and does not constitute financial advice. Trading involves risk.
