Stochastics + CM Williams VixFix (Simple Buy Signal)📈 Stochastics + CM Williams VixFix (Simple Buy Signal)
This indicator combines two powerful tools to detect potential bottoming opportunities:
✅ Stochastics: Looks for momentum reversals. A signal is triggered when both %K and %D are below the oversold threshold (default: 20), suggesting the asset is deeply oversold.
✅ CM Williams Vix Fix: A volatility-based fear detector. When it spikes above its dynamic threshold, it indicates potential panic selling — often preceding a market bounce.
💡 Buy Signal is generated when:
%K and %D are both below 20
VixFix shows a volatility spike (green condition)
Use this script to identify high-probability reversal setups, especially during market corrections or panic phases.
Поиск скриптов по запросу "williams"
(mab) Williams %R, RSI, Stochastic and Stochastic RSIThis indicator can display a Williams %R and a second oscillator at the same time. RSI , Stochastic or Stochastic RSI can be displayed as second oscillator. Williams %R is configured with 21 length by default and adds a 13 EMA on it (like used by TRI ). There is an option to display divergences on the oscillators.

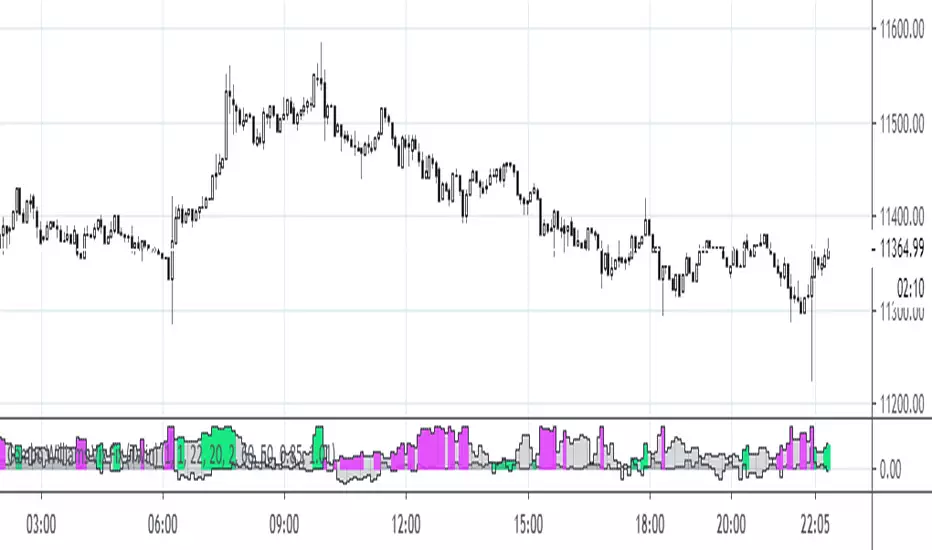
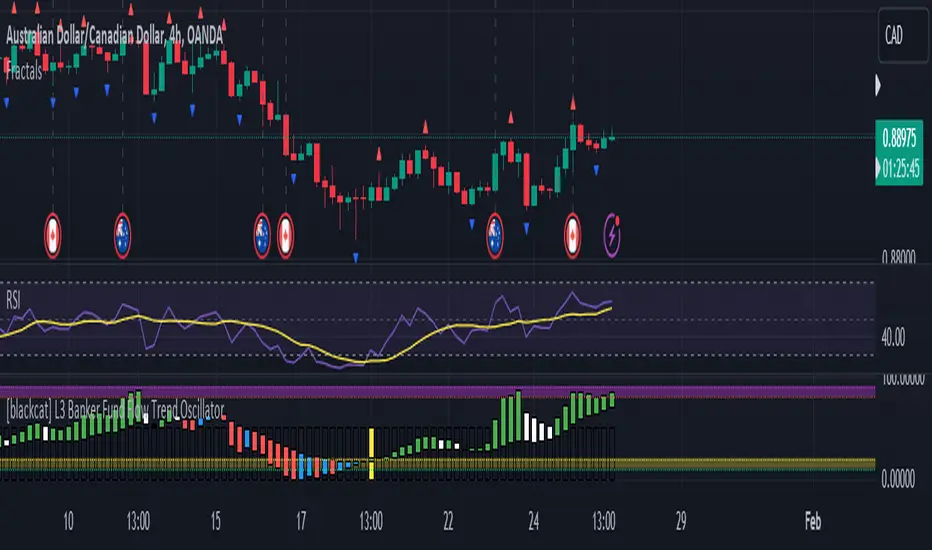
Bill Williams SystemBill Williams System combine all indicators of Mr. Bill Williams into one window with detail below:
1. Top of window:
Display Fractals with shape triangle down is bottom fractal and shape triangle up is top fractal
2. Bottom of window:
Display Alligator Trend Flat with trend defined as below:
* Up trend: Lips value shift 3 bars greater than Teeth value shift 5 bars. And Teeth value shift 5 bars greater than Jaws value shift 8 bars. By default up trend is green square.
* Down trend: Lips value shift 3 bars less than Teeth value shift 5 bars. And Teeth value shift 5 bars less than Jaws value shift 8 bars. By default down trend is red square.
* Choppy: not up trend and not down trend. By default choppy is gray square.
3. Moving around zero line
* Awesome Oscillator is circles.
* Accelerator Oscillator is columns.
* Gator Oscillator is area.

Bill Williams Divergent BarsBill William Bull/Bear divergent bars
See: Book, Trading Chaos by Bill Williams
Coded by polyclick
A bullish (green) divergent bar, signals a trend switch from bear -> bull
-> The current bar has a lower low than the previous bar, but closes in the upper half of the candle.
-> This means the bulls are pushing from below and are trying to take over, potentially resulting in a trend switch to bullish.
-> We also check if this bar is below the three alligator lines to avoid false positives.
A bearish (red) divergent bar, signals a trend switch from bull -> bear
-> The current bar has a higher high than the previous bar, but closes in the lower half of the candle.
-> This means the bears are pushing the price down and are taking over, potentially resulting in a trend switch to bearish.
-> We also check if this bar is above the three alligator lines to avoid false positives.
Best used in combination with the Bill Williams Alligator indicator.

Vince/Williams Bloodbath Sidestepping RuleThis is a defensive risk management tool designed to keep you on the sidelines during devastating market crashes. Drawing on the "Bloodbath" criteria outlined by Vince and Williams, this script highlights periods where market internals have structurally broken down, specifically when the percentage of New Lows exceeds a "danger" threshold (default 4%).
Unlike the Climax signal which looks for the end of a drop, this rule is designed to spot the acceleration phase of a decline. When the background turns red, it indicates that the market is in a liquidating phase where support levels are likely to fail. You should use this as a strict filter to avoid opening new long positions or to tighten stops on existing ones until the background color clears, signaling that the internal bleeding has stopped.

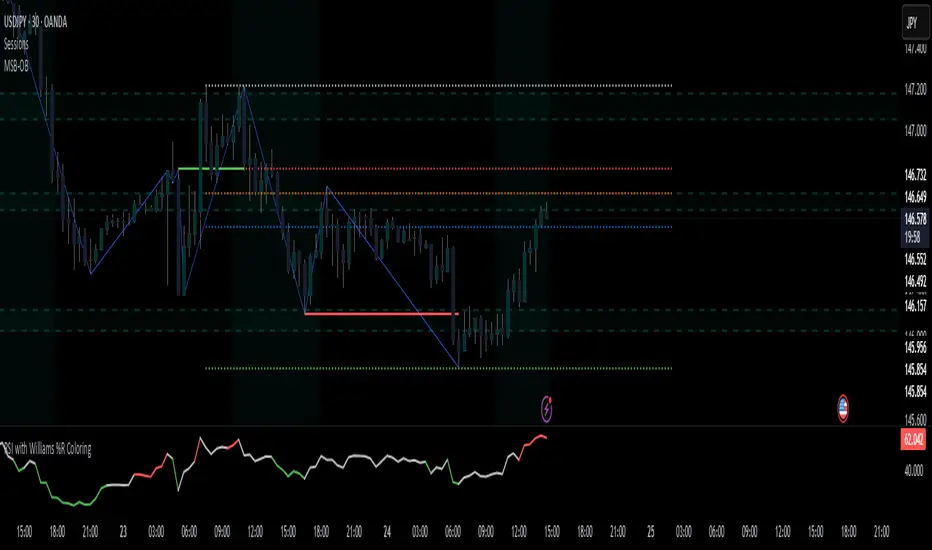
RSI with Williams %R Coloringsimple fusion of RSI to seek divergence and williams % R coloring to see overbought/oversold price.
not my own work, just merely took two standard indicators and infused them.
Triple Williams Alligator (MTF)This script is simply a Multi time frame version of the built in Williams Alligator script.
Higher time frame Alligators can often produce resistance and support as traders on different timeframes react to them. They can also act as a trend filter.
Carl's BOTTOM DETECTOR: Williams %R + normalized ATRThis script is based on Williams %r and normalized ATR.
When William%R indicates extreme oversold conditions
and the ATR indicates extreme volatility at the same time,
then it prints an arrow below the candle.
It is based on the concept that swing lows and market bottoms
are characterized by extreme oversold momentum and
extreme volatility.
The highest tf's like the daily, show you perfect market bottoms for btc.
If you zoom in it's still good to find swing highs and lows, if necessary
you can tweak the settings.
Next to that I added grey, red, and green vertical bands to the chart.
This is based on the VIX, the SPX volatility index.
Whenever the volatility of the S&P500 crosses above a specific level
it prints a colored background band behind the candle.
Grey means high volatility, red extreme volatility (like in the covid
crisis and 2008 crisis), and green means the same as grey, but indicates
it came after a red zone and could mean strong bullish bounce momentum.
You can tweak the thresholds for the grey/green and read areas.

Combo Williams Vix Fix (Twin version)This is a very powerful Williams' Vix Fix indicator.
My implementation of this wonderful indicator features both up and down movements. Both up & down flavors have two versions (fields tp and tp2, each having two values). Color can be reversed as desired (rev). By default colors show continuation, reversed colors show reversion (as intended originally).
Pretty Williams FractalsThis script adds Williams Fractals that are more visually pleasing than TradingView's built-in version.

2xIchimoku Cloud + 4xMA + Williams FractalUpdated version of the previously published multi-indicator which includes
4x Moving Averages
2x Ichimoku Clouds
Bill Williams Fractals
Changes:
-Toggle switches for each indicator on input tab for easy on/off
-MA Type Selector (EMA/SMA/WMA/VWMA)
-Various default style change
Many thanks to both redwraith and jedireza for helping me work out the MA section
www.tradingview.com
www.tradingview.com
Next improvements: Ichimoku settings
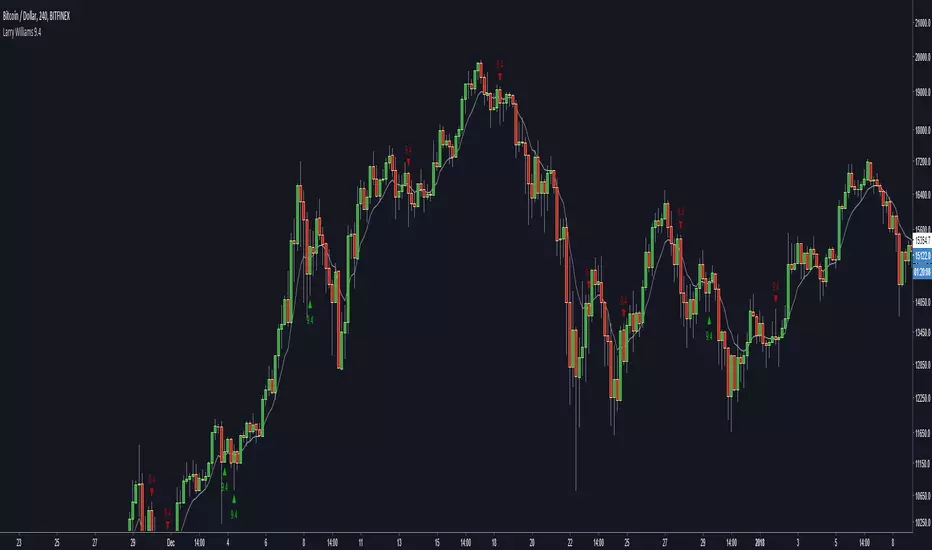
Larry Williams 9.4 [zauoyds]This script was made to find in real time the setup 9.4, made by trader Larry Williams .
This indicator just help to find the entries described by setup 9.4.
You need to know the setup and use this indicador as helper.
The indicator shows when the 9.4 is configured. The trigger to go long is the next candle high is higher than previus candle high. To go short, the low needs to be lower than previus low.
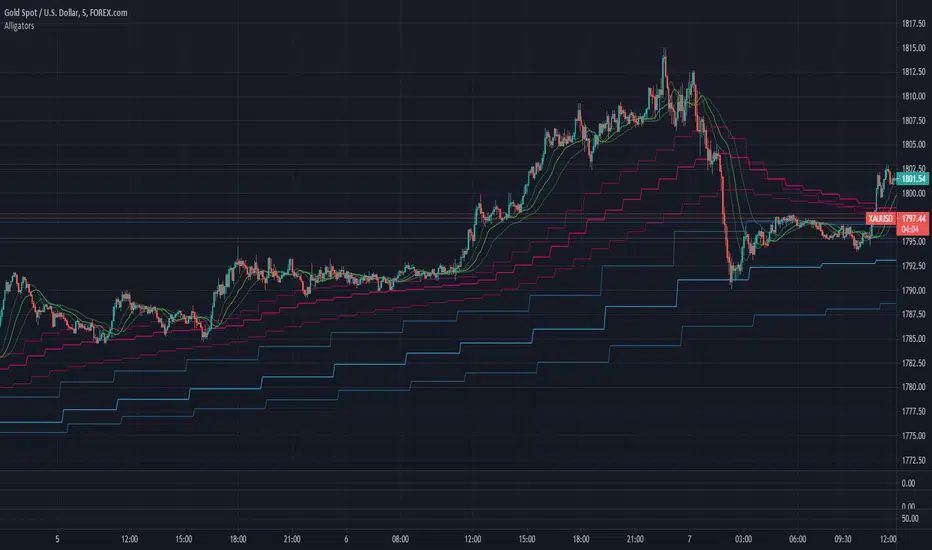
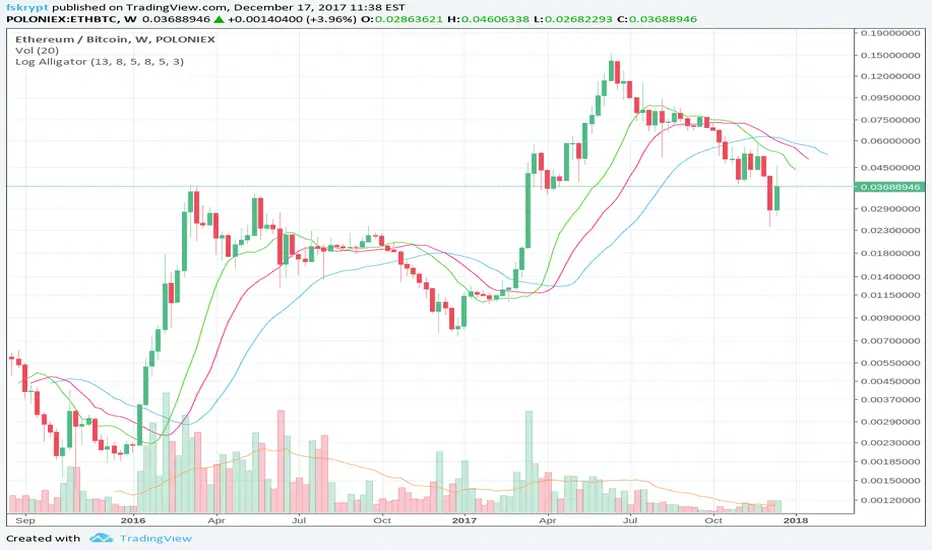
Log-space Williams AlligatorMake Williams Alligator usable for looking at weekly and high-volatility crypto charts.
The built-in indicator may have some problems with these charts, as in example below:
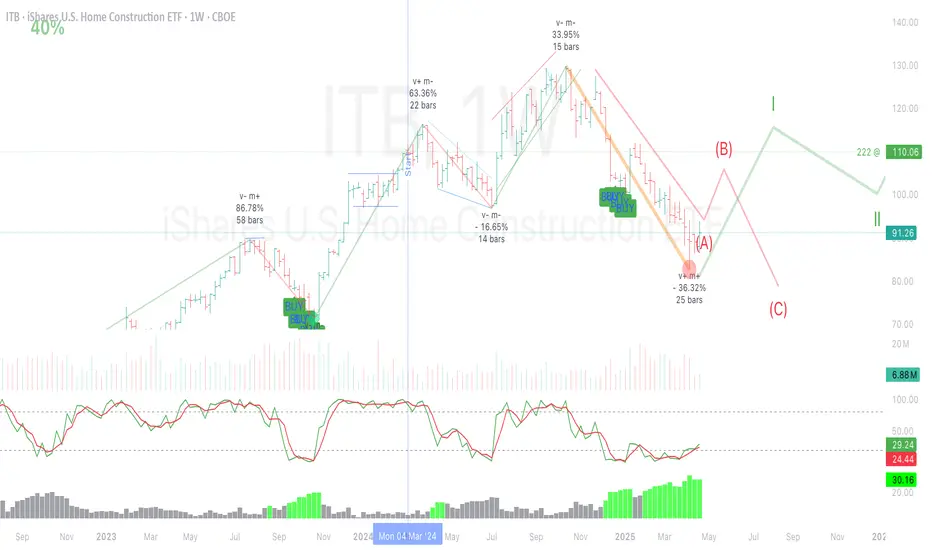
True Williams Alligator (Timeframe Multiplier)Modified version of the true alligator indicator (ie SMMA) that features a timeframe multiplier so that you can monitor the elliott wave of higher timeframes. (See original "True Williams Alligator" for more details.)
Note: First script submission. Didn't mean to use this chart. Also this is a duplicate post -- oops.

True Williams Alligator (SMMA)The built-in implementation of the alligator is incorrect. It uses SMA with altered input parameters to approximate the true alligator indicator.
The alligator was created with a supercomputer to model the elliott wave - it's very apart from other MA techniques. The built-in approximation (and similar techniques) and the true alligator yield very different conclusions. Hence the need for this, a true and exact implementation of "The Mighty Alligator" (Bill Williams, Trading Chaos 1, New Trading Dimensions, Trading Chaos 2).
Note: First script submission. Didn't mean to use this chart. Ugly and messy. Oops.


Fractals V9 ModifiedSo taking Ricardo Santos script for fractals V9 -I change the time function of the high TF fractal to non repainting one
adding daily fib levels
This hybrid seems to look nice . I have to admit that all credit to Ricardo Santos for his exelent script.
thi work it hybrid work and not so much original work....
The main improvment is the signals which are not reapinting as we remove security from that.
Security function exist for daily fib but it has nothing to do wih signal generation so i did not touch it

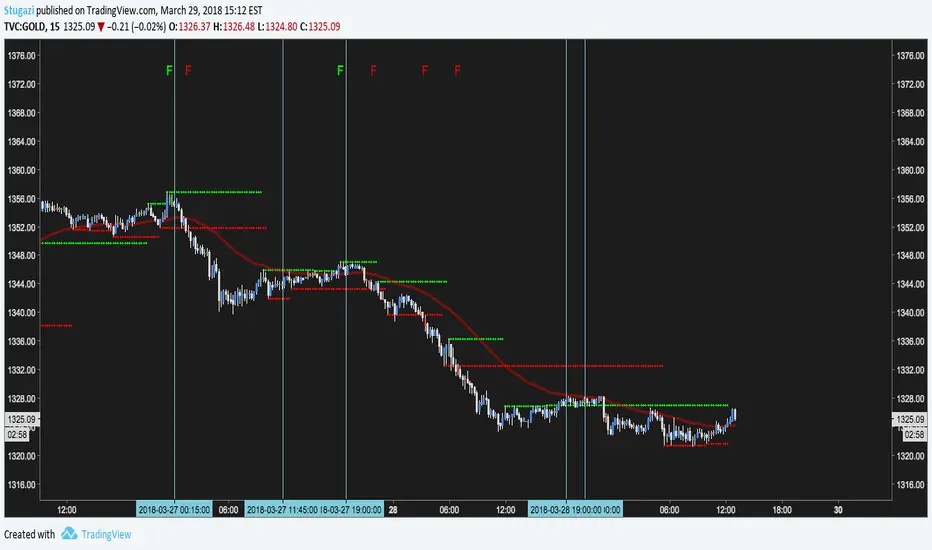
Fractal Support ResistanceTroubleshooting this script.
The vertical lines are when the alerts fired in TradingView. Along the top a green F is LONG signal and red F is SHORT. Signals fire only after CLOSING for two consecutive bars above or below a fractal. Also there is a min delay of 12 bars between signals.
The alerts are configured identical to the F character plots. Not sure why the alerts are randomly firing. =(
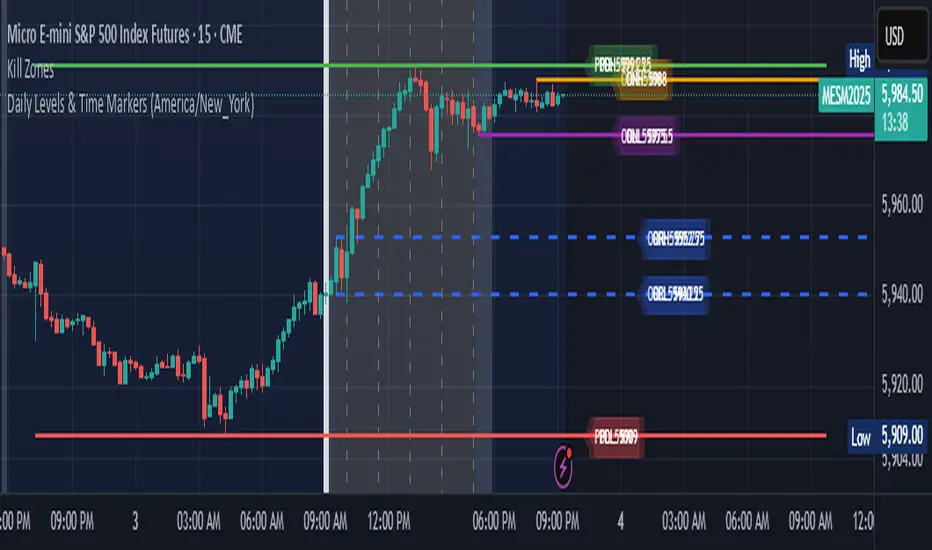
Daily Levels & Time MarkersKey Features:
Price Level Tracking:
Previous Day High/Low (PDH/PDL) - Shows yesterday's highest and lowest prices as horizontal lines
Overnight High/Low (ONH/ONL) - Tracks the highest and lowest prices during overnight sessions (4:00 PM to 9:30 AM ET)
Opening Range High/Low (ORH/ORL) - Captures the price range during the first 30 minutes of regular trading (9:30-10:00 AM ET)
Visual Elements:
Draws horizontal lines for previous day levels that extend across the chart
Creates rays (extending lines) for overnight and opening range levels that project forward from when they were established
Uses different colors and line styles for each level type (solid lines for daily levels, dashed for opening range)
Adds text labels showing the exact price values (PDH, PDL, ONH, ONL, ORH, ORL)
Time Markers:
Draws vertical dashed lines at key trading times: 10:00 AM, 11:30 AM, 1:00 PM, 2:30 PM, and 4:00 PM ET
Uses Eastern Time zone by default but allows customization
Customization Options:
Toggle each feature on/off independently
Customize colors for all line types
Adjust timezone settings
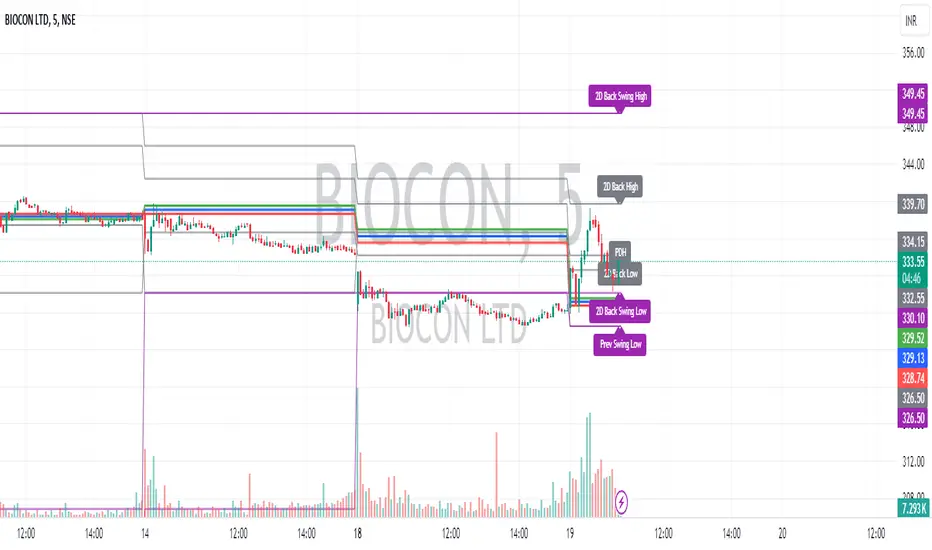
Intraday CPR with Previous Highs and Lows and Swing Highs/LowsThis Pine Script indicator plots the Central Pivot Range (CPR) for the current trading day along with previous day's high (PDH), low (PDL), and swing high/low (Swing H/L) values. It also includes the high, low, and swing high/low values from two days back for reference.
Key Features:
Central Pivot Range (CPR):
Pivot Point (PP): The central pivot point.
Bottom Central Pivot (BC): The lower boundary of the CPR.
Top Central Pivot (TC): The upper boundary of the CPR.
The area between the BC and TC is shaded for better visualization.
Previous Day and Two Days Back Values:
Previous Day High (PDH) and Low (PDL): Plots the high and low of the previous trading day.
Two Days Back High and Low: Plots the high and low from two trading days ago.
Previous Day Swing High/Low: The highest high and lowest low from a specified period (swing period) of the previous trading day.
Two Days Back Swing High/Low: The highest high and lowest low from a specified period (swing period) of two trading days ago.

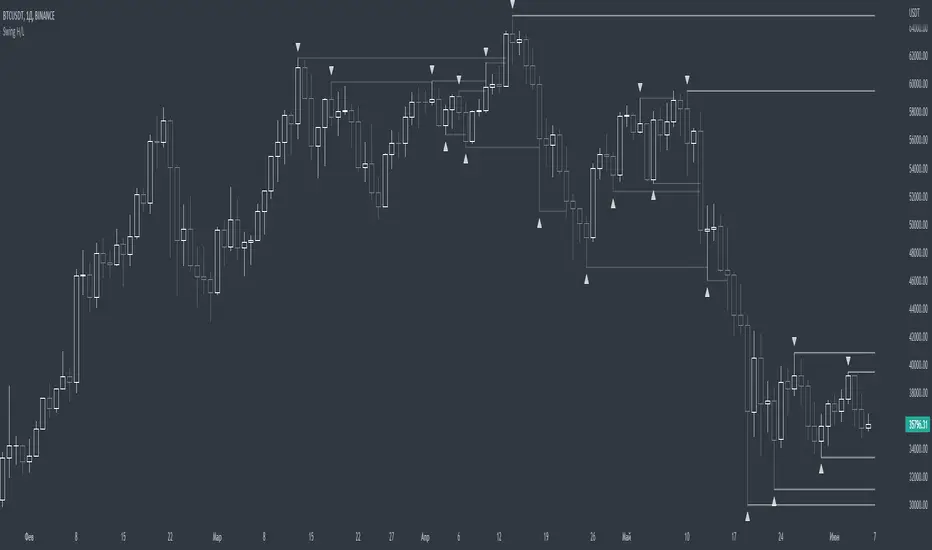
Swing PointsEnglish:
The indicator shows the fractals where stop-losses may be located and can be used to trade from their taking.
You can adjust the length of the fractal (the number of bars with which it is surrounded on both sides, to confirm the validity).
You can also display lines from fractal points for clarity.
To keep the chart clean, you can enable deletion of already taken fractals.
Example of use with deleted fractals and without lines:
Русский:
Индикатор показывает фракталы где могут находиться стоп-лоссы и его можно использовать для торговли от их снятия.
Можно настраивать длину фрактала (количество баров, которыми он окружен с обеих сторон, для подтверждения валидности).
Так же можно выводить линии от фрактальных точек для наглядности.
Для сохранения чистоты графика можно включить удаление уже снятых фракталов.
Пример использования с удалением снятых фракталов и без линий: