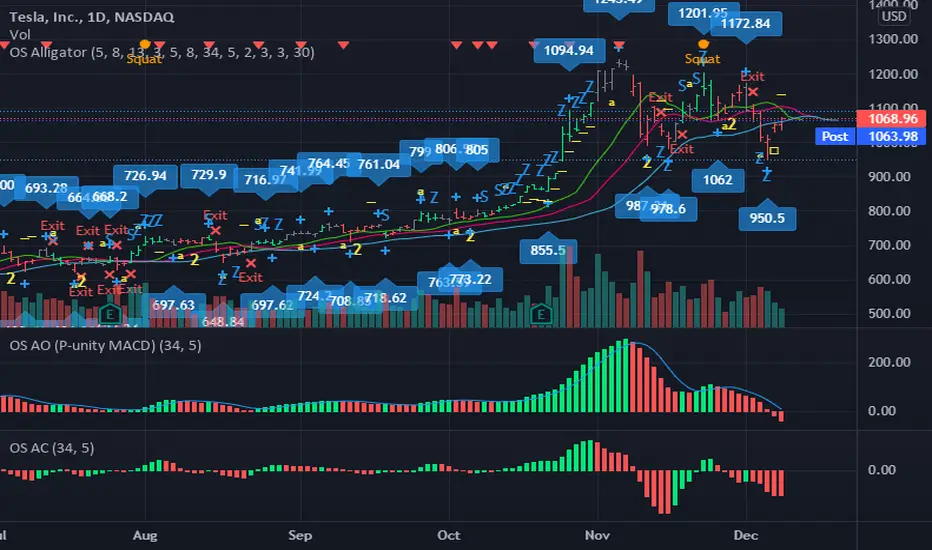
OS AlligatorOS Alligator includes Bill and Justine Williams´ indicators explained both in their "New Trading Dimensions" and "Trading Chaos: Second Edition" books. This script replicates the visual alerts shown on their graphs.
OS Alligator includes:
- Fractals (with labels for easy reading)
- Divergent Bars (signaled by top and bottom triangles)
- Zone bar colors (the bar is green when both AO and AC are green, red when both are red, and black when different)
- Zone buys and sells (subsequent AO of the same color), with letter Z
- Saucer buys and sells, with letter S
- Highest High and Lowest Low tracking (for traling stop setting)
- Balance line (Teeth) crossover alerts
and of course the Alligator's Mouth (Lips, Teeth, Jaw) with SMMA.
All these functions are customizable both in periods and in color. For example if you want to modify the Fractal or HiLo periods you can do so.
You can also add alerts based on any or all indicators.
Thank you for reading. Any comments for improvement are welcome.
-ownsov
Поиск скриптов по запросу "williams"
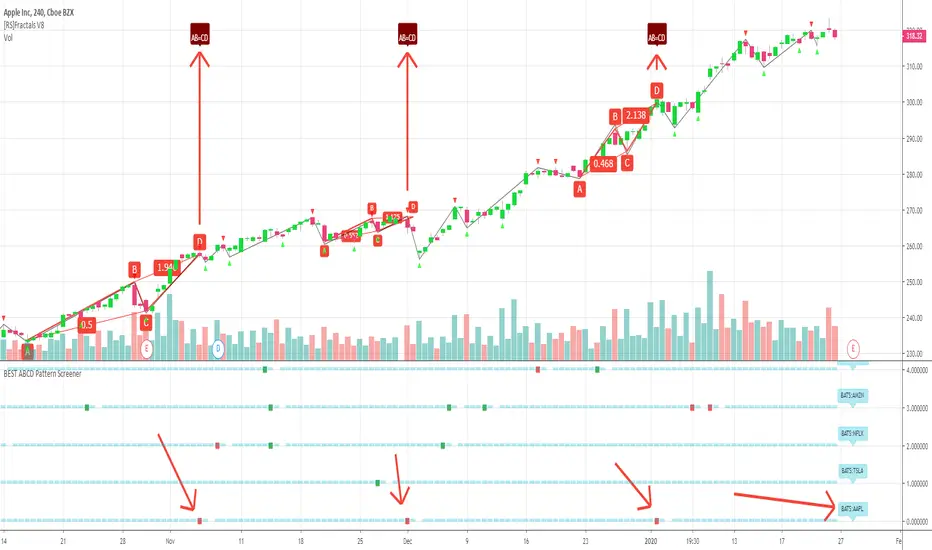
BEST ABCD Pattern ScreenerHello ladies and gentlemen traders
Continuing deeper and stronger with the screeners' educational series one more time.
This one is heavy crazy mega cool (pardon my french).
I - Concept
I present to you, ladies and gentlemen, the first screener for harmonic patterns.
Starting with an ACBD pattern screener this time!!
I used the calculations from Ricardo Santo's script
In short, he's using fractals (regular or Bill Williams ) for the pattern calculations. A masterpiece !!!
The screener will show in 1 consolidated chart the ABCD patterns for 5 selected assets. Could be stocks, forex, crypto, whatever you feel like making money with
II - Definitions
The ABCD pattern ( AB=CD ) is one of the classic chart patterns which is repeated over and over again.
The ABCD pattern shows perfect harmony between price and time.
More info here
The Williams Fractal is an indicator, developed by Bill Williams, that aims to detect reversal points (highs and lows) and marks them with arrows.
Up fractals and down fractals have specific shapes. The Williams Fractal indicator helps users determine in which direction price will develop
Source: www.tradingview.com
III - How did I set the screener
The visual signals are as follow:
- square: whenever there is an ABCD pattern detected
Then the colors are:
- green when a bullish pattern is detected
- red when a bearish pattern is detected
🔸 The script screenshot shows two red squares matching two ABCD bearish pattern from the above panel. As the chart is showing APPL, I highlighted where the screener mentioned the fruit stock ( APPLE, pun, bad joke, Dave out...)
🔸 I tried to make it as clear as I could with red arrows
Once again, we pushed together the limits of pine script beyond of what we thought was possible, beyond the realm of this world, reaching finally the dreamt pine script heaven (am I going too far? feel free to tell me)
Best regards,
Dave
Ultimate Balance OscillatorIntroducing the Ultimate Balance Oscillator: A Powerful Trading Indicator
Built upon the renowned Rate of Change (ROC), Relative Strength Index (RSI), Commodity Channel Index (CCI), Williams Percent Range, and Average Directional Index (ADX) from TradingView, this indicator equips traders with an unparalleled understanding of market dynamics.
What sets the Ultimate Balance Oscillator apart is its meticulous approach to weighting. Each component is assigned a weight that reflects its individual significance, while carefully mitigating the influence of highly correlated signals. This strategic weighting methodology ensures an unbiased and comprehensive representation of market sentiment, eliminating dominance by any single indicator.
Key Features and Benefits:
1. Comprehensive Market Analysis: The Ultimate Balance Oscillator provides a comprehensive view of market conditions, enabling traders to discern price trends, evaluate momentum shifts, identify overbought or oversold levels, and gauge the strength of prevailing trends. This holistic perspective empowers traders to make well-informed decisions based on a thorough understanding of the market.
2. Enhanced Signal Accuracy: With its refined weighting approach, the Ultimate Balance Oscillator filters out noise and emphasizes the most relevant information. This results in heightened signal accuracy, providing traders with a distinct advantage in identifying optimal entry and exit points. Say goodbye to unreliable signals and welcome a more precise and dependable trading experience.
3. Adaptability to Various Trading Scenarios: The Ultimate Balance Oscillator transcends the constraints of specific markets or timeframes. It seamlessly adapts to diverse trading scenarios, accommodating both short-term trades and long-term investments. Traders can customize this indicator to suit their preferred trading style and effortlessly navigate ever-changing market conditions.
4. Simplicity and Ease of Use: The Ultimate Balance Oscillator simplifies trading analysis by providing a single line on the chart. Its straightforward interpretation and seamless integration into trading strategies make decision-making effortless. By observing bullish or bearish crossovers with the moving average, recognizing overbought or oversold levels, and tracking the overall trend of the oscillator, traders can make well-informed decisions with confidence.
5. Real-time Alerts: Stay ahead of the game with the Ultimate Balance Oscillator's customizable alert system. Traders can set up personalized alerts for bullish or bearish crossovers, breaches of overbought or oversold thresholds, or any specific events that align with their trading strategy. Real-time notifications enable timely action, ensuring traders never miss lucrative trading opportunities.
The Ultimate Balance Oscillator is a robust trading companion, empowering traders to make shrewd and calculated decisions. Embrace its power and elevate your trading endeavors to new heights of precision and success. Discover the potential of the Ultimate Balance Oscillator and unlock a world of trading possibilities.

Rsi/W%R/Stoch/Mfi: HTF overlay mini-plotsOverlay mini-plots for various indicators. Shows current timeframe; and option to plot 2x higher timeframes (i.e. 15min and 60min on the 5min chart above).
The idea is to de-clutter chart when you just want real-time snippets for an indicator.
Useful for gauging overbought/oversold, across timeframes, at a glance.
~~Indicators~~
~RSI: Relative strength index
~W%R: Williams percent range
~Stochastic
~MFI: Money flow index
~~Inputs~~
~indicator length (NB default is set to 12, NOT the standard 14)
~choose 2x HTFs, show/hide HTF plots
~choose number of bars to show (current timeframe only; HTF plots show only 6 bars)
~horizontal position: offset (bars); shift plots right or left. Can be negative
~vertical position: top/middle/bottom
~other formatting options (color, line thickness, show/hide labels, 70/30 lines, 80/20 lines)
~~tips~~
~should be relatively easy to add further indicators, so long as they are 0-100 based; by editing lines 9 and 11
~change the vertical compression of the plots by playing around with the numbers (+100, -400, etc) in lines 24 and 25

Kijun Trend IndicatorName: Kijun Trend Indicator
Category: Trend Analysis
Timeframe: All timeframes
Suggested usage: In a trending market, to understand when it is good to enter short (red line) and when to enter long (blue line).
Technical Analysis: The original idea was taken from Larry Williams: an uptrend is identified when the price is above an 18-period simple moving average (SMA) and when at least two candles do not touch the simple moving average with their lows. The opposite is true for a downtrend.
Corrado Rondelli has therefore reinterpreted with Ichimoku aka "ichimokized" replacing the 18-period Simple Moving Average with the 26-period Kijun - as per the original Ichimoku settings.
In order to make the indicator more flexible an Exponential Moving Average (EMA) has also been added.
The indicator plots the chosen line that becomes red when it is good to enter short and blue when it is good to enter long.
Configuration:
- Length: period to be used to calculate the line.
- Type: the line type that can be the Kijun (26-period) or SMA/EMA (18-period)

Larry Williams Strategies IndicatorThis indicator is a trend following indicator. It plots some of the trend following strategies described by Larry Williams in his book 'Long Term Secrets to Short Term Trading'. Below are types of trend following strategies you can trade using this indicator. These are notes taken directly from Larry Williams' book.
Short Term Low Strategy
Short Term Low - Any daily low with higher lows on each side of it.
Intermediate Term Low – Any short term low with higher short term lows on each side of it.
Long Term Low – Any intermediate term low with higher intermediate term lows on each side of it.
Conceptual pattern for best buying opportunity is when forming an intermediate term low higher than the last intermediate term low.
This setup can be used on all time frames. However since Larry Williams usually trades the daily chart, the daily chart is probably the best timeframe to trade using this strategy.
Entry point – High of the day that has a higher high on the right side of it.
(My interpretation: price crossing above the high of the previous day is the buy signal)
Target – Markets have a strong tendency to rally above the last intermediate term high by the same amount it moved from the last intermediate term high to the lowest point prior to advancing to new highs.
Trailing Stop – Set stop to most recent short term low, move up as new short term lows are formed. Can also use formation of next intermediate term high as an exit point.
A 'run' to the upside is over when price fails to move higher the next day and falls below the prior day's low.
Short Term High Strategy
Short Term High - Any daily high with lower highs on each side of it.
Intermediate Term High – Any short term high with lower short term highs on each side of it.
Long Term High – Any intermediate term high with lower intermediate term highs on each side of it.
Conceptual pattern for best selling opportunity is when forming an intermediate term high lower than the last intermediate term high.
This setup can be used on all time frames. However since Larry Williams usually trades the daily chart, the daily chart is probably the best timeframe to trade using this strategy.
Entry point – Low of the day that has a lower low on the right side of it.
(My interpretation: price crossing below the low of the previous day is the sell short signal)
Target – Markets have a strong tendency to fall below the last intermediate term low by the same amount it moved from the last intermediate term low to the highest point prior to declining to new lows.
Trailing Stop – Set stop to most recent short term high, move down as new short term highs are formed. Can also use formation of next intermediate term low as an exit point.
A 'run' to the downside is over when price fails to move lower the next day and rises above the prior day's high.
Trend Reversals
A trend change from down to up occurs when a short term high is exceeded on the upside, a trend change from up to down is identified by price going below the most recent low.
Can take these signals to make trades, but it is best to filter them with a confirmation or edge such as Trading Day of the Week, Trading Day of the Month, trendlines, etc. to cut down on false signals.
Three Bar High/Low System
Calculate a three bar moving average of the highs and a three bar moving average of the lows.
Strategy is to buy at the at the price of the three bar moving average of the lows - if the trend is positive according to the swing point trend identification technique - and take profits at the three bar moving average of the highs.
Selling is just the opposite. Sell short at the three bar moving average of the highs and take profits at the three bar moving average of the lows, using the trend identification technique above for confirmation.
This strategy can work on any timeframe, but was described as a daytrading system by Larry Williams.

BTC - AXIS: Coppock + Williams %R CompositeTitle: BTC - AXIS: Coppock + Williams %R Composite | RM
Overview & Philosophy
AXIS (Advanced X-Momentum Intensity Score) is a specialized momentum composite designed to identify market structural shifts. In physics, an axis is the central line around which a body rotates; in this indicator, the Zero-Baseline acts as the AXIS for capital flow.
By fusing a slow-moving momentum engine ( Coppock Curve ) with a high-sensitivity tactical oscillator ( Williams %R ), this tool filters out the "market noise" that leads to overtrading and focuses on the high-conviction "Trend-Aligned Dips."
Methodology
Most indicators either suffer from too much lag (Moving Averages) or too much noise (Standard RSI). AXIS solves this through "Speed-Balanced Normalization."
1. Macro Engine (Coppock Curve): Named after Edwin Coppock, this component identifies major market bottoms by smoothing two separate Rates of Change (RoC). It is your structural compass.
2. Tactical Trigger (Williams %R): Created by Larry Williams, this measures the current close relative to the High-Low range.
• Re-centered Logic: Standard Williams %R oscillates between 0 and -100. Here, this is re-centered to oscillate around zero, ensuring it interacts mathematically correctly with the Coppock baseline.
3. The AXIS Score: The Composite line (Orange) is the weighted sum of these two engines. It provides a singular view of the market's "Net Momentum Intensity."
How to Read the Chart
🟧 The AXIS Composite (Orange Line): The primary signal line. It tracks the speed and exhaustion of the price by fusing macro and tactical data.
• Red Zone (> 150): Overheated. Short and long-term momentum are at extreme highs. Risk of a blow-off top or local reversal is high.
• Green Zone (< -150): Capitulation. The market is statistically exhausted. Historically, these zones represent high-conviction accumulation areas.
• Bullish Momentum (> 0): The market is rotating above the central Axis. Buyers are in control of the trend.
• Bearish Momentum (< 0): The market is rotating below the central Axis. Sellers are in control of the trend.
🟦 The Coppock Line (Blue): The macro filter. When Blue is above 0, the long-term trend is up.
🟥 The Williams %R Line (Red): The short-term cycles. Watch for divergences here to spot early trend fatigue.
Strategy: The "AXIS Alignment" Signal
The highest-conviction entry point—and the primary "Alpha" of this tool—occurs when:
The macro trend is Bullish ( Blue Line > 0 ).
The market experiences a correction, pushing the Orange (AXIS) Line into the Green Capitulation Zone.
The AXIS Score turns back upward.
This indicates that a short-term panic has been absorbed by a long-term bull trend—the ideal "Buy the Dip" scenario.
Settings
• Long/Short RoC: Standardized to 14/11 for cycle accuracy.
• Weighting: Allows you to prioritize trend (Coppock) or cycle sensitivity (%R).
• Visibility Toggles: Fully customizable display switches for each line.
Credits
• Edwin Coppock: For the foundation of long-term recovery momentum.
• Larry Williams: For the Percent Range methodology.
⚠️ Note: This indicator is optimized for the Daily (1D) Timeframe. Please switch your chart to 1D for accurate signal reading.
Disclaimer
This script is for research and educational purposes only. Past performance does not guarantee future results.
Tags
bitcoin, btc, axis, momentum, oscillator, coppock, williams r, on-chain, valuation, cycle, Rob Maths

WillStop Pro [tradeviZion]WillStop Pro : A Step-by-Step Guide for Beginners to Master Trend Trading
Welcome to an in-depth guide to the WillStop Pro indicator. This article will walk you through the key features, how to use them effectively, and how this tool can help you navigate the markets confidently. WillStop Pro is based on principles established by Larry Williams, a well-known figure in trading, and aims to help you manage trades more effectively without overcomplicating things.
This guide will help you understand the basics of the WillStop Pro indicator, how to interpret its signals, and how to use it step-by-step to manage risk and identify opportunities in your trading journey. We will also cover the underlying logic and calculations for advanced users interested in more details.
What is the WillStop Pro Indicator?
The WillStop Pro indicator is a user-friendly tool that helps traders establish stop levels dynamically. It helps you figure out optimal points to enter or exit trades, while managing risk effectively during changing market conditions. The indicator tracks trending markets and sets price levels as stops for ongoing trades, making it suitable both for deciding when to enter and exit trades.
The indicator is beginner-friendly because it simplifies complex calculations and presents the results visually. This allows traders to focus more on their decision-making process instead of spending time with complex analysis.
WillStop Pro adapts to different market conditions, whether you're trading stocks, forex, commodities, or cryptocurrencies. It adjusts stop levels dynamically based on current market momentum, providing a practical way to manage both risk and reward.
Another significant benefit of WillStop Pro is that it works well with other indicators. Beginners can use it on its own or combine it with other tools like moving averages or oscillators to form a comprehensive trading strategy. Whether you are trading daily or looking at longer-term trends, WillStop Pro helps you manage your trades effectively.
Key Features of WillStop Pro
Dynamic Stop Levels : WillStop Pro calculates real-time stop levels for both long (buy) and short (sell) positions. This helps you protect your profits and reduce risk. The stop levels adjust based on the current market environment, making them more adaptable compared to fixed stop levels.
Advanced Stop Settings : There are optional settings to make the stop calculations more advanced, which take into consideration previous price movements to refine where the stops should be placed. These settings provide more precise control over your trades.
Break Signals and Alerts : The indicator provides visual signals, like arrows, to show when a stop level has been broken. This makes it easier for you to identify possible reversals and understand when the market direction is changing.
Comprehensive Table Display : A small table on the chart shows the current trend, the stop level, and whether advanced mode is active. This simple display provides an overview of the market, making decision-making easier.
Based on Larry Williams' Methodology : WillStop Pro builds upon Larry Williams' ideas, which are designed to capture major market trends while managing risk effectively. It provides a systematic way to follow these strategies without requiring deep technical analysis skills.
How Are Stop Levels Calculated? (For Advanced Users)
The WillStop Pro indicator determines stop levels by evaluating highs, lows, and closing prices over a specific lookback period. It uses this information to identify key points that justify adjusting your stop level, and there are separate approaches for both long and short positions.
Below, we explain the mathematical logic behind the stop calculations, along with some code snippets to give advanced users a clearer understanding.
For Long Stops (buy positions): The indicator looks for the highest closing price within the lookback period and continues until it finds three valid bars that meet certain criteria. Stops are adjusted to skip bars that have consecutive upward closes to ensure that the stop is placed at a level that offers solid support. Specifically, the function iterates over recent bars to determine the highest closing value, and checks for specific conditions before finalizing the stop level. Here is an excerpt of the relevant code:
getTrueLow(idx) => math.min(low , close )
findStopLevels() =>
float highestClose = close
int highestCloseIndex = 0
for i = 0 to lookback
if close > highestClose
highestClose := close
highestCloseIndex := i
// Logic to adjust based on up close skipping
int longCount = 0
int longCurrentIndex = highestCloseIndex
while longCount < 3 and longCurrentIndex < 100
if not isInsideBar(longCurrentIndex)
longCount += 1
longCurrentIndex += 1
// Determine the lowest low for the stop level
float longStopLevel = high * 2
for i = searchIndex to highestCloseIndex
longStopLevel := math.min(longStopLevel, getTrueLow(i))
// Apply offset
longStopLevel := longStopLevel - (offsetTicks * tickSize)
In this code snippet, the function findStopLevels() calculates the long stop level by first identifying the highest close within the lookback period and then finding a suitable support level while skipping certain conditions, such as inside bars or consecutive upward closes. Finally, the user-defined offset ( offsetTicks ) is applied to determine the stop level.
For Short Stops (sell positions): Similarly, the indicator finds the lowest closing price within the lookback period and then identifies three bars that fit the conditions for a short stop. It avoids using bars with consecutive down closes to help find a more robust resistance level. Here's a relevant code snippet:
getTrueHigh(idx) => math.max(high , close )
findStopLevels() =>
float lowestClose = close
int lowestCloseIndex = 0
for i = 0 to lookback
if close < lowestClose
lowestClose := close
lowestCloseIndex := i
// Logic to adjust based on down close skipping
int shortCount = 0
int shortCurrentIndex = lowestCloseIndex
while shortCount < 3 and shortCurrentIndex < 100
if not isInsideBar(shortCurrentIndex)
shortCount += 1
shortCurrentIndex += 1
// Determine the highest high for the stop level
float shortStopLevel = 0
for i = searchIndex to lowestCloseIndex
shortStopLevel := math.max(shortStopLevel, getTrueHigh(i))
// Apply offset
shortStopLevel := shortStopLevel + (offsetTicks * tickSize)
Here, findStopLevels() calculates the short stop level by finding the lowest closing price within the lookback period. It then determines the highest value that acts as a resistance level, excluding bars that do not fit certain criteria.
Volume Confirmation for Alert Accuracy : To further enhance the stop level accuracy, volume is used as a confirmation filter. The average volume (volAvg) is calculated over a 20-period moving average, and alerts are only generated if the volume exceeds a defined threshold (volMultiplier). This ensures that price movements are significant enough to consider as meaningful signals.
volAvg = ta.sma(volume, 20)
isVolumeConfirmed() =>
result = requireVolumeConfirmation ? volume > (volAvg * volMultiplier) : true
result
This additional logic ensures that stop level breaks or adjustments are not triggered during periods of low trading activity, thus enhancing the reliability of the generated signals.
These calculations are at the core of WillStop Pro's ability to determine dynamic stop levels that respond effectively to market movements, helping traders manage risk by placing stops at levels that make sense given historical price and volume data.
How to Identify Opportunities with WillStop Pro
WillStop Pro provides various signals that help you decide when to enter or exit a trade:
When a Stop Level is Broken: If a stop level (support for long positions or resistance for short positions) is broken, it may indicate a reversal. WillStop Pro visually plots arrows whenever a stop level is breached, making it easy for you to see where changes might occur. This feature helps traders identify momentum shifts quickly.
Support and Resistance Levels: The indicator plots support and resistance levels, which show key zones to watch for opportunities. These levels often act as psychological barriers in the market, where price action may either reverse or stall temporarily.
Dynamic State Management: The indicator shifts between long and short states based on price action, providing real-time feedback. This helps traders stick to their trading plan without second-guessing the market.
A major advantage of WillStop Pro is that it responds well to changing market conditions. By identifying when key support or resistance levels break, it allows you to adjust your strategies and react to new opportunities accordingly. Whether the market is trending strongly or staying within a range, WillStop Pro provides valuable information to help guide your trades.
Setting Up Alerts
Alerts are an important feature in trading, especially when you can’t be in front of your charts all the time. WillStop Pro has been enhanced to include flexible alert settings to help you stay on top of your trades without constantly monitoring the charts.
Enable Alerts: There is a master switch to enable or disable all alerts. This way, you can control whether you want to be notified of events at any time.
Alert Frequency: Choose between receiving alerts Once Per Bar or Once Per Bar Close . This helps you manage the frequency of alerts and decide if you need real-time updates or want confirmation after a bar closes.
Break Alerts: These alerts notify you when a stop level has been broken. This can help you catch potential reversals or trading opportunities as soon as they happen.
Strong Break Alerts: Alerts are available for strong breaks, which occur when the price breaks stop levels with confirmation based on additional price, volume, and momentum criteria. These alerts help identify significant shifts in the market.
Level Change Alerts: These alerts tell you whenever a new stop level is calculated, keeping you updated about changes in market dynamics. You can set a Minimum Level Change % to ensure that alerts are only triggered when the stop level changes significantly.
Require Volume Confirmation: You can opt to receive alerts only if the volume is above a certain threshold. This confirmation helps reduce false signals by ensuring that significant price changes are backed by increased trading activity.
Volume Multiplier: The volume multiplier allows you to set a minimum volume requirement that must be met for an alert to trigger. This ensures that alerts are triggered only when there is sufficient trading interest.
Here is a part of the updated alert logic that has been implemented in the indicator:
// Alert on break conditions
if alertsEnabled
if alertOnBreaks
if longStopBroken and isVolumeConfirmed()
alert(createAlertMessage("Support Break - Short Signal", useAdvancedStops), alertFreq)
if shortStopBroken and isVolumeConfirmed()
alert(createAlertMessage("Resistance Break - Long Signal", useAdvancedStops), alertFreq)
// Strong break alerts
if alertOnStrongBreaks
if longStopBroken and isStrongBreak(false)
alert(createAlertMessage("Strong Support Break - Short Signal", useAdvancedStops), alertFreq)
if shortStopBroken and isStrongBreak(true)
alert(createAlertMessage("Strong Resistance Break - Long Signal", useAdvancedStops), alertFreq)
// Level change alerts
if alertOnLevelChanges and isSignificantChange() and isVolumeConfirmed()
alert(createAlertMessage("Significant Level Change", useAdvancedStops), alertFreq)
Setting alerts allows you to react to market changes without having to watch the charts constantly. Alerts are particularly helpful if you have other responsibilities and can’t be actively monitoring your trades all day.
Understanding the Table Display
The WillStop Pro indicator provides a status table that gives an overview of the current market state. Here’s what the table shows:
Indicator Status: The table indicates whether the indicator is in a LONG or SHORT state. This helps you quickly understand the market trend.
Stop Level: The active stop level is shown, whether it is acting as support (long) or resistance (short). This is important for knowing where to set your protective stops.
Mode: The table also displays whether the advanced calculation mode is being used. This keeps you informed about how stop levels are being calculated and why they are positioned where they are.
Empowering Messages: The table also includes motivational messages that rotate periodically, such as 'Trade with Clarity, Stop with Precision' and 'Let Winners Run, Cut Losses Short.' These messages are designed to keep you focused, motivated, and disciplined during your trading journey.
The table is simple and easy to follow, helping you maintain discipline in your trading plan. By having all the essential information in one place, the table reduces the need to make quick, emotional decisions and promotes more thoughtful analysis.
Tips for Using WillStop Pro Effectively
Here are some practical ways to make the most of the WillStop Pro indicator:
Start with Default Settings: If you’re new to the indicator, start with the default settings. This will give you an idea of how stop levels are determined and how they adjust to different markets.
Experiment with Advanced Settings: Once you are comfortable, try using the advanced stop settings to see how they refine the stop levels. This can be useful in certain market conditions to improve accuracy.
Use Alerts to Stay Updated: Set up alerts for when a stop level is broken or when new levels are calculated. This helps you take action without constantly watching the chart. Swing traders may find alerts especially helpful for monitoring longer-term moves.
Monitor the Status Table: Keep an eye on the status table to understand the current market condition. Whether the indicator is in a LONG or SHORT state can help you make more informed decisions.
Focus on Risk Management: WillStop Pro is designed to help you manage risk by dynamically adjusting stop levels. Make sure you are using these levels to protect your trades, especially during strong trends or volatile periods.
Acknowledging Larry Williams' Influence
WillStop Pro is inspired by the work of Larry Williams, who described the approach as one of his best trading techniques. His method aims to ride major market trends while reducing the risk of giving back gains during corrections. WillStop Pro builds upon this approach, adding features like advanced stop settings and visual alerts that make it easier to apply in modern markets.
By using WillStop Pro, you are essentially leveraging a well-established trading strategy with additional tools that help improve its effectiveness. The indicator is designed to provide a reliable way to manage trades, stay on top of market conditions, and reduce emotional decision-making.
Conclusion: Why WillStop Pro is Great for Beginners and Advanced Users
The WillStop Pro is a powerful yet easy-to-use tool that helps traders ride trends while managing risk during market corrections. It can be used both for entering and exiting trades, and its visual features make it accessible for those who are new to trading, while the underlying logic appeals to advanced users seeking greater control and understanding.
WillStop Pro is more than just a tool for setting stops. It is a comprehensive solution for managing trades, with features like dynamic stop levels, customizable alerts, and an easy-to-understand status table. This combination of simplicity and advanced features makes it suitable for beginners as well as more experienced traders.
We hope this guide helps you get started with WillStop Pro and improves your trading confidence. Remember to start with the basics, explore the advanced features, and set alerts to stay informed without getting overwhelmed. Whether you’re just beginning or want to simplify your strategy, WillStop Pro is a valuable tool to have in your trading arsenal.
Trading can be challenging, but the right tools make it more manageable. WillStop Pro helps you keep track of market movements, identify opportunities, and manage risk effectively. Give it a try and see how it can improve your trading decisions and help you navigate the markets more efficiently.
By incorporating WillStop Pro into your strategy, you are following a systematic approach that has been refined over time. It’s designed to help you make sense of the markets, plan your trades, and manage your risks with greater clarity and confidence.
Note: Always practice proper risk management and thoroughly test the indicator to ensure it aligns with your trading strategy. Past performance is not indicative of future results.
Trade smarter with TradeVizion—unlock your trading potential today!

CM Willams %R and CCI BackGround HighlightCM_Willams %R and CCI BackGround Highlight
Created By User Request
Indicator Highlights:
Creates Red BackGround Highlight if CCI Or Williams %R are Above Upper Line (User Defined)
Creates Green BackGround Highlight if CCI Or Williams %R are Below Lower Line (User Defined)
Ability to Turn On/Off either Williams %R or CCI Highlights in Inputs Tab via Check Boxes.
Ability To Set All Parameters for CCI and Williams %R in Inputs Tab.
Ability to Set High/Low “Threshold” Lines for Both CCI and Williams %R in Inputs Tab.
***I was asked if you could plot Back Ground Highlights on Two Individual Indicators AND have it show if BOTH Indicators were Overbought and Oversold.
***The answer is Yes. On the Chart Above I have the same Shade of Red and Green for Both Indicators. However, you will notice when Both Indicators Show OverBought…Both Plot Red Back Ground Highlights Which = a Brighter Red. The same is True for Oversold Conditions. The Green Shows a Brighter Shade of Green.
***VERY IMPORTANT - It is difficult for a programmer to release Indicators with this feature because depending on what color background you use on your charts…THE COLORS LOOK COMPLETELY DIFFERENT. So If You Don’t Use The Black Back Ground Shown Above You Most Likely Will Need To Adjust The Transparency, and Possibly The Colors Themselves!!!!
Reference Page

Tristan's Devil Mark (Short / Long, with W%R)The Devil’s Mark indicator is a visual tool designed to help traders identify potential short and long opportunities based on candle structure and market momentum. It combines price action analysis with the Williams %R (W%R) oscillator to highlight candles with high potential for reversal or continuation.
Can be used on any timeline, from scalping day trades to swing trades on daily and higher timelines. Know that the higher the timeline the less likely the indicator will show. (Asia and London sessions tend to show many indicators. I find this more useful for NY session.)
How the script works
Candle Structure Conditions
Short (Sell) Wedge: Plotted above green candles that have no bottom wick, indicating that inside that candle there was strong upward momentum without downside hesitation .
Long (Buy) Wedge: Plotted below red candles that have no top wick, indicating that inside that candle there was strong downward momentum without upside hesitation .
These candles are visually emphasized as wedges to mark potential turning points.
Williams %R Filter
The indicator uses Williams %R to measure overbought and oversold conditions:
Proximity to 0 (nearZeroThresh): Determines how close W%R must be to 0 (overbought) to trigger a Sell Wedge. This acts as a “Sell sensitivity” filter.
Proximity to -100 (nearHundredThresh): Determines how close W%R must be to -100 (oversold) to trigger a Buy Wedge. This acts as a “Buy sensitivity” filter.
When the candle meets both the candle structure and the W%R condition, the wedge is plotted in purple (“Within W%R Range”).
When the "ignore W%R filter" toggle is on, all eligible candles are plotted regardless of W%R. Wedges that normally would not meet W%R criteria are plotted in light purple (“Outside W%R Range”) to distinguish them. #YOLO (🚫 I recommend leaving "Ignore W%R Filter" OFF)
Settings Explained
Williams %R Length: The number of bars used to calculate the W%R oscillator. Shorter lengths make it more sensitive; longer lengths smooth the readings.
Proximity to 0 / 100: Controls how “strict” the indicator is in requiring overbought or oversold W%R conditions to trigger. Lower values mean closer to extreme zones, higher values are more permissive.
Ignore W%R Toggle: Option to show Devil’s Marks on every eligible candle regardless of W%R. Useful for visualizing purely price-action-based signals.
What the trader sees
Purple wedges: Candles meeting both candle structure and W%R conditions.
Light purple wedges: Candles meeting candle structure but ignored W%R (when toggle is on). #YOLO (🚫 I recommend leaving "Ignore W%R Filter" OFF)
Short opportunities are wedges above bars (green candles with no bottom wick).
Long opportunities are wedges below bars (red candles with no top wick).
Trading Insight
The Devil’s Mark is a momentum and reversal alert tool:
Look for purple downward-pointing wedges when W%R is near overbought. This is a potential shorting opportunity. Buying at the close of that candle may improve your short trades.
Look for purple upward-pointing wedges when W%R is near oversold. This is a potential
long opportunity. Buying at the close of that candle may improve your long trades.
Light purple wedges show the same price-action cues without W%R confirmation—useful for aggressive traders who want every potential setup. #YOLO #YMMV #noFullPort
Settings / Security
The “Output values” checkbox appears for each plotted series (like a plot or plotshape) and controls whether the series will also be exposed numerically in the Data Window or used by other indicators/scripts.
Here’s what it means in practice:
1. Checked (true)
The series values (like candle high, low, or any computed value) are exported to the Data Window and can be read by other scripts using request.security() or ta functions.
Example: You can see the exact numerical value of each plotted point in the Data Window when you hover over the chart.
Useful if you want to backtest or reference these plotted values programmatically.
2. Unchecked (false)
The series is plotted visually only.
The numeric values are hidden from the Data Window and cannot be accessed by other scripts.
Makes the chart cleaner if you don’t need the numeric outputs.

Larry Williams: Market StructureLarry Williams' Three-Bar System of Highs and Lows: A Definition of Market Structure
Larry Williams developed a method of market structure analysis based on identifying local extrema using a sequence of three consecutive bars. This approach helps traders pinpoint significant turning points on the price chart.
Definition of Local Extrema:
Local High:
Consists of three bars where the middle bar has the highest high, while the lows of the bars on either side are lower than the low of the middle bar.
Local Low:
Consists of three bars where the middle bar has the lowest low, while the highs of the bars on either side are higher than the high of the middle bar.
This structure helps identify meaningful reversal points on the price chart.
Constructing the Zigzag Line:
Once the local highs and lows are determined, they are connected with lines to create a zigzag pattern.
This zigzag reflects the major price swings, filtering out minor fluctuations and market noise.
Medium-Term Market Structure:
By analyzing the sequence of local extrema, it is possible to determine the medium-term market trend:
Upward Structure: A sequence of higher highs and higher lows.
Downward Structure: A sequence of lower highs and lower lows.
Sideways Structure (Flat): Lack of a clear trend, where highs and lows remain approximately at the same level.
This method allows traders and analysts to better understand the current market phase and make informed trading decisions.
Built-in Indicator Feature:
The indicator includes a built-in functionality to display Intermediate Term Highs and Lows , which are defined by filtering short-term highs and lows as described in Larry Williams' methodology. This feature is enabled by default, ensuring traders can immediately visualize key levels for support, resistance, and trend assessment.
Quote from Larry Williams' Work on Intermediate Term Highs and Lows:
"Now, the most interesting part! Look, if we can identify a short-term high by defining it as a day with lower highs (excluding inside days) on both sides, we can take a giant leap forward and define an intermediate term high as any short-term high with lower short-term highs on both sides. But that’s not all, because we can take it even further and say that any intermediate term high with lower intermediate term highs on both sides—you see where I’m going—forms a long-term high.
For many years, I made a very good living simply by identifying these points as buy and sell signals. These points are the only valid support and resistance levels I’ve ever found. They are crucial, and the breach of these price levels provides important information about trend development and changes. Therefore, I use them for placing stop loss protection and entry methods into the market."
— Larry Williams
This insightful quote highlights the practical importance of identifying market highs and lows at different timeframes and underscores their role in effective trading strategies.

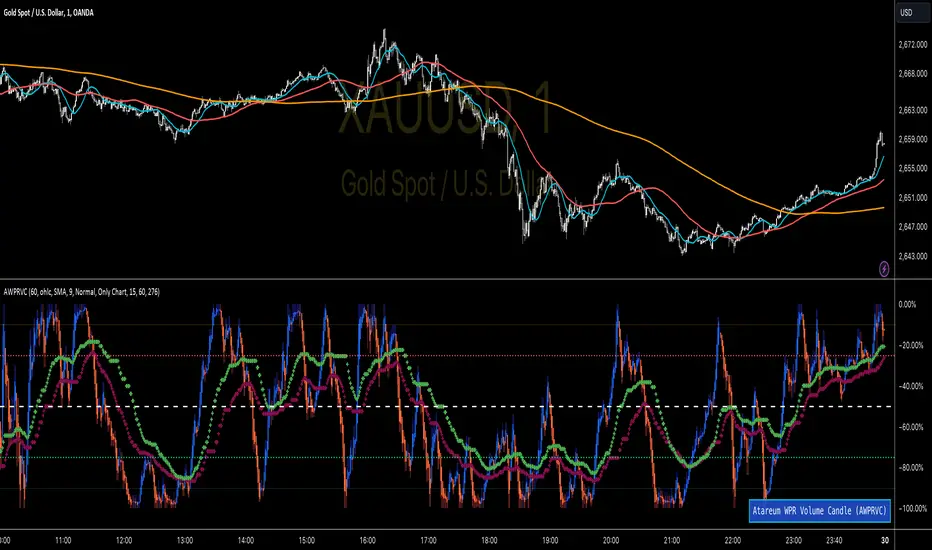
WPR Volume Candle [Atareum]AWPRVC (Atareum WPR Volume Candles) is clearly an awesome indicator produced by AtareumFX that is based on William’s Percent Range concepts by combination with volume. This is a new approach of volume candles that is combined with R% concepts and creates such a powerful tool to trace the market and assists traders to make better decisions surly and so much accurate. You can find this new indicator more useful because it has all benefits and advantages of William’s R% and cover its disadvantages. Also it is more powerful because of using volume in its calculations and generate a new candles which is more reliable and trustworthy.
Concept:
Using William’s Percent leading periods and calculations on redesigning new candles in combination with volume, that makes unique reform candles, but these new candles with their new cloud system clearly response to any reasonable price movement with so much information.
As you know if use R% there are some misleading fake signals generate by oscillator, also it could not show any sign of price moving trend which is almost confusing for beginners or even a pro trader! And finally this oscillator is so sensitive to price change that is so creepy to use for most of traders.
This new AWPRVC solve the problem and make all of them handy and useful for you.
The cloud system which is designed in AWPRVC shows the price trend moving from Bearish Zone (-100 to -50 percent) to Bullish Zone (-50 to 0 percent). You can trust the lead moving forward of the clouds in two separate Top and Bottom (Bull and Bear) lines which solely determine the trend and power of price moving. When clouds are close to each other means we continue the trend and when they get far away from each other means we will face powerful trend in near future. If they are in Bearish Zone we continue the selling pressure and vice versa. Following picture shows good sample of Long and Short positions in compare with so many fake signals generated on original R%.
Besides the cloud system of AWPRVC which is clearly show the price trend and it is completely enough for being sure about price moving trend, you can use moving average which is designated in it to confirm the price trend, also.
Also you can see this new AWPRVC candle by using volume within its conformation, make reasonable price candles which is no so sensitive and so creepy and make your decisions come true in peace and clear sense of market moves. You can see following picture which is showing although the real price candles are so unclear and nonsense of making decision but the AWPRVC candles lead you to make true and trustable position.
As you see this new combination of Williams R% oscillator with volume and also generating a perfect new cloud system will clearly help traders even pro to trust the signals and understand whole market movement better and all of original problems of R% solved and even make a most powerful, trustworthy and useful new indicator.
Parameters:
Section 1 : Candle colour setting for flourishing just as you desire !
Section 2 : Defining Periods of R% and source of candle data in combination with determining the smoothing type of moving averages and signal period.
Section 3 : Select using Standard candles alongside with redesigned cloud calculation type and three additional moving averages which can plot on each newly generated candles and standard candles on a chart with the type mode defined in the previous section.
Note: if you want to omit any or all of these moving averages, you can use 0 in period, instead of selecting "None" in the plot moving option!
Usage :
Overall:
Regardless of the additional moving averages which will lead to so many situations of market according to their types and designs, that is four different period for new redesign AWPRVC and three period for standard chart. You can easily select periods and type for these moving averages. Also, do not forget that signal moving averages is shown only on AWPRVC chart and have two different colour for upward and downward trends. Other moving averages are plot by just one single colour.
Cloud levels are so important because AWPRVC candles show respect to them and when they break the clouds upward or downward it is surly beginning of a trend. Do not forget we have 5 levels for tracing new AWPRVC candles move as follows : Ready for Short \ Long, Surly Short \ Long and Turn Trend which is in middle range of movement percent. Each level clearly shows what it means by its name.
Support and Resistance:
Any consolidation of AWPRVC candles in Ready for Short or Long Zones means the support or resistance level due to its nature, but important thing is how long the candles lasts in there or how many times repeated in the same level in AWPRVC chart zone in future.
For plotting the support or resistance you should trace range of AWPRVC candles consolidated and plot zone in standard chart candles just like following picture.
Divergence:
When standard price candles move downward but we see upward trend in clouds of AWPRVC candles that means we should face Bullish Trend because of the divergence and vice versa. You can see perfect example in following picture.
Signal:
Alert of Long :
Bullish candle cross both cloud down and up level simultaneously.
Confirmed Long :
AWPRVC candles cross up turn trend level and pullback to cloud up level.
Take profit of Long:
Any cross down of the AWPRVC candles from surly short level of chart.
Alert of Short :
Bearish candle cross both cloud up and down level simultaneously.
Confirmed Short :
AWPRVC candles cross down turn trend level and pullback to cloud down level.
Take profit of Short:
Any cross up of the AWPRVC candles from surly long level of chart.
Notes:
Use moving averages cross of standard chart candles as lead to be in positions more as they are good representative of trend.
As long as AWPRVC candles or Cloud levels are in Bullish Zone, you can stay in Long positions.
Cloud level thickness means the power of trend and can be use as confirmation of powerful trend, so when cloud levels tight or going to cross each other it means the trend is going to be reversed.
It is the result of many years of experience in markets and there are so many details about this AWPRVC chart which I am in the experiment phase to publish in the future, so please help me with your ideas and do not hesitate to comment and inform me any suggestions or criticism.
Setup 9.1 by Larry Williams Setup 9.1 by Larry Williams.
The indicator will give text signal and change the color of the signal candle, being based exclusively on the setup 9.1
----------//---------------
PT-BR
Setup 9.1 do Larry Williams.
O indicador irá dar sinal de texto e alterar a cor do candle de sinal, se baseando exclusivamente no setup 9.1

Larry Williams's Market Structure
Here is a Pine script based on Larry Williams' market structure model.
Note: When processing real-time ticks, heavy calculations can cause script errors. To prevent this, please adjust the script's data range accordingly.
As I'm not an expert in Pine Script, there may be some imperfections. Your understanding is appreciated.
I have great admiration for the wisdom of Larry Williams.
May the trend be with you.

Visible bars count on chart + highest/lowest bars, max/min AOThe indicator displays the number of visible bars on the screen (in the upper right corner), including the prices of the highest and lowest bars, the maximum or minimum value of the Awesome Oscillator (similar to MACD 5-34-5) for identify the 3-wave Elliott peak in the interval of 100 to 140 bars according to the Profitunity strategy of Bill Williams. The values change dynamically when scrolling or changing the scale of the graph.
In the indicator settings, you can hide labels, lines and change any parameters for the AO indicator - method (SMA, Smoothed SMA, EMA and others), length, source (open, high, low, close, hl2 and others).
‼️ The values are updated within 2-3 seconds after changing the number of visible bars on the screen.
***
Индикатор отображает количество видимых баров на экране (в правом верхнем углу), в том числе цены самого высокого и самого низкого баров, максимальное или минимальное значение Awesome Oscillator (аналогично MACD 5-34-5), чтобы определить пик 3-волны Эллиота в интервале от 100 до 140 баров по стратегии Profitunity Билла Вильямса. Значения меняются динамически при скроллинге или изменении масштаба графика.
В настройках индикатора вы можете скрыть метки, линии и изменить любые параметры для индикатора AO – метод (SMA, Smoothed SMA, EMA и другие), длину, источник (open, high, low, close, hl2 и другие).
‼️ Значения обновляются в течении 2-3 секунд после изменения количества видимых баров на экране.

Jake Bernstein - Williams A/D MA57This indicator uses the Larry Williams accumulation distribution with a 57 period sma of Williams. It is used in conjunction with the Jake Bernstein MAC (moving average channel)
EneX SignalEneX is signal that give recommendation signals for entry and exit on spot market. This indicators not suitable for leverage trading in futures market.
EneX signal consider several indicators and has entry and exit rules.
EneX signal is suitable for investors who believe in trend following strategy (disclaimer on).
This script composed by Yohan Naftali for educational purpose only. Reader who will use this signal must do own research.
Indicator and Plot Involved
1. Williams Fractals with default periods = 2
2. William Alligator Indicators with default simple moving average 8, 13, and 21
3. Exponential Moving Averages with default value EMA 50, 100, and 200
4. Relative Strength Index with default overbought level = 80 and oversold level = 20
5. Williams Fractals are joined to create support and resistance line and fill area between support and resistance lines.
Entry signal conditions
1. Entry on Weakness when bullish fractal appear on n/2 period
2. Entry when price break resistance line
All entry condition must above EMA and alligator signal and not in overbought RSI
Exit signal conditions
1. Lowest price is below Exponential Moving Average
2. Lowest price is below William alligator lines
You can easily find entry and exit points by using Entry (E), Exit(X) signals
How to use
1. Monitor chart and wait until E or X signals
2. Entry if Entry Signal (E) appear (green colored label)
3. Exit if Exit Signal (X) appear (red colored label)
4. Change indicators setting when necessary
Best Practice
1. Entry only when entry signal (E) appear
2. Never entry when price below William alligator signal
3. Exit when exit signal (X) appear
4. Not exit when exit signal appear when you believe or you have information that price will be rebound
5. Exit if you believe that current price meet your target price
6. Always wise when use EneX signals
Disclaimer
Do your own research and consider fundamental price of asset.
The indicators provided on this script is for educational purposes only.
Author does not offer advisory or brokerage services, nor does it recommend or advise users to buy or sell particular stocks or securities.
Please examined script and give feedback for further improvement.

MS POIVThis indicator was introduced by Larry Williams in 2007 and is very similar to the well known OBV indicator.
As such, it should be examined for convergence and divergence with the price trend. The interpretation can be done using the Wyckoff principles.
* Price rises, POIV stays behind => no subsequent demand
* Price meets resistance, POIV reaches new highs => supply (distribution) in the background
* Price and POIV rise synchronously => price trend is intact
These statements can of course be applied correspondingly to falling prices.
Larry Williams wrote for explanation:
Despite the problem, volume indictors have proven their worth, but while it is
a good idea to watch the cumulative flow of buying and selling pressure, you
should not assign all of this buying and selling to bulls and bears. Combined
with other concepts, such as keying off the open, we can focus on something
more germane to trading based just on volume, or what some might consider
related volatility indicators, such as daily ranges.
Futures traders can consider at least one solution to this problem: open
interest. Open interest is the number of outstanding contracts in a particular
market. (...))
The formula is calculating the cumulative sum of open interest times the net
change in price, divided by the true range. We then add the OBV value to this
cumulative sum.
So we first take the net change in price (today’s close minus yesterday’s close)
to get a percentage of where within the range the close was. Not all of the
activity will be buying or selling; the market “tells” us what percentage of
open interest goes to the buy or sell side.
Not only that, it also means we are incorporating price and trend change into
the formula.
(...)
One note of warning is necessary. The Williams POIV AD is a specific formula
that compensates for the close within the range relationship, as well telling
us how much OI to use, but it is an indicator, not a trading system. In
practice, it is useful to confirm a trade or to focus attention on a potential
trade. It is not intended to stand as the sole reason to initiate a position
in the market.

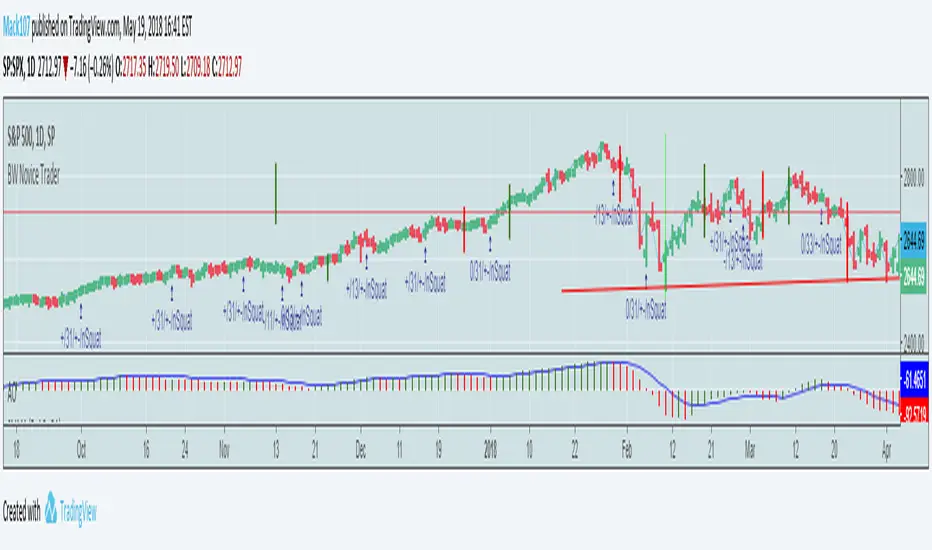
Bill Williams Trading Chaos Vol 1-NoviceThis is a revision of a script developed by tekolo. I hope tekolo takes a look. The concepts are here but I struggle with pine. I am very much a novice, but I tried to put information from the original book, Trading Chaos, Volume One by Bill Williams. There are too many plots to get this to wor. I made a lot of plot lines into comments to get it to run. I'm hoping someone with an interest in this material and some programming skills will be kind enough to take these thoughts and put them in a script that the Pine Editor would actually run. Thanks for taking a look. I do believe in these leading indicators. This is information included for Novice Level Trading in the Bill Williams book. There are more indicators developed in his material, but the jest is that Price is an end result of the marketplace. Market participation (Volume), Market Bias (Momentum), Increased Participation and Bias (Acceleration) all preceed the formation of the Trend. This along with Elliott Wave interpretation using his indicators as a basis for locating key points of the Elliott Wave, are most of what I understand about this interesting man's work. Again, I am a novice at all of this, but the leading indicators that result in price seem interesting. Thanks!
Bill Williams. Awesome Oscillator (AC) Signal Line This indicator plots the oscillator as a histogram where blue denotes
periods suited for buying and red . for selling. If the current value
of AO (Awesome Oscillator) is above previous, the period is considered
suited for buying and the period is marked blue. If the AO value is not
above previous, the period is considered suited for selling and the
indicator marks it as red.
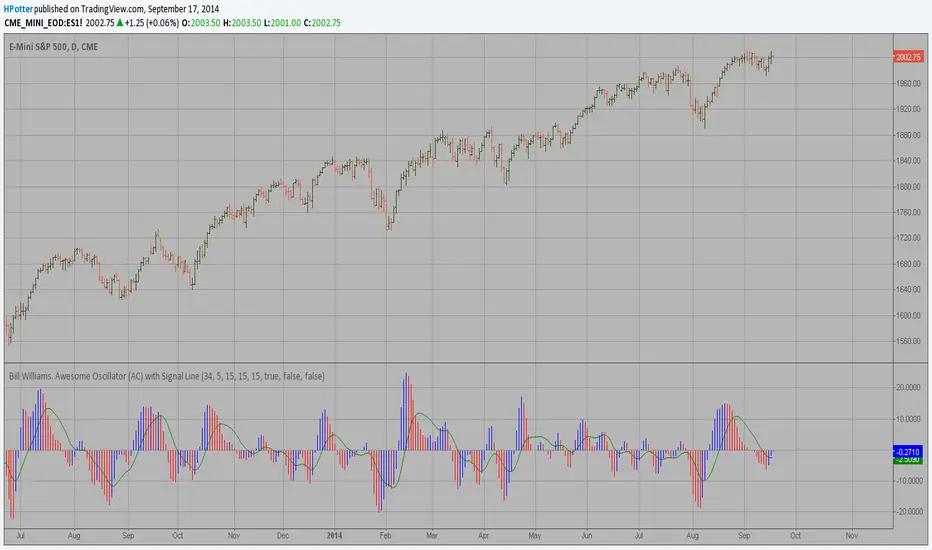
Bill Williams. Awesome Oscillator (AO) Signal Line This indicator is based on Bill Williams` recommendations from his book
"New Trading Dimensions". We recommend this book to you as most useful reading.
The wisdom, technical expertise, and skillful teaching style of Williams make
it a truly revolutionary-level source. A must-have new book for stock and
commodity traders.
The 1st 2 chapters are somewhat of ramble where the author describes the
"metaphysics" of trading. Still some good ideas are offered. The book references
chaos theory, and leaves it up to the reader to believe whether "supercomputers"
were used in formulating the various trading methods (the author wants to come across
as an applied mathemetician, but he sure looks like a stock trader). There isn't any
obvious connection with Chaos Theory - despite of the weak link between the title and
content, the trading methodologies do work. Most readers think the author's systems to
be a perfect filter and trigger for a short term trading system. He states a goal of
10%/month, but when these filters & axioms are correctly combined with a good momentum
system, much more is a probable result.
There's better written & more informative books out there for less money, but this author
does have the "Holy Grail" of stock trading. A set of filters, axioms, and methods which are
the "missing link" for any trading system which is based upon conventional indicators.
This indicator plots the oscillator as a histogram where periods fit for buying are marked
as blue, and periods fit for selling as red. If the current value of AC (Awesome Oscillator)
is over the previous, the period is deemed fit for buying and the indicator is marked blue.
If the AC values is not over the previous, the period is deemed fir for selling and the indicator
is marked red.

Bill Williams. Awesome Oscillator (AC) Strategy This indicator plots the oscillator as a histogram where blue denotes
periods suited for buying and red . for selling. If the current value
of AO (Awesome Oscillator) is above previous, the period is considered
suited for buying and the period is marked blue. If the AO value is not
above previous, the period is considered suited for selling and the
indicator marks it as red.

Swing High/Low by %REnglish Description
Swing High/Low by %R
This indicator identifies potential swing high and swing low points by combining William %R overbought/oversold turning points with classic swing price structures.
Swing High: Detected when William %R turns down from overbought territory and the price forms a local high (higher than both neighboring bars).
Swing Low: Detected when William %R turns up from oversold territory and the price forms a local low (lower than both neighboring bars).
This tool is designed to help traders spot possible market reversals and better time their entries and exits.
Customizable parameters:
Williams %R period
Overbought & Oversold thresholds
The indicator plots clear signals above/below price bars for easy visualization.
For educational purposes. Please use with proper risk management!
คำอธิบายภาษาไทย
Swing High/Low by %R
อินดิเคเตอร์นี้ใช้ระบุจุด Swing High และ Swing Low ที่มีโอกาสเป็นจุดกลับตัวของตลาด โดยอาศัยสัญญาณจาก William %R ที่พลิกกลับตัวบริเวณ overbought/oversold ร่วมกับโครงสร้างราคาแบบ swing
Swing High: เกิดเมื่อ William %R พลิกกลับลงจากเขต Overbought และราคาแท่งกลางสูงกว่าทั้งสองแท่งข้างเคียง
Swing Low: เกิดเมื่อ William %R พลิกกลับขึ้นจากเขต Oversold และราคาแท่งกลางต่ำกว่าทั้งสองแท่งข้างเคียง
ช่วยให้เทรดเดอร์สามารถมองเห็นโอกาสในการกลับตัวของราคา และใช้ประกอบการวางแผนจังหวะเข้าหรือออกจากตลาดได้อย่างแม่นยำมากขึ้น
ตั้งค่าได้:
ระยะเวลา Williams %R
ค่าขอบเขต Overbought & Oversold
อินดิเคเตอร์จะแสดงสัญลักษณ์อย่างชัดเจนบนกราฟเพื่อความสะดวกในการใช้งาน
ควรใช้ร่วมกับการบริหารความเสี่ยง
