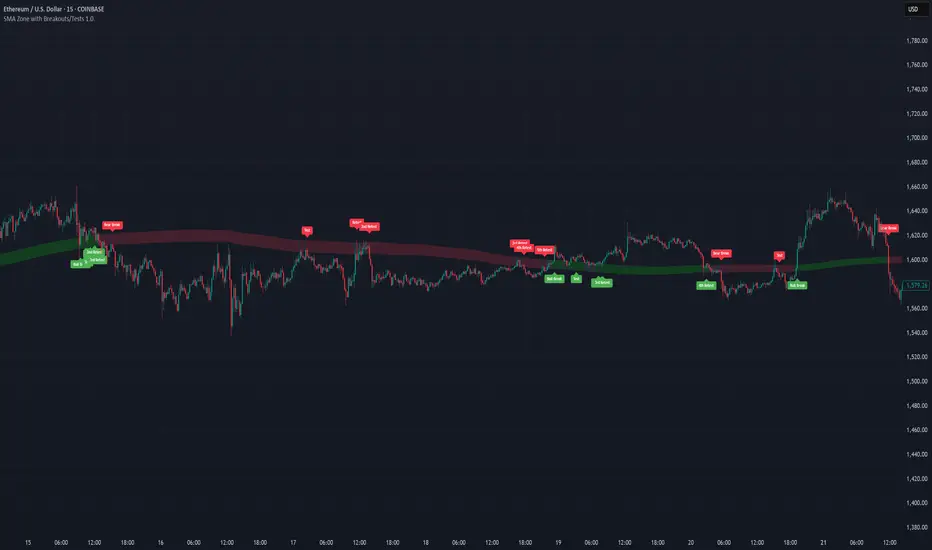
SMA Zone with Breakouts/Tests 1.0.This indicator plots a dynamic “SMA Zone” between two simple moving averages (one applied to lows, one to highs) and highlights key interaction points with the zone:
Breakouts
Bull Break: price closes above the upper SMA
Bear Break: price closes below the lower SMA
Requires confirmation via either above-average volume or an unusually wide bar (spread > ATR) closing near its extreme
Tests & Retests
After a breakout, the first re-entry into the zone edge is labeled “Test,” subsequent re-entries are numbered “Retest,” “2nd Retest,” etc.
Zone Weakening: each additional Test/Retest signifies diminished zone strength—fewer reliable boundaries remain (Traditional S/R theory)
Alerts
Fires a unified “Zone Signal” alert on every Break, Test, and Retest (set condition to “Any alert() function call”).
Disclaimer:
This is not financial advice and should not be used as a standalone trading signal.
It’s designed to draw your attention to important price-zone interactions so you can manually tune in.
The logic can be further enhanced or combined with other indicators/algorithms as part of a more complex trading system.
Поиск скриптов по запросу "zone"
SuperSmoothed Volume Zone Oscillator------------------------------------------------------------------------------------
SUPERSMOOTHED VOLUME ZONE OSCILLATOR (SSVZO)
TECHNICAL INDICATOR DOCUMENTATION
------------------------------------------------------------------------------------
Table of Contents:
1. Original VZO Background
2. SuperSmoother Technology
3. SSVZO Components
3.1. Main SSVZO Oscillator
3.2. Momentum Velocity Component
3.3. Adaptive Levels
3.4. Static Levels
3.5. Trend Shift Detection
3.6. Glow Effect Visualization
4. References & Further Reading
------------------------------------------------------------------------------------
1. ORIGINAL VOLUME ZONE OSCILLATOR (VZO) BACKGROUND
------------------------------------------------------------------------------------
Creator: Walid Khalil (November 2009, Technical Analysis of Stocks & Commodities)
History: Khalil designed the VZO to address limitations in other volume indicators
by focusing on the relative balance between buying and selling volume while filtering
out market noise. The indicator identifies accumulation and distribution patterns.
Traditional Usage: The classic VZO uses a 14-period calculation setting and is
interpreted on a scale from -60% to +60%:
- Readings above +40% indicate strong buying pressure (potential overbought)
- Readings below -40% indicate strong selling pressure (potential oversold)
- The zero line acts as a key reference for trend changes
- Divergences between VZO and price offer valuable trading signals
Difference from Other Volume Indicators: Unlike simple volume indicators that only
track total volume, the VZO tracks the relative difference between up-volume and
down-volume, more effectively identifying buying/selling pressure imbalances and
potential reversal points.
------------------------------------------------------------------------------------
2. SUPERSMOOTHER FILTER TECHNOLOGY
------------------------------------------------------------------------------------
Creator: John F. Ehlers, an engineer specializing in digital signal processing for
trading systems.
Origins: Introduced in "Rocket Science for Traders" (2001) and refined in "Cybernetic
Analysis for Stocks and Futures" (2004). Represents the application of digital signal
processing techniques to financial markets.
Technical Foundation: The SuperSmoother is a two-pole low-pass filter specifically
designed to eliminate noise while preserving the underlying signal. It combines
principles of Butterworth and Gaussian filters to minimize both phase shift and
passband ripple.
Mathematical Implementation:
a1 = exp(-π * sqrt(2) / period)
b1 = 2 * a1 * cos(sqrt(2) * π / period)
c2 = b1
c3 = -a1²
c1 = 1 - c2 - c3
Advantages Over Traditional Filters:
- Reduces lag compared to simple moving averages
- Eliminates high-frequency market noise more effectively
- Minimizes unwanted ripples in the output signal
- Preserves important turning points in the data
- Superior handling of sudden market movements
According to Ehlers: "Conventional moving averages are plagued by excessive lag and/or
rippling in their passband. The SuperSmoother eliminates virtually all of this ripple
and has excellent transient response characteristics." (TASC Magazine, 2014)
------------------------------------------------------------------------------------
3. SSVZO COMPONENTS
------------------------------------------------------------------------------------
3.1. MAIN SSVZO OSCILLATOR
------------------------------------------------------------------------------------
Description: The core component measuring buying vs. selling volume pressure using
the SuperSmoother filter for enhanced noise reduction.
Calculation: SSVZO analyzes the relationship between up-volume (volume on rising
prices) and down-volume (volume on falling prices), applying exponential moving
averages to both components, then calculating their relative strength. The
SuperSmoother filter reduces market noise while preserving the underlying trend signal.
Implementation Advantage: By applying the SuperSmoother filter to the VZO calculation,
the SSVZO provides significantly cleaner signals with fewer false crossovers and more
accurate identification of true trend changes.
Interpretation:
- Values above zero indicate bullish volume dominance
- Values below zero indicate bearish volume dominance
- Readings above +60 suggest overbought conditions
- Readings below -60 suggest oversold conditions
- Crossovers of the zero line signal potential trend changes
Trading Application: Use SSVZO as a primary volume-based momentum indicator to
confirm price trends, identify divergences, and spot potential reversal zones.
------------------------------------------------------------------------------------
3.2. MOMENTUM VELOCITY COMPONENT
------------------------------------------------------------------------------------
Description: A histogram displaying the rate of change of momentum, showing how
quickly buying or selling pressure is accelerating or decelerating.
Calculation: Derived from price momentum over a user-defined period, with optional
adaptive filtering that adjusts sensitivity based on market volatility. The velocity
component shows the first derivative of momentum – essentially the "acceleration" of
market movement.
Technical Origin: Inspired by Ehlers' work on Hilbert Transforms and research on
cyclic components in financial markets, as detailed in "Cycle Analytics for Traders"
(2013).
Interpretation:
- Positive readings (teal bars) indicate accelerating upward momentum
- Negative readings (orange bars) suggest accelerating downward momentum
- Larger bars indicate stronger momentum acceleration
- Shrinking bars signal momentum deceleration
Trading Application: Use as an early warning system for potential trend exhaustion
or confirmation of a new trending move. When momentum velocity diverges from price,
it often precedes a reversal.
------------------------------------------------------------------------------------
3.3. ADAPTIVE LEVELS
------------------------------------------------------------------------------------
Description: Dynamic overbought and oversold boundaries that adjust to market
conditions, providing context-aware trading signals.
Calculation: Uses statistical methods based on the standard deviation of the SSVZO
values over a longer period. These levels automatically widen during higher volatility
periods and narrow during consolidation.
Research Base: Draws from Perry Kaufman's work on Adaptive Moving Averages (AMA) and
Bollinger's research on dynamic volatility bands, as published in "Trading Systems
and Methods" (2013).
Interpretation:
- Adaptive Overbought (dotted circles above): Dynamic ceiling that expands/contracts
based on market volatility
- Adaptive Oversold (dotted circles below): Dynamic floor that expands/contracts based
on market volatility
Trading Application: More reliable for identifying extremes than static levels,
particularly in changing market conditions or different instruments. Touching these
levels often provides higher-probability reversal signals.
------------------------------------------------------------------------------------
3.4. STATIC LEVELS
------------------------------------------------------------------------------------
Description: Fixed overbought and oversold horizontal lines that provide consistent
reference points for excess market conditions.
Calculation: Preset at +60 (overbought) and -60 (oversold) based on historical
analysis of volume behavior across multiple markets, extending the classic VZO range.
Interpretation:
- Readings above +60 suggest potential buying exhaustion
- Readings below -60 indicate potential selling exhaustion
- Duration spent beyond these levels correlates with reversal probability
Trading Application: Use as baseline reference points for extreme conditions. Most
effective when combined with other confirmation signals like divergences or
candlestick patterns.
------------------------------------------------------------------------------------
3.5. TREND SHIFT DETECTION
------------------------------------------------------------------------------------
Description: Visual markers and optional background shading highlighting potential
trend changes when the SSVZO crosses the zero line.
Calculation: Based on mathematical crossovers of the SSVZO value above or below the
zero line, with pattern recognition to reduce false signals.
Research Foundation: Incorporates concepts from Dr. Alexander Elder's "triple screen
trading system" and Mark Chaikin's volume-based trend identification research.
Interpretation:
- Upward triangles indicate bullish trend shifts (SSVZO crossing above zero)
- Downward triangles indicate bearish trend shifts (SSVZO crossing below zero)
- Background shading emphasizes the new trend direction
Trading Application: These signals often precede price trend changes and can serve
as entry triggers when aligned with the higher timeframe trend.
------------------------------------------------------------------------------------
3.6. GLOW EFFECT VISUALIZATION
------------------------------------------------------------------------------------
Description: An aesthetic enhancement creating a gradient "glow" around the main SSVZO
line, improving visual clarity and emphasizing signal strength.
Calculation: Generated using percentage-based bands around the main SSVZO value, with
multiple translucent layers to create a subtle illumination effect.
Design Inspiration: Inspired by modern UI/UX design principles for financial
dashboards and the MATS (Moving Average Trend Sniper) indicator's visual presentation,
enhancing perception of signal strength through visual intensity.
Interpretation:
- Teal glow indicates positive SSVZO values (bullish)
- Orange glow indicates negative SSVZO values (bearish)
- Glow intensity correlates with the strength of the signal
Trading Application: Beyond aesthetics, the glow creates visual emphasis that makes
trend direction, strength, and changes more immediately apparent, particularly useful
during fast-moving market conditions.
------------------------------------------------------------------------------------
4. REFERENCES & FURTHER READING
------------------------------------------------------------------------------------
1. Ehlers, J. F. (2001). "Rocket Science for Traders: Digital Signal Processing
Applications." John Wiley & Sons.
2. Ehlers, J. F. (2004). "Cybernetic Analysis for Stocks and Futures: Cutting-Edge
DSP Technology to Improve Your Trading." John Wiley & Sons.
3. Ehlers, J. F. (2013). "Cycle Analytics for Traders: Advanced Technical Trading
Concepts." John Wiley & Sons.
4. Khalil, W. (2009). "The Volume Zone Oscillator." Technical Analysis of Stocks &
Commodities, November 2009.
5. Kaufman, P. J. (2013). "Trading Systems and Methods." 5th Edition, Wiley Trading.
6. Elder, A. (2002). "Come Into My Trading Room: A Complete Guide to Trading."
John Wiley & Sons.
7. Bollinger, J. (2002). "Bollinger on Bollinger Bands." McGraw-Hill Education.
------------------------------------------------------------------------------------
END OF DOCUMENTATION
------------------------------------------------------------------------------------

matrixx Global Sessions + Good/Premium Spread ZonesSimple (enough) Script that allows you to visualize the major trading sessions, with some QoL stuff, Includes a "Monday Open" bar for reference when zooming out.
By default no one 'session' is turned on; instead, we have;
Good Zone - where spread tends to close up enough for (me) to trade in the 1-minute timezones
Premium Zone - where the tightest spreads tend to happen and I (you?) can get more aggressive with Stop Losses, and moment-to-moment trade accuracy.
The Monday Open - for reference.
You are able to go into the settings and turn these on and off at will, making any combination of 'zones' you prefer, and can colour code them, as well.
Points of Difference;
You can turn on and off any group or set of sessions for an overview;
Additionally, this is coded so that if there is a "Daylight Saving" or other localized timezone shift, it should be reflected correcty, as timezones are calculated based on each sessions' data, not arbitrarily with +/- as most of the other scripts that do similar to this one.
Monday Open
you can toggle sessions, or instead toggle the 'off hour' zones, at will

Trendchange Zones Indicator | iSolani
Spotting Reversals Before They Happen: The iSolani Trendshift System
Where RSI Meets Smart Volume Analysis - Your Visual Guide to Market Turns
Core Methodology
RSI-Powered Zones
Identifies critical levels using:
14-period RSI (default) with 70/30 thresholds
Semi-transparent boxes marking overbought (red) and oversold (green) territories
Zone persistence until RSI returns to neutral range
Dynamic Level Tracking
Plots evolving support/resistance using:
Pivot highs/lows with 15-bar lookback (default)
Auto-extending lines that adapt to new price extremes
Volume-Confirmed Breakouts
Flags significant moves with:
5/10 EMA volume oscillator
20% volume threshold (default) for confirmation
Technical Innovation
Three-Layer Confirmation
Unique combination of:
Classic RSI extremes
Price structure through pivot points
Volume-fueled momentum shifts
Adaptive Visualization
Zones maintain historical context at 33% transparency
Dynamic lines extend indefinitely until invalidated
Discreet labels for breakout events
System Workflow
Calculates RSI values in real-time
Draws colored zones when RSI crosses 70/30
Marks pivot points every 15 bars (default)
Updates support/resistance lines on new pivots
Triggers alerts when price breaks levels with volume confirmation
Standard Configuration
RSI Settings : 14-period length
Pivot Detection : 15-bar left/right lookback
Visuals : 33% transparency zones with thin borders
Volume Threshold : 20% oscillator difference
Alerts : Breakout signals with "B" labels
This system transforms the classic RSI into a spatial analysis tool - not just showing when markets are overextended, but where they're likely to reverse. The dynamic lines act as moving barriers that adapt to market structure, while the volume filter ensures only high-conviction breaks get flagged. By layering momentum, price action, and volume dynamics, it creates a multi-spectrum view of potential trend changes.

TrendGuard Scalper: SSL + Hama Candle with Consolidation ZonesThis TradingView script brings a powerful scalping strategy that combines the SSL Channel and Hama Candles indicators with a special twist—consolidation detection. Designed for traders looking for consistency in various markets like crypto, forex, and stocks, this strategy highlights clear trend signals, risk management, and helps filter out risky trades during consolidation periods.
Why Use This Strategy?
Clear Trend Detection:
With the SSL Channel, you’ll know exactly when the market is in an uptrend (green) or downtrend (red), giving you straightforward entry points.
Short-Term Trend Precision with Hama Candles:
By calculating unique EMAs for open, high, low, and close, the Hama Candles show the strength and direction of short-term trends. Combined with the Hama Line, it gives you a solid confirmation on whether the trend is strong or about to reverse, allowing for precise entries and exits.
Avoiding Choppy Markets:
Thanks to ATR-based consolidation detection, this strategy identifies low-volatility periods where the market is “choppy” and less predictable. During these times, a yellow background appears on the chart, warning you to hold off on trades, reducing the likelihood of entering losing trades.
Built-In Risk Management:
With adjustable Take Profit and Stop Loss levels based on price movements, you can set and forget your trades, with a safety net if the market turns against you. The strategy automatically closes positions if the price returns to the Hama Candle, keeping your risk low.
How It Works:
Long Position: When both the SSL and Hama indicators show a green trend, and the price is above the Hama Candles, the strategy opens a long position. Take Profit triggers at your chosen risk-to-reward ratio, while Stop Loss protects you just below the Hama Line.
Short Position: When both indicators align in red and the price is below the Hama Candles, the strategy opens a short. Similar to longs, Stop Loss is set just above the Hama Line, and Take Profit is at your defined level.
Start Trading Confidently
Test this strategy with different settings and discover how it can perform across various assets. Whether you're trading Bitcoin, forex pairs, or stocks, this system has the flexibility and robustness to help you spot profitable trends and avoid risky zones. Try it today on a 30-minute timeframe to see how it aligns with your trading goals, and let the consolidation detection guide you away from false signals.
Happy trading, and may the trends be with you! 📈

Trailing Support and Resistance Zones
This Script code is used to plot support and resistance levels on a chart. Here's how it works:
Input Parameters: The code starts by defining an input parameter lookback_period, which determines the number of bars to look back when calculating support and resistance levels. You can adjust this parameter based on your preferences or trading strategy. I recommend 50 for longer trends and larger profits.
Calculate Support and Resistance Levels: The calculateSR() function is defined to calculate the support and resistance levels based on the lowest low and highest high prices within the specified lookback period. It uses the ta.lowest() function to find the lowest low price and the ta.highest() function to find the highest high price over the specified number of bars.
Plotting: The function calculateSR() is called to compute the support and resistance levels, and the results are stored in the variables support_level and resistance_level, respectively. These levels are then plotted on the chart using the plot() function. The support levels are plotted in green, while the resistance levels are plotted in red. Both lines are drawn with a specified line width and style (plot.style_stepline).
By visualizing these support and resistance levels on the chart, you can identify potential price levels where the market might find buying or selling pressure. These levels are crucial for making trading decisions, such as setting entry and exit points, defining stop-loss and take-profit levels, and assessing the overall market sentiment.
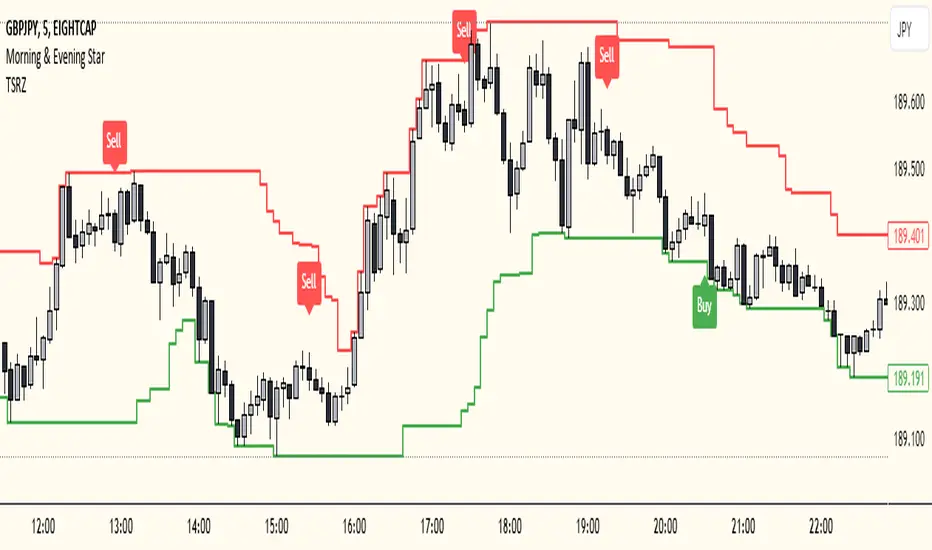
I recommend using this indicator together with my morning & Evening Star Indicator to find entry zones.
Time Range zoneThis TradingView script displays two time zones on the chart. The first zone starts at 8:00 AM and ends at 1:00 PM, while the second zone starts at 5:00 PM and ends at 10:00 PM. If the current time is within either of these two zones, a green or red background is drawn on the chart, respectively. This script is set by default for my personal XRP strategy.

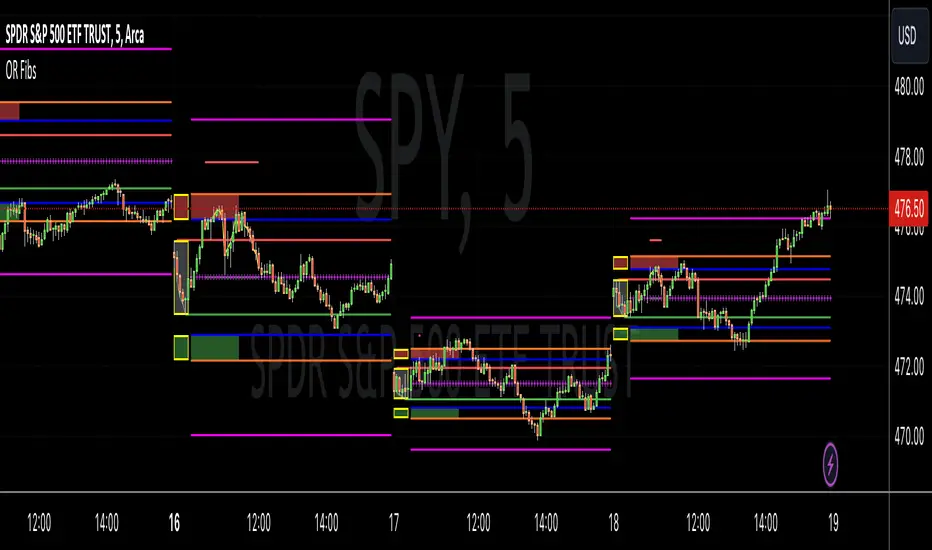
Opening Range Reversal ZonesThis script finds a reversal zone beyond the opening range for the selected period. I borrowed most of the opening range script itself from asenski.
I added a few things:
Trade Entry Times -- this restricts the "alert times."
Shading for the above mentioned times for the two "reversal" zones
A couple of other visuals for lines for the hi, mid, low of the opening range and lines for the fibs
Alerts while in the trading entry time session for fibbonacci crossovers.
I use this on NDX, SPY, and QQQs and have found buying "at the money" 0DTE puts in the "red zone" or 0DTE calls in the "green zone" frequently wins.
I have no statistics, as I am very methodical when I choose to enter, paying attention to the news, recent momentum, etc, and am not blindly entering when alert comes, but when one does, I do research and enter a trade.
In any case, thought I would share.
Fourier Smoothed Volume Zone Oscillator (FSVZO) [AlgoAlpha]Description
The Fourier Smoothed Volume Zone Oscillator (FSVZO) is an implementation of the Discrete Fourier Transform in a Volume Zone Oscillator. Its purpose is to smooth price data and reduce noise to provide a more clear and accurate indication of price movement. This indicator also includes additional EMA smoothing to accurately depict reversals.
Discrete Fourier Transform
The Discrete Fourier Transform (DFT) is a mathematical algorithm used to convert discrete time-domain data into its frequency-domain representation. By decomposing a signal into its constituent frequencies, it reveals the amplitude and phase information associated with each frequency component.
Volume Zone Oscillator
The Volume Zone Oscillator is an indicator that combines volume and price data to provide insights into market trends and momentum. It calculates the difference between the volume traded above and below a specified price level and represents it as a line plot on the chart. The Volume Zone Oscillator helps traders identify periods of high buying or selling pressure and can be used to confirm trends, spot divergences, and generate trading signals. By analyzing the relationship between volume and price, traders can gain a deeper understanding of market dynamics and make more informed trading decisions.
Features
This indicator incorporates Ehler's Universal Oscillator concept and presents a histogram to provide valuable insights into the market's noise levels. Ehler's Universal Oscillator represents the statistical model that characterizes random and unpredictable market behavior. By utilizing this concept, the histogram enhances traders' ability to identify periods of increased or decreased volatility in the market.
How to use it?
Green dots and lines represent bullish price movement, while red dots and lines indicate bearish price movement. These signals gain additional strength when considering our oversold and overbought zones. Traders and investors can leverage these signals to initiate long positions when green signals coincide with oversold conditions, and vice versa. By combining these signals in synergy with Ehler's Universal Oscillator, a more precise representation of market trends can be achieved. To optimize its effectiveness, it is advisable to integrate this indicator with complementary technical analysis tools and incorporate it into a comprehensive trading strategy. Traders are encouraged to explore diverse settings and timeframes to align the indicator with their individual trading preferences and adapt it to prevailing market conditions.
Utility
By combining the FSVZO indicator with Ehler's white noise histogram, users gain a comprehensive perspective on volume-related market conditions. It empowers traders and investors to evaluate the intensity of buying or selling pressure, detect potential trend reversals or continuations, and ultimately make more informed trading decisions. This information can serve as confirmation or validation for other technical indicators, enabling traders to identify potential market turning points and enhance their comprehension of market dynamics.
The indicator offers several valuable applications, including the detection of divergence patterns between volume and price, identification of accumulation or distribution phases, and assessment of overall market trend strength. It accommodates various trading styles, such as swing trading, trend following, or mean reversion strategies. By leveraging these capabilities, traders can expand their toolkit and make more informed trading decisions.
Originality
The originality of the script lies in the combination of the Fourier analysis, white noise calculations, and the Volume Zone Oscillator. It provides a unique perspective on market dynamics and can be used to identify potential trading opportunities based on overbought and oversold conditions as well as trend reversals. Special thanks to @QuantiLuxe for their assistance in the development of this indicator

Reversion Zone IndexThe Reversion Zone Index (RZI) is an indicator that combines the Commodity Channel Index (CCI), Choppiness Index (CI), and Bollinger Bands Percentage (BBPct) to identify mean reversion signals in the market. It is plotted as an Exponential Moving Average (EMA) smoothed oscillator with overbought and oversold zones, and mean reversion signals are represented by red and green arrows.
The three indicators are combined to benefit from their complementary aspects and create a more comprehensive view of mean reversion conditions. Here's a brief overview of each indicator's benefits:
1. Commodity Channel Index (CCI): CCI measures the current price level relative to its average over a specified period. It helps identify overbought and oversold conditions, as well as potential trend retracements. By incorporating CCI, the RZI gains insights into momentum and potential turning points.
2. Choppiness Index (CI): CI quantifies the market's choppiness or trendiness by analyzing the range between the highest high and lowest low over a specific period. It indicates whether the market is in a trending or ranging phase. CI provides valuable information about the market state, which can be useful in mean reversion analysis.
3. Bollinger Bands Percentage (BBPct): BBPct measures the current price's position relative to the Bollinger Bands. It calculates the percentage difference between the current price and the bands, identifying potential overbought or oversold conditions. BBPct helps gauge the market's deviation from its typical behavior and highlights potential reversal opportunities.
The RZI combines the three indicators by taking an average of their values and applying further calculations. It smooths the combined oscillator using an EMA to reduce noise and enhance the visibility of the trends. Smoothing with EMA provides a more responsive representation of the overall trend and helps filter out short-term fluctuations.
The overbought and oversold zones are marked on the chart as reference levels. When the combined oscillator is above the overbought zone or below the oversold zone, it suggests a potential mean reversion signal. Red and green arrows are displayed to visually indicate these mean retracement signals.
The RZI is a valuable tool for identifying mean reversion opportunities in the market. It incorporates multiple indicators, each providing unique insights into different aspects of mean reversion, such as momentum, volatility, and price positioning. Traders can use this indicator to spot potential turning points and time their trades accordingly.

Jerry J8 MACD Optimal Entry Zone---- STRATEGY
This MACD indicator includes an optimal entry zone for entering your trades and works with any symbol in any time frame. The optimal entry zone is defined by user controlled inputs for up to 10 symbols and is pre-loaded with the SPY, IWM, QQQ, NDX, and TESLA for the 3 minute time frame. Additionally, you can add up to 5 more symbols and adjust the optimal entry zones for each signal.
The optimal entry zone is the range above and below the MACD zero line where the highest probability trades can be entered. Too far above or below the zero line and the move is more likely to be exhausted or premature. This is not an exact science and you will want to set the zone for each symbol on the chart time frame you trade.
The reason this indicator is so helpful is because the optimal entry zone changes for every symbol and for every time frame and this indicator automatically shows these zones for up to 10 stock symbols.
---- SETUP & HINTS
There are times when the MACD may be outside of the optimal range but due to other factors (for example, high volume or market moving news) I would choose to enter a trade.
Indicators are not a magic pill and should be used to support trading decisions, not to make them for you. Past performance is not a guarantee of future returns. The results of individual stocks/indexes with any strategy do not constitute proof they will repeat in the future.
DISCLAIMER: The information contained in our scripts/indicators/ideas does not constitute financial advice or a solicitation to buy or sell any securities of any type. Trading and investing in the stock market and cryptocurrencies involves substantial risk of loss and is not suitable for every investor. I’m NOT a financial adviser. All trading strategies are used at your own risk.
Please use the AUTHOR’s INSTRUCTIONS link below for more information.

Investing ZonesInvesting Zones indicator shows the areas where LONGS or SHORTS can be made, the areas are calculated based on the mathematical averages of the high and low peaks of the price.
-There is an area called "No trading Zone" where the price is too slow, It also has a Alma Trend Ribbon (blue for uptrend, pink for downtrend) that helps to make trading decisions.
-You can make shorts when the price enters the Yellow zone called the "Sell Zone" and the price is below the Alma trend, set the TP1 in the white dotted line, and TP2 in the white lower line
-You can make longs when the price enters the Green zone called the "Buy Zone" and the price is above the Alma trend, set the TP1 in the yellow dotted line, and TP2 in the yellow upper line
-It works in all timeframes, personally I use it in 1min, 5min and 1hr.

Fibonacci Zones EMA Zones StrategyThis idea is only for fun and learning purposes only.
The strategy represents 2 simple math formulas that are very simple. the "Fibo Formula" and the "EMA Formula" Please see source code for reference
I Feel like coders can learn a lot about developing strategies using this source code
This is to show that there is unlimited amount of variables and factors to a strategy and its all about working with probability.
Also to show that unlimited amount of conditions could be added to a strategy.
And unlimited amount of variables/factors with the settings that could change the results.
Rules are simple
Entry on close, Close/Entry must be in the blue Fibo Zone
Blue Fibonacci zone fully customizable
Other Conditions could be added involving EMA zones, Over Ema1, Under Ema1 etc..
TP/SL and Dates Fully Customizable
This script is just an idea fully for learning purposes.

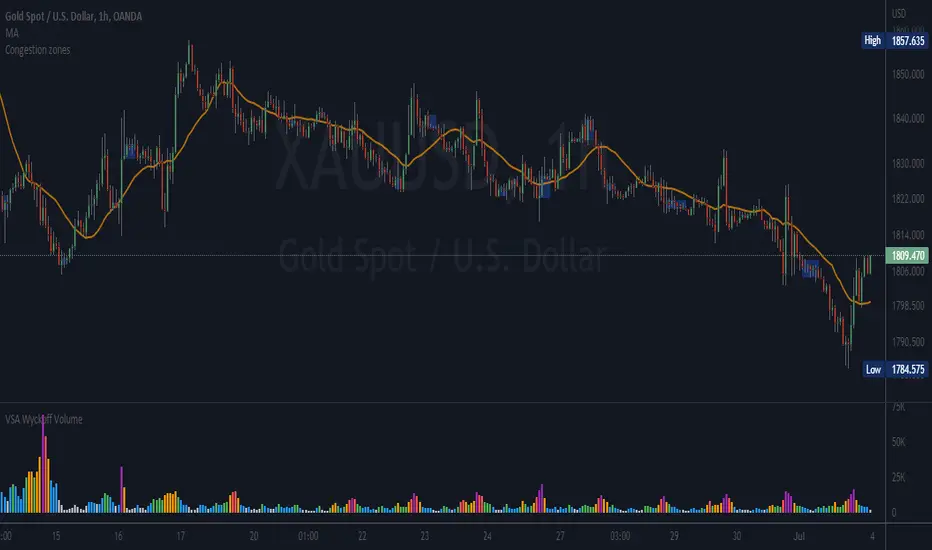
5kto1M - Congestion ZonesCongestion zone include at least 3 candle sticks that the next candle has an opening and closing price within the previous candle
When the price returns to the congested zone there is a possibility of a reversal
The congestion zone is used as a support-resistance area and is used by price action traders.
This script will highlight congestion zones, this will help PA Traders find out them easily.
You can configure the minimum number of candles
VWAP with 7EMA with ZonesThis is a script with 7 EMAs for every type of trades. This indicator also has the daily weekly and monthly zones. 20,50,100,200 EMAs being the best EMAs of all.
RSI with Divergences, Reverse Formulas, and Bull/Bear ZonesRegular RSI indicator that can underline divergences, turn green or red specifying user specified bull/bear zones, and with a label showing the price needed to turn bull/bear!
Specify the inputs:
+ RSI Length
+ Bull Threshold
+ Bear Threshold
+ Panel Position Offset
Also with toggle-able:
+ Bullish Divergence
+ Bearish Divergence
+ Hidden Bullish Divergence
+ Hidden Bearish Divergence
The zones included in the indicator are default and not meant to be used for all markets. The goal is to alter the bull/bear zones to find good breakout points and selloff points for your chosen security. Does not currently support automatic zone creation, or saving zones for each security (if that is even possible, may just need to create different layouts for each security).
Thanks!

DD Nifty Zone MarkerDear Investor / Trader,
DD Nifty Zone Marker is a flag to identify the Supply and Demand zones.
I have coded the flag in such a way when there is an imbalance between the buyer and the seller, the flag is triggered.
There are 2 type of candle.
Equilibrium Candle (E-Candle):
They imply that transactions are happening in a range thus Buyer and Seller are in balance
Candle with Body Range <= 50% of Candle Range
Im-Balance Candle (IB-Candle):
They imply imbalance between Buyer and Seller thus price starts moving either up or down
Candle with Body Range > 50% of Candle Range
Demand Zone Formation (DZ):
Condition 1:
1. Reversal Pattern – RED IB Candle - > BLUE E Candle - > GREEN IB Candle
2. Continuous Pattern – GREEN IB Candle - > BLUE E Candle - > GREEN IB Candle
Condition 2:
The two candles immediately following the IB Candle must each make a new High. They do not have to make a Higher close, just Higher high. It can be an E Candle or IB Candle
Supply Zone Formation (SZ):
Condition 1:
1. Reversal Pattern – GREEN IB Candle - > BLUE E Candle - > RED IB Candle
2. Continuous Pattern – RED IB Candle - > BLUE E Candle - > RED IB Candle
Condition 2:
The two candles immediately following the IB Candle must each make a new Low. They do not have to make a lower close, just lower lows. It can be an E Candle or IB Candle.
Flag Name:
DZ - Demand Zone
SZ - Supply Zone
Suggested time frame:
Scalping trading - 1 Min or 3 Min
Intraday trading - 5 Min or 15 Min
Swing Trading - 1 Hr or 4 Hr
Positional Trading - 1 Day
Buy Opportunity:
Entry - When there is a formation of DZ flag in an up trend of the underlying.
Stop loss should be the low of the BLUE candle.
Sell Opportunity:
Entry - When there is a formation of SZ flag in a down trend of the underlying.
Stop loss should be the high of the BLUE candle.
High POP Setup:
One can take trades based on the flag when there is a correlation with Pivot , Camarilla , higher period MA.
Note: Trade only the pull back.

DMI & ST DEV zone intersection [LM]Hello Traders,
This indicator uses two indicators st dev extremes and DMI extremes and visualize intersection of both indicators extreme zones using crosses. It means where cross is rendered intersection of extremes has occurred.
The standard deviation uses the same calculation as my Standard deviation zones Support & Resistance indicator, DMI indicator measures both the strength and direction of a price movement. I am using both indicators to find the intersection of extreme zones between them.
ST DEV settings:
source
tops setting
bottom setting
DMI settings:
length settings
extreme zone setting
Enjoy,
Lukas

Kill Zone SessionsKill Zone Sessions
Kill Zone Sessions is an indicator that allows you to highlight customizable backgrounds for specified time zones. The problem with 99% of all session indicators on TradingView is that they only plot real-time, sure this is good when you look back on the charts with loaded data. Looks pretty I guess, but having it in real-time with no forward plotting abilities is useless. It provides a trader with no preparedness or edge to trade within that time frame.
The solution is to plot the next 24 hours in advanced of the current time, that way you will always see when the sessions are in relation to your current time.
This will highlight the time zone 24 hours in advance so you always know when the session are and can plan TA around that!
15m USDCHF
1m GBPUSD
5m BTCUSD

STC Price Action ZoneHow this works:
This Indicator looks to identify patterns which shows high movement area which may have occurred due to big orders at that time. It helps to Identify Price Action Zones where we may anticipate some reverse move. These Zones & Moves are helpful for Traders.
Buying Zone is below current Market Price. It indicates Price Action area where Buyers overpowered Sellers hence there was big Leg out Candle. This zone may again give buying momentum if Price comes back to that level. As a Trader one may take opportunity enter into the Trade on Bullish Side.
Selling Zone is above current Market Price. It indicate Price Action area where Sellers overpowered Buyers hence there was big Leg out Candle. This zone may again give Selling momentum if Price comes back to that level. As a Trader one may take opportunity enter into the Trade on Bearish Side.
DISCLAIMER:
This indicator/code IS NOT intended to be a formal investment advice or recommendation by the author, nor should be construed as such. Users will be fully responsible by their use regarding their own trading vehicles/assets.
It is strongly recommended that you should get full knowledge of how price actions work and wait for the clear indications before attempting.

Support Resistance ZonesSupport and resistance zones are used across all markets by traders and bots alike to identify liquidity and possible bounce areas. This script automates the drawing of those zones based on a number of variables, such as lookback period, channel width, number of touch confirmations and more.
This script also implements a some useful alerts so you can rest easy until the market hits a point of interest:
Enter SR Zone
Exit SR Zone
Break Upper Resistance
Break Lower Resistance

Mayfair Supply & Demand Zones 1.0Identifying Supply and Demand zones can be tricky.
Just using price levels can mislead you, so why not include volume ramps to detect zones?
This indicator does it for you. It spots areas where volume has rapidly increased, measures the speed of the increase, and assigns three different levels of importance.
The red areas are the strongest zones, followed by amber, then green, like a traffic light.
The red areas are persisted longer than the amber, which are persisted longer than the green. As the persistence fades, the colour of the zone fades as well.
It is possible to set the levels of all three volume thresholds to suit yourself, as well as the lookback period the script uses to detect volume increases.
In this chart, only very large volume increases are used:
As you can see, the bands are narrower, but we feel the defaults give the best results.

Ishiki ZoneOANDA:USDJPY
Ishiki Zone is drawn to the conscious price range and functions as a very strong resistance zone.
The strength of the resistance band is indicated by color. The strongest is the red zone, the second strongest is the yellow zone, and the third strongest is the blue zone.
In the vicinity of Ishiki Zone, create a chart pattern at the Day bar or more of the time axis, it is often to new trend formation.
currency pair:USDJPY, EURUSD
意識ゾーンは市場全体に意識されているであろう価格帯に引いており、非常に強い抵抗帯として機能します。
色別で抵抗帯の強さを表しており、1番強いのがレッドゾーン、2番目に強いのがイエローゾーン、そして3番目がブルーゾーンとなっています。
意識ゾーン付近では、日足以上の時間軸でチャートパターンや何かしらの値動きを作り、そこからまた新たにトレンド形成することが多いです。
意識ゾーンは大きな時間軸の環境認識として利用するのが適しています。
対応通貨ペア:USDJPY, EURUSD
