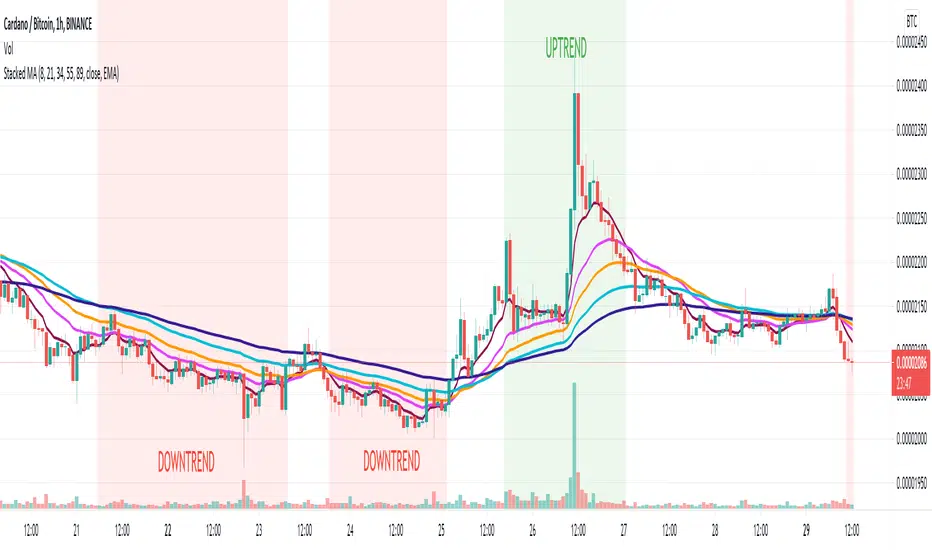
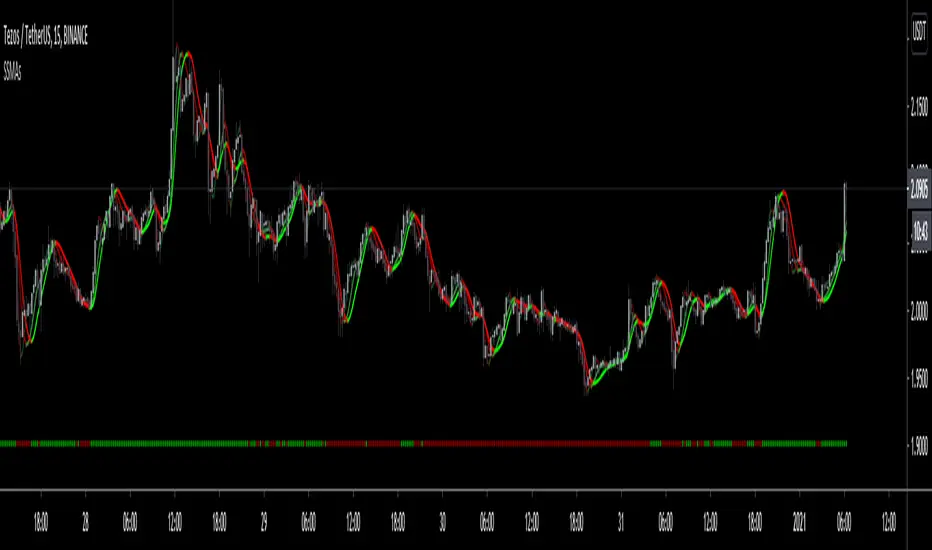
Stacked Moving AveragesThe Stacked Moving Averages indicator lets you see if a ticker is in an uptrend, downtrend, or no trend based on the condition of the moving averages. If the moving averages are stacked such that MA1>MA2>MA3>MA4>MA5, then that is described as an uptrend. If the moving averages are stacked such that MA5>MA4>MA3>MA2>MA1, then that is defined as a downtrend.
The moving averages can be SMA, EMA, or DEMA, and it’s possible to view all the moving average series in the chart or hide all series and only see if there is an uptrend or downtrend according to the condition.
Note: If length 4 OR length 5 is zero the MA4 OR MA5 will be ignored.
Sma
Quad MAFor a dive into the fine details, see the source code/documentation.
Quad MA is a program designed to allow a wide range of flexibility in overlaying multiple moving averages onto a chart.
This program handles the ability to:
- Overlay Up to 4 moving averages on the chart.
- Change the length of each moving average.
- Adjust optional values for special moving averages
(least squares and Arnaud Legoux)
- Change the color for each moving average.
- Change the type of each moving average individually.
- Change the visibility of each moving average.
- Change the source of the moving averages.
- Set alerts for a cross between any two moving averages.

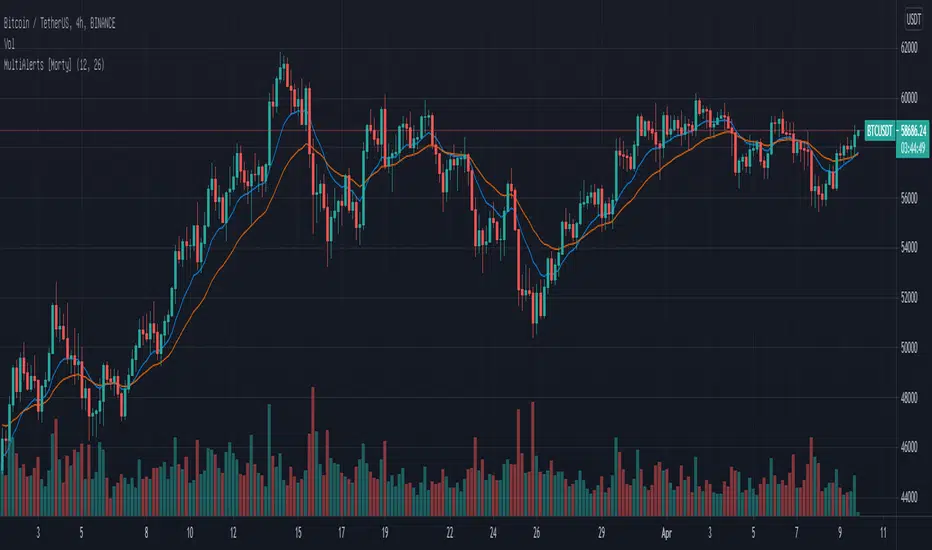
Multiple Alerts by MortyMultiple Alerts by Morty
Version 1.0, Updated at 20210322
When the following signals meet the conditions, alerts will be triggered.
close price cross SMA
SMA_fast cross SMA_slow
MACD cross signal
RSI overbought and oversold
close price cross Bollinger Bands
Momentum cross 0 level
This script will also plot two MAs, EMA default ( SMA optional ).
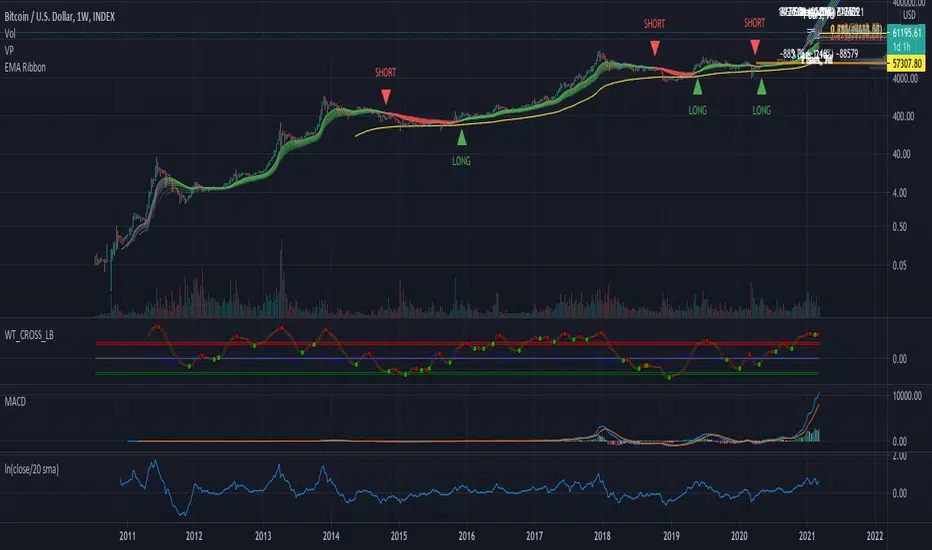
Price Extension - ln(close/20 sma)A simple script to visualize price extension. Useful to gauge tops/oversold areas. Most useful when used on weekly tf.
Monthly, Quaterly, Yearly SMA trendsIt highlights on the chart when the SMA20 crosses the SMA60 etc. for the Monthly, Quaterly, Yearly SMA trends.

Customizable MA RibbonAll credits to @Violent (www.tradingview.com) for making the original code! I just updated it by adding new features and themes!
---------------------------------------------
Lemon's Customizable MA Ribbon:
---------------------------------------------
A series of moving averages of different lengths that create a ribbon-like indicator. Traders can determine trend strength by lookin at the distance between the moving averages and the overall balance of the colored lines. Price movements through the ribbon can also be used to identify trend changes.
------------
FEATURES
------------
MA TYPES: SMA , EMA , WMA, RMA, ALMA, VWMA, HMA
Editable length
Editable start
User defined number of plots to show (between 1 to 32 total plots)
Multiple color theme choices
A color smoothing option.
Thank you and happy trading!
with love,
-Lemon

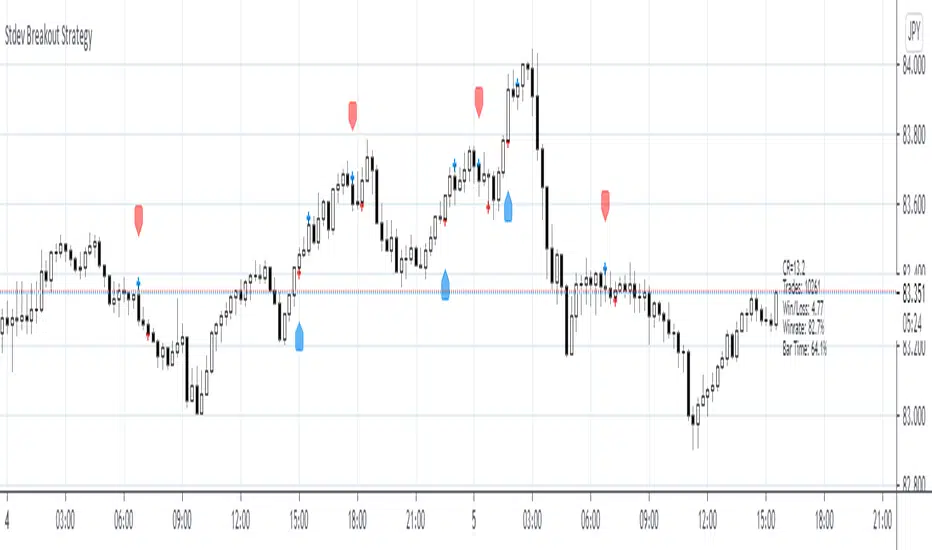
Stdev Breakout StrategyStdev Breakout Strategy
Description:
This script generates a long entry signal when the Standard Deviation crosses over the Simple Moving Average and the Close is greater than the Open, and/or generates a short entry signal when the Standard Deviation crosses under the Simple Moving Average and the Close is less than the Open.
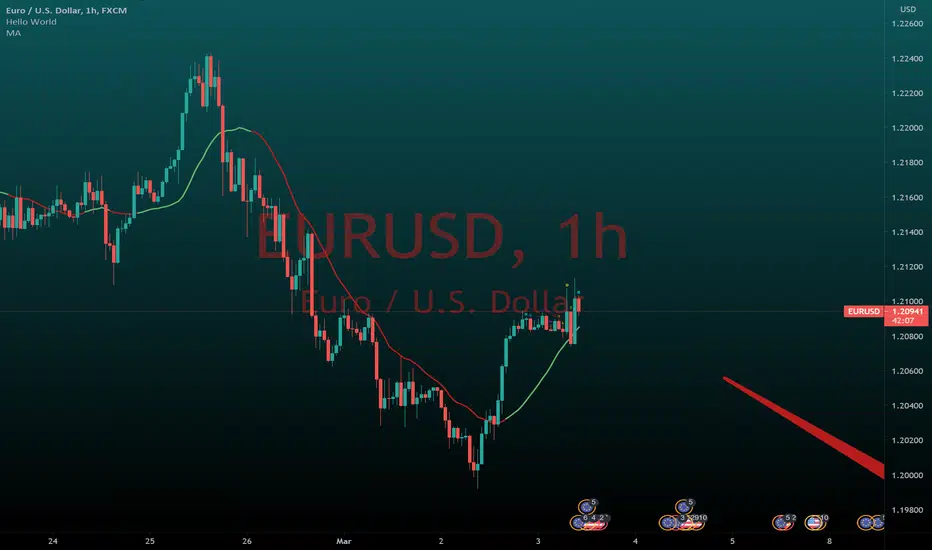
Moving Average Slope to determine market directionMoving Average Slope is a straightforward but also a handy indicator.
By inserting this moving average, it is possible to glance at the direction of the trend.
When the moving average has an increasing angle, it will turn green; vice versa, it will be colored red.
It is a trend indicator; I recommend leaving the period at 20 because it includes the last four trading weeks.
If you found this indicator useful, please like it
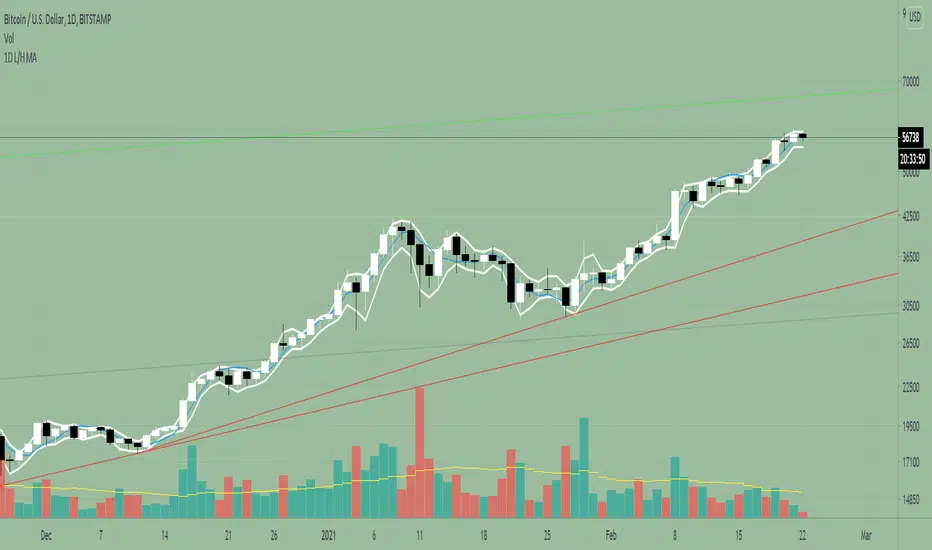
1D Low/High MA + Least Square Mean (3 indicators in 1)This indicator is a combination of 3 public indicators being:
* a standard Simple Moving Average with the source as the candle low & length of 2
* a standard Simple Moving Average with the source as the candle high & length of 2
* the Least Square Mean with a source of high + low /2 and length of 9
This combo was inspired by Tyler Coates who crafted EMASAR.
He regularly uses the a SMA with source of Low / High and length of 2 for defining trading daily ranges as well as the Least Square Mean for calculations in the his trading which he teaches via youtube.
I hope this indicator will reduce time spent on setting up charts.
Buy/Sell/Hold/Away? This script based on Simple Moving Average and Exponential Moving Average.
The Red Line is an exponential moving average with small length. It act as a main line.
The Black Line is an average of some past data of exponential moving average. Act as Trend Line
The green circles is an exponential moving average with medium length. It act as a signal line.
The Idea is, when the price move higher from it past,past,past, repeatedly in some duration, it will gain enough energy to fly to the highest.
Buy signal when red line cross down green circle. strong buy when red line cross down black line.
Sell signal when red line cross down green circle. strong buy when red line cross down black line.
Additional 1:
Triangle up(blue) indicate Buy Signal. it happen when the price break resistant with some condition and volume>1m
Triangle down(maroon) indicate Sell Signal. it happen when the price break support with some condition and volume>1m
The more triangle show in series, the strong the trend to move accordingly.
Additional 2:
Support and Resistance line.
Hope Benefit To You All.

Customisable Moving Averages x5This is a Moving Averages pack with 5 lines.
This indicator is different from others because with it you can select the MA type used in calculations for each line.
Available MA types are (currently):
SMA
EMA
WMA
VWMA
RMA
HMA
Also configurable (for each line) are data source (open, close, hlc3, etc) and period.
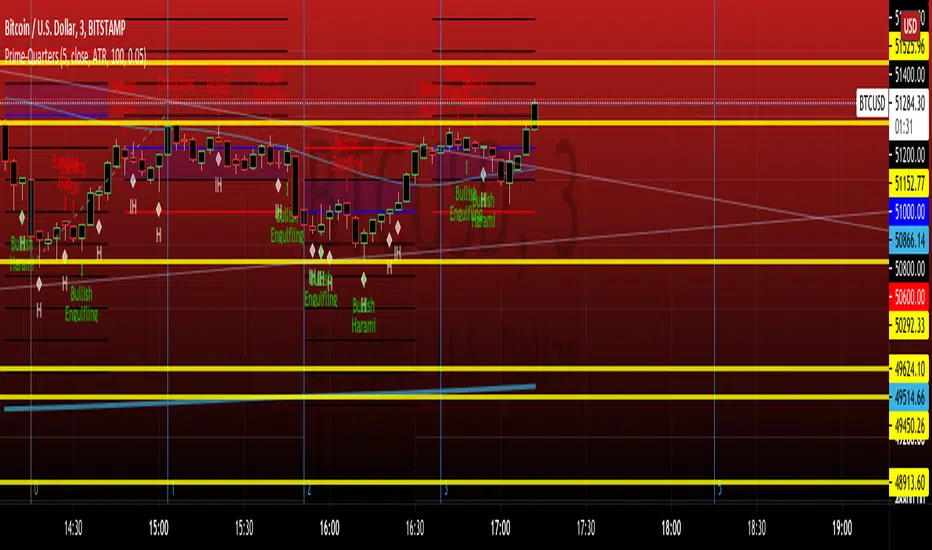
PRIME IMPULSE W/ 3MAThis indicator bundle, combined with PRIME-QUARTERS, provides a trader with everything needed, on chart, to make swing and scalper entries. The short candle SMA are used to execute immediate entries, while the larger candle tf indicate Continuation, trend changes and swing points. The color coded impulse indicator used both RSI and TSI variables to determine divergences and the probability of the impending impulse thereafter. Red and green within the candles indicate bull or bearish impulses, while the yellow bars signal decreased volume and momentum for the current impulse, indicating the possible end of trend and either retracement, or Reversal. $auceCamp
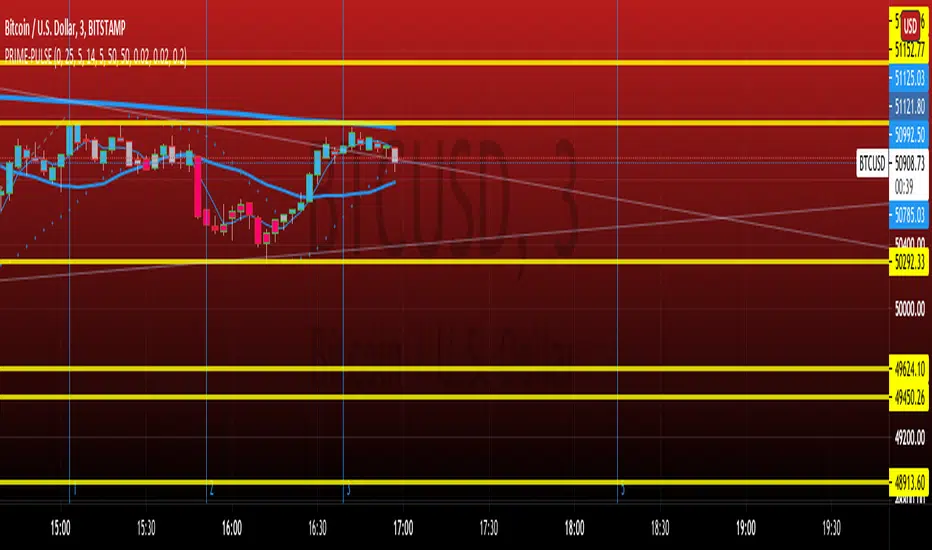
PRIME-QUARTERS W-XsThis script applies both the Quaters theory for easy analysis of market structure, as well as a 50 and 800 SMA to be used in conjunction with the 4 and 21 SMA found in Prime-Pulse, to pin point sniper entries. $auceCamp
MA, MATR, ChEx | All in One - 4CR CUPIn trade position setup, we always need to determine the market structure and manage the position sizing in a short period of decision time. Indicators such as moving average, initial stop loss and trailing stop loss are always helpful.
This indicator put all these handy tools into a single toolkit, which includes the following price action and risk management indicators:
MA - Moving Average
MATR - Moving Average less Average True Range
ChEx - Chandelier Exit
This script further enhances the setting so that you can easily customize the indicators.
For both the Moving Averages and the Moving Average less Average True Range , you can pick a type of moving average which suits your analysis style from a list of commonly used moving average formulations: namely, EMA , HMA , RMA, SMA and WMA , where EMA is selected as default.
The Moving Average less Average True Range , MATR, is usually applied as a reference to set the initial stop loss whenever opening a new position.
The abbreviation, MATR, is picked, so that this can serve as a handy reminder of a very good trading framework as elaborates as below:
M – Market Structure
A – Area of Value
T – Trigger
R – Risk Management (aka. Exit Strategy)

Rainbow Trend IndicatorThis is an indicator based on the MA rainbow concept. It is possible to choose between 15 or 20 MA's and if all 15 MA's is picked, the calculation will be calculated on 15 MA's and if 20 is picked the calculation is calculated on 20 MA's. The indicator will then be a line which is assigned a value from the calculation based on the MA's. If the line is above the dashed zero line, meaning the line's last value is a positive value, the price is in a uptrend and if the line is below the dashed zero line, meaning the line's last value is a negative value, the price is in a downtrend.
In short
If the line is green, the price is in a uptrend. If the line is red, the price is in a downtrend.

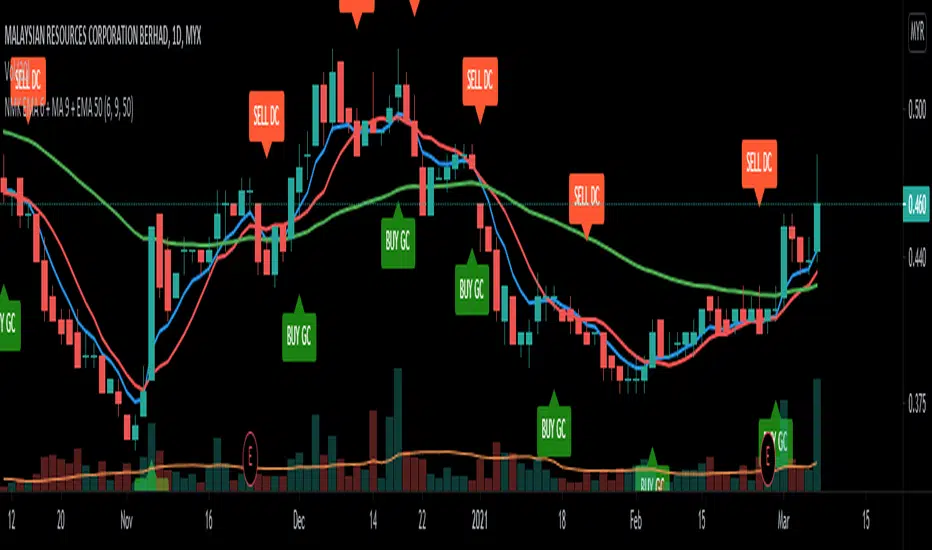
NMK EMA 6 + MA 9 + EMA 50Conceived by Murad Khalid
Shows the GC of EMA 6 and MA 9
Shows the DC of EMA 6 and MA 9
Use EMA 50 as the dynamic support
SwingScalpin MA'sDefault
HMA's + Trend Signals
Default SMA's
ALMA
BarColoring
The idea behind this script was to incorporate a few different moving average types into 1 indicator so multiple trading strategies could be implemented depending on Price Action. This indicator includes 3 HMA's, 2 user defined EMA/SMA's, 1 ALMA (which also is used for the bar coloring), and Trend signals at the bottom of the chart (which are defined by the 1st MA). By default all of the Moving Averages are set to false because they aren't meant to be used together unless you so chose to. The only feauture initially being shown are the Trend signals at the bottom of the screen.
HMA's - The default lengths for the HMA's are 7, 14, and 21.
This is not Financial Advice nor am I saying this works all of the time but here are a few examples of how I've traded the HMA's... OF course thid depends on overall PA but the idea is to enter and exit when all
three HMA's turn Green or Red...
For quicker entries and exits, you could enter when the Fast HMA crosses the Medium HMA and exit when the it crosses back over/under the Medium HMA.
For more of a swing trade and when there's definitely an established trend, I would stay in the trade until Fast HMA crosses under the Slow HMA, otherwise it might just be a normal retrace prior to making another move up.
When PA is ranging but not really trending in either direction, I'll use the Slow HMA as somewhat of a Trailing SL.
The 2 user defined moving averages can either be an EMA or SMA. The 1st MA is set to the 200 SMA by default, which also triggers the Trend signals at the bottom of the chart. The 2nd MA is set to the 6 SMA by default.
The ALMA is set to 50 by default, which is also used for the bar coloring. Lastly, all of the MA's change color depending on the trend.
Custom Moving Average (EMA & SMA)This script is a custom visualization tool to plot 4 Moving Averages (MA).
Each MA is customizable; you can:
enable (disable) the plot of MA;
select whether the MA is an EMA or an SMA;
the length;
the source (open, close, ...);
the offset value (default is 0).
Note:
The 1st MA is an EMA with length 50.
The others MAs are SMA with length 9, 30 and 100 respectively.

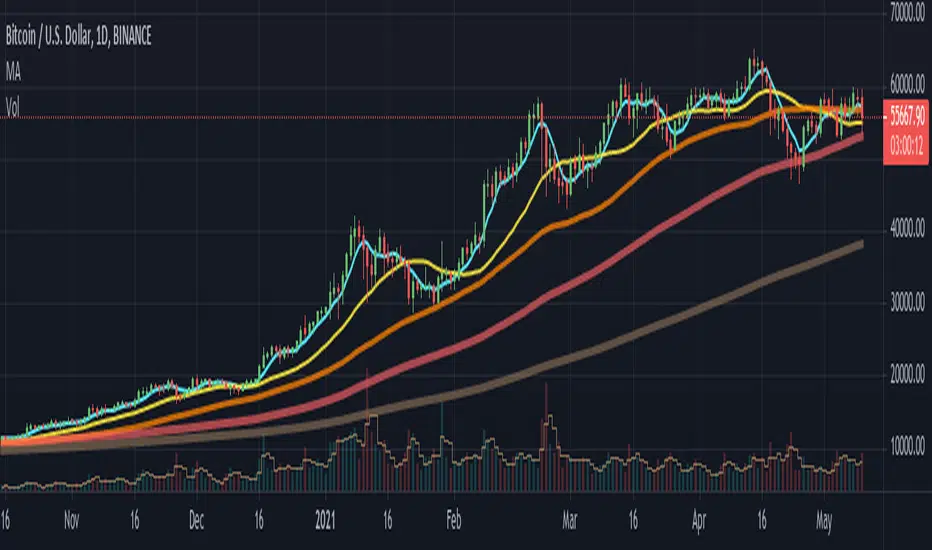
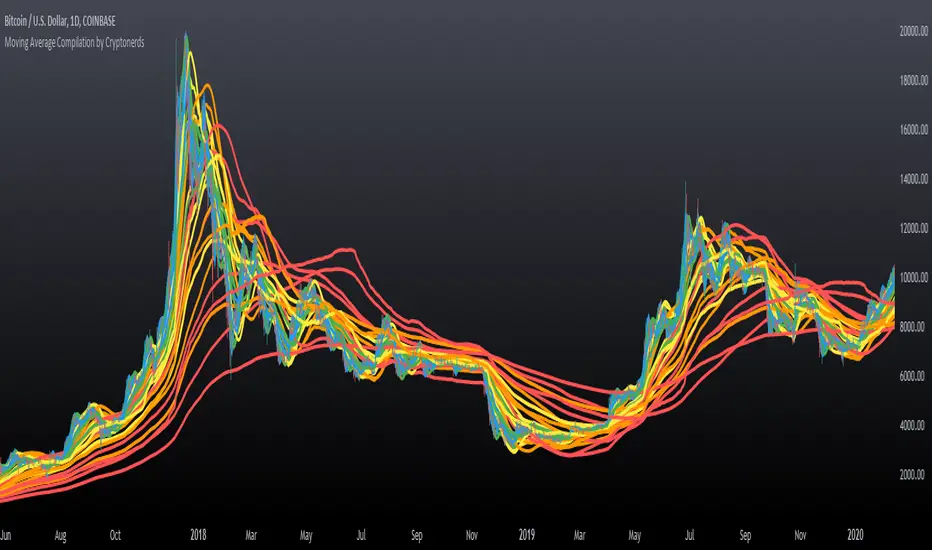
Moving Average Compilation by CryptonerdsThis script contains all commonly used types of moving averages in a single script. To our surprise, it turned out that there was no script available yet that contains multiple types of moving averages.
The following types of moving averages are included:
Simple Moving Averages (SMA)
Exponential Moving Averages (EMA)
Double Exponential Moving Averages (DEMA)
Display Triple Exponential Moving Averages (TEMA)
Display Weighted Moving Averages (WMA)
Display Hull Moving Averages (HMA)
Wilder's exponential moving averages (RMA)
Volume-Weighted Moving Averages (VWMA)
The user can configure what type of moving averages are displayed, including the length and up to five multiple moving averages per type. If you have any other request related to adding moving averages, please leave a comment in the section below.
If you've learned something new and found value, leave us a message to show your support!
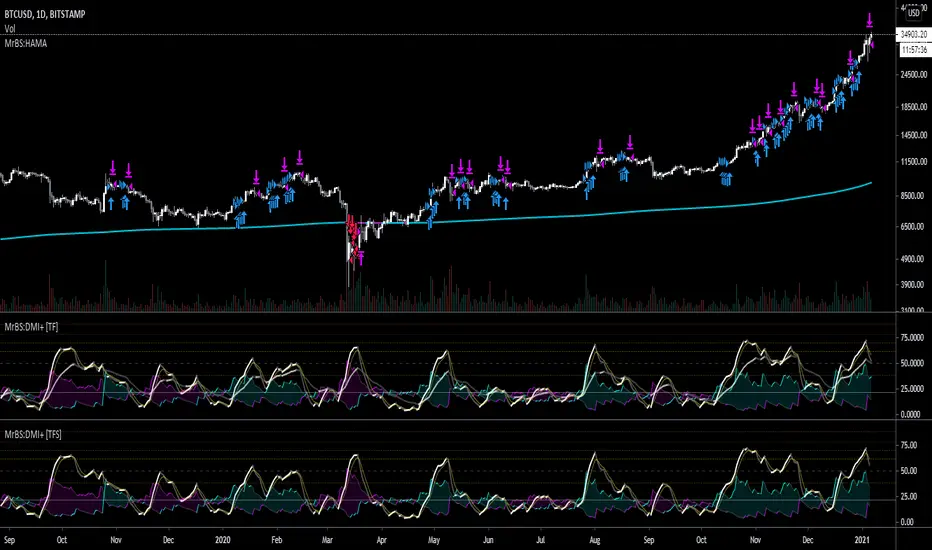
MrBS:EMA/SMA/HMA (Heikin Ashi Calc)This indicator allows you to base the MA calculation from Heikin Ashi values on normal charts and/or the real OHLC values while looking at Heikin Ashi.
There are 3 MA types you can select - EMA / SMA / HMA
The colour is based on the slope.
I made this to help me visualize my DMI+ strategy, when I was looking at taking signals from Heikin Ashi but looking at candlesticks. Turns out, I was going down the wrong road. Now I'm looking into using the real OHLC values for generating signals but watching the Heikin Ashi chart as I find it easier to see trends on it.
Hopefully its useful to some people, and if you have any suggestions for improvements I'd love to know.
[MACLEN] HODL ZONE RENKO
PLEASE READ!
Trade at your own risk. Please read about renko charts before using this indicator. This indicator is for educational purposes only.
This Indicator is only valid in renko charts with 1 second timeframe. For BTCUSDT . With the traditional method and the size box of 80.
With this indicator we can detect zones of buy and sell. Even that is not recommended to use leverage, I use it to find an entry and use only small leverages. It could be also used to accumulate and HODL bitcoin .
Please, comment anything.
POR FAVOR LEER!
Tradea bajo tu propio riesgo. Por favor lee sobre las graficas renko antes de usar este indicador. Este indicador es solamente con fines educativos.
Este indicador es válido solamente en graficas renko con un timeframe de 1 segundo. Para BTCUSDT . Con cajas del método tradicional de un tamaño de 80.
Con este indicador podemos detectar zonas de compra y venta. A pesar de que no es recomendable usar apalancamiento, yo lo uso para encontrar entradas y solo uso apalancamientos pequeños. También podría usarse para acumular y holdear bitcoin .
Por favor, escríbeme cualquier duda o comentario.
