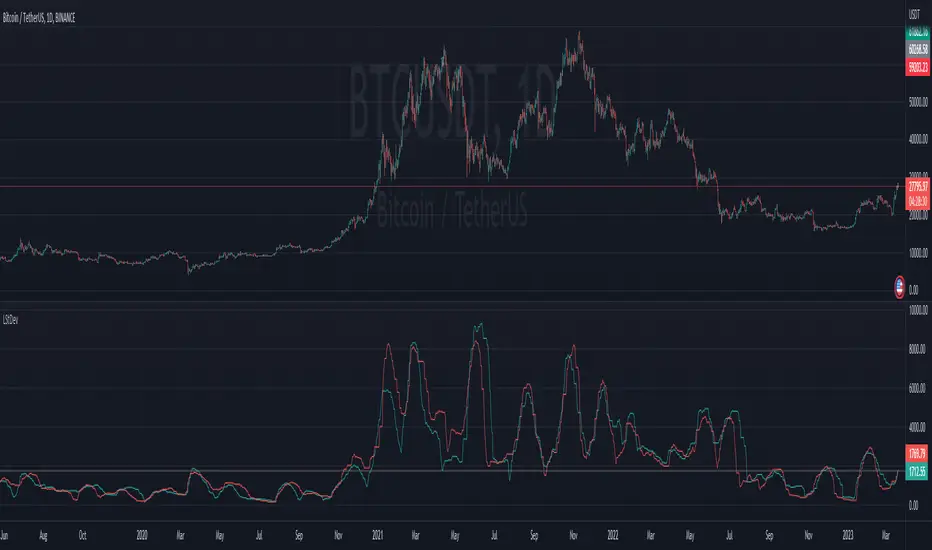
Machine Learning: STDEV Oscillator [YinYangAlgorithms]This Indicator aims to fill a gap within traditional Standard Deviation Analysis. Rather than its usual applications, this Indicator focuses on applying Standard Deviation within an Oscillator and likewise applying a Machine Learning approach to it. By doing so, we may hope to achieve an Adaptive Oscillator which can help display when the price is deviating from its standard movement. This Indicator may help display both when the price is Overbought or Underbought, and likewise, where the price may face Support and Resistance. The reason for this is that rather than simply plotting a Machine Learning Standard Deviation (STDEV), we instead create a High and a Low variant of STDEV, and then use its Highest and Lowest values calculated within another Deviation to create Deviation Zones. These zones may help to display these Support and Resistance locations; and likewise may help to show if the price is Overbought or Oversold based on its placement within these zones. This Oscillator may also help display Momentum when the High and/or Low STDEV crosses the midline (0). Lastly, this Oscillator may also be useful for seeing the spacing between the High and Low of the STDEV; large spacing may represent volatility within the STDEV which may be helpful for seeing when there is Momentum in the form of volatility.
Tutorial:
Above is an example of how this Indicator looks on BTC/USDT 1 Day. As you may see, when the price has parabolic movement, so does the STDEV. This is due to this price movement deviating from the mean of the data. Therefore when these parabolic movements occur, we create the Deviation Zones accordingly, in hopes that it may help to project future Support and Resistance locations as well as helping to display when the price is Overbought and Oversold.
If we zoom in a little bit, you may notice that the Support Zone (Blue) is smaller than the Resistance Zone (Orange). This is simply because during the last Bull Market there was more parabolic price deviation than there was during the Bear Market. You may see this if you refer to their values; the Resistance Zone goes to ~18k whereas the Support Zone is ~10.5k. This is completely normal and the way it is supposed to work. Due to the nature of how STDEV works, this Oscillator doesn’t use a 1:1 ratio and instead can develop and expand as exponential price action occurs.
The Neutral (0) line may also act as a Support and Resistance location. In the example above we can see how when the STDEV is below it, it acts as Resistance; and when it’s above it, it acts as Support.
This Neutral line may also provide us with insight as towards the momentum within the market and when it has shifted. When the STDEV is below the Neutral line, the market may be considered Bearish. When the STDEV is above the Neutral line, the market may be considered Bullish.
The Red Line represents the STDEV’s High and the Green Line represents the STDEV’s Low. When the STDEV’s High and Low get tight and close together, this may represent there is currently Low Volatility in the market. Low Volatility may cause consolidation to occur, however it also leaves room for expansion.
However, when the STDEV’s High and Low are quite spaced apart, this may represent High levels of Volatility in the market. This may mean the market is more prone to parabolic movements and expansion.
We will conclude our Tutorial here. Hopefully this has given you some insight into how applying Machine Learning to a High and Low STDEV then creating Deviation Zones based on it may help project when the Momentum of the Market is Bullish or Bearish; likewise when the price is Overbought or Oversold; and lastly where the price may face Support and Resistance in the form of STDEV.
If you have any questions, comments, ideas or concerns please don't hesitate to contact us.
HAPPY TRADING!
Стандартное отклонение

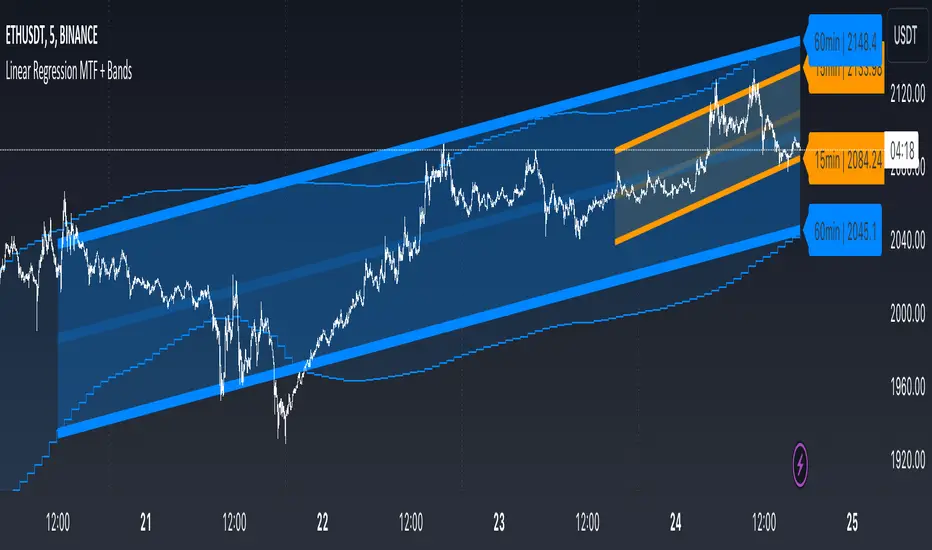
Linear Regression MTF + Bands
Multiple Time Frames (MTFs): The indicator allows you to view linear regression trends over three different time frames (TF1, TF2, TF3) simultaneously. This means a trader can observe short, medium, and long-term trends on a single chart, which is valuable for understanding overall market direction and making cross-timeframe comparisons.
Linear Regression Bands: For each time frame, the indicator calculates linear regression bands. These bands represent the expected price range based on past prices. The middle line is the linear regression line, and the upper and lower lines are set at a specified deviation from this line. Traders can use these bands to spot potential overbought or oversold conditions, or to anticipate future price movements.
History Bands: Looking at linear regression channels can be deceiving if the user does not understand the calculation. In order to see where the channel was at in history the user can display the history bands to see where price actual was in a non-repainting fashion.
Customization Options: Traders can customize various aspects of the indicator, such as whether to display each time frame, the length of the linear regression (how many past data points it considers), and the deviation for the bands. This flexibility allows traders to adapt the indicator to their specific trading style and the asset they are analyzing.
Alerts: The script includes functionality to set alerts based on the price crossing the upper or lower bands of any time frame. This feature helps traders to be notified of potential trading opportunities or risks without constantly monitoring the chart.
Examples
The 15minute linear regression is overlayed onto a 5 minute chart. We are able to see higher timeframe average and extremes. The average is the middle of the channel and the extremes are the outer edges of the bands. The bands are non-repainting meaning that is the actual value of the channel at that place in time.
Here multiple channels are shown at once. We have a linear regression for the 5, 15, and 60 minute charts. If your strategy uses those timeframes you can see the average and overbought/oversold areas without having to flip through charts.
In this example we show just the history bands. The bands could be thought of as a "don't diddle in the middle" area if your strategy is looking for reversals
You can extend the channel into the future via the various input settings.
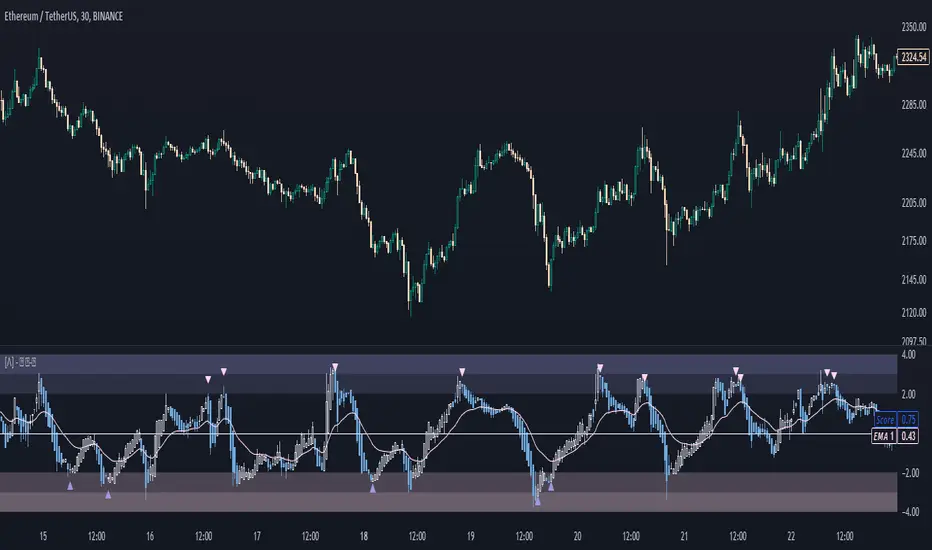
Z-Score - AsymmetrikZ-Score-Asymmetrik User Manual
Introduction
The Z-Score Indicator is a powerful tool used in technical analysis to measure how far a data point is from the mean value of a dataset, measured in terms of standard deviations. This indicator helps traders identify potential overbought or oversold conditions in the market.
This user manual provides a comprehensive guide on how to use the Z-Score Indicator in TradingView.
0. Quickstart
- Set the thresholds based on your asset (number of standard deviations that you consider being extreme for this asset / timeframe).
- Red background indicates a possible overbought situation, green background an oversold one.
- The color and direction of the Z-Score Line acts as a confirmation of the trend reversal.
1. Indicator Overview
The Z-Score Indicator, also known as the Z-Score Oscillator, is designed to display the Z-Score of a selected financial instrument on your TradingView chart. The Z-Score measures how many standard deviations an asset's price is from its mean (average) price over a specified period.
The indicator consists of the following components:
- Z-Score Line: This line represents the Z-Score value and is displayed on the indicator panel.
- Background Color: The background color of the indicator panel changes based on user-defined thresholds.
2. Inputs
The indicator provides several customizable inputs to tailor it to your specific trading preferences:
- Number of Periods: This input allows you to define the number of periods over which the Z-Score will be calculated. A longer period will provide a smoother Z-Score line but may be less responsive to recent price changes.
- Z-Score Low Threshold: Sets the lower threshold value for the Z-Score. When the Z-Score crosses below this threshold, the background color of the indicator panel changes accordingly.
- Z-Score High Threshold: Sets the upper threshold value for the Z-Score. When the Z-Score crosses above this threshold, the background color of the indicator panel changes accordingly.
3. How to Use the Indicator
Here are the steps to use the Z-Score Indicator:
- Adjust Parameters: Modify the indicator's inputs as needed. You can change the number of periods for the Z-Score calculation and set your desired low and high thresholds.
- Interpret the Indicator: Observe the Z-Score line on the indicator panel. It fluctuates above and below zero. Pay attention to the background color changes when the Z-Score crosses your specified thresholds.
4. Interpreting the Indicator
- Z-Score Line: The Z-Score line represents the current Z-Score value. When it is above zero, it suggests that the asset's price is above the mean, indicating potential overvaluation. When below zero, it suggests undervaluation.
- Background Color: The background color of the indicator panel changes based on the Z-Score's position relative to the specified thresholds. Green indicates the Z-Score is below the low threshold (potential undervaluation), while red indicates it is above the high threshold (potential overvaluation).
- Z-Score Line Color: The color of the Z-Score line shows that the Z-Score is trending up compared to its moving average. This can be used as a validation of the background color.
5. Customization Options
You can customize the Z-Score Indicator in the following ways:
- Adjust Inputs: Modify the number of periods and the Z-Score thresholds.
- Change Line and Background Colors: You can customize the colors of the Z-Score line and background by editing the indicator's script.
6. Troubleshooting
If you encounter any issues while using the Z-Score Indicator, make sure to check the following:
- Ensure that the indicator is applied correctly to your chart.
- Verify that the indicator's inputs match your intended settings.
- Contact me for more support if needed
7. Conclusion
The Z-Score Indicator is a valuable tool for traders and investors to identify potential overbought and oversold conditions in the market. By understanding how the Z-Score works and customizing it to your preferences, you can integrate it into your trading strategy to make informed decisions.
Remember that trading involves risk, and it's essential to combine technical indicators like the Z-Score with other analysis methods and risk management strategies for successful trading.

Bias of Volume Share inside Std Deviation ChannelThe "Bias of Volume Share inside STD Deviation Channel" indicator is a powerful tool for traders aiming to assess market sentiment within a standard deviation (STD) price channel. This indicator calculates the bullish or bearish bias by analysing the share of volume within the standard deviation channel and provides valuable insights for decision-making.
Usage:
This indicator is a valuable tool for traders seeking to gain in-depth insights into market sentiment within a specified price channel. By focusing on price movements that fall within the standard distribution range and filtering out noise and market manipulations, it provides a clear view of prevailing bullish or bearish biases. Traders can leverage this information to make well-informed trading decisions that align with current market conditions, enhancing their trading strategies and potential for success.
Please ensure you review and adhere to the terms of the Mozilla Public License 2.0, as outlined in the indicator's source code.

Advanced Weighted Residual Arbitrage AnalyzerThe Advanced Weighted Residual Arbitrage Analyzer is a sophisticated tool designed for traders aiming to exploit price deviations between various asset pairs. By examining the differences in normalized price relations and their weighted residuals, this indicator provides insights into potential arbitrage opportunities in the market.
Key Features:
Multiple Relation Analysis: Analyze up to five different asset relations simultaneously, offering a comprehensive view of potential arbitrage setups.
Normalization Functions: Choose from a variety of normalization techniques like SMA, EMA, WMA, and HMA to ensure accurate comparisons between different price series.
Dynamic Weighting: Residuals are weighted based on their correlation, ensuring that stronger correlations have a more pronounced impact on the analysis. Weighting can be adjusted using several functions including square, sigmoid, and logistic.
Regression Flexibility: Incorporate linear, polynomial, or robust regression to calculate residuals, tailoring the analysis to different market conditions.
Customizable Display: Decide which plots to display for clarity and focus, including normalized relations, weighted residuals, and the difference between the screen relation and the average weighted residual.
Usage Guidelines:
Configure the asset pairs you wish to analyze using the Symbol Relations group in the settings.
Adjust the normalization, volatility, regression, and weighting functions based on your preference and the specific characteristics of the asset pairs.
Monitor the weighted residuals for deviations from the mean. Larger deviations suggest stronger arbitrage opportunities.
Use the difference plot (between the screen relation and average weighted residual) as a quick visual cue for potential trade setups. When this plot deviates significantly from zero, it indicates a possible arbitrage opportunity.
Regularly update and adjust the parameters to account for changing market conditions and ensure the most accurate analysis.
In the Advanced Weighted Residual Arbitrage Analyzer , the value set in Alert Threshold plays a crucial role in delineating a normalized band. This band serves as a guide to identify significant deviations and potential trading opportunities.
When we observe the plots of the green line and the purple line, the Alert Threshold provides a boundary for these plots. The following points explain the significance:
Breach of the Band: When either the green or purple line crosses above or below the Alert Threshold , it indicates a significant deviation from the mean. This breach can be interpreted as a potential trading signal, suggesting a possible arbitrage opportunity.
Convergence to the Mean: If the green line converges with the purple line , it denotes that the price relation has reverted to its mean. This convergence typically suggests that the arbitrage opportunity has been exhausted, and the market dynamics are returning to equilibrium.
Trade Execution: A trader can consider entering a trade when the lines breach the Alert Threshold . The return of the green line to align closely with the purple line can be seen as a signal to exit the trade, capitalizing on the reversion to the mean.
By monitoring these plots in conjunction with the Alert Threshold , traders can gain insights into market imbalances and exploit potential arbitrage opportunities. The convergence and divergence of these lines, relative to the normalized band, serve as valuable visual cues for trade initiation and termination.
When you're analyzing relations between two symbols (for instance, BINANCE:SANDUSDT/BINANCE:NEARUSDT ), you're essentially looking at the price relationship between the two underlying assets. This relationship provides insights into potential imbalances between the assets, which arbitrage traders can exploit.
Breach of the Lower Band: If the purple line touches or crosses below the lower Alert Threshold , it indicates that the first symbol (in our example, SANDUSDT ) is undervalued relative to the second symbol ( NEARUSDT ). In practical terms:
Action: You would consider buying the first symbol ( SANDUSDT ) and selling the second symbol ( NEARUSDT ).
Rationale: The expectation is that the price of the first symbol will rise, or the price of the second symbol will fall, or both, thereby converging back to their historical mean relationship.
Breach of the Upper Band: Conversely, if the difference plot touches or crosses above the upper Alert Threshold , it suggests that the first symbol is overvalued compared to the second. This implies:
Action: You'd consider selling the first symbol ( SANDUSDT ) and buying the second symbol ( NEARUSDT ).
Rationale: The anticipation here is that the price of the first symbol will decrease, or the price of the second will increase, or both, bringing the relationship back to its historical average.
Convergence to the Mean: As mentioned earlier, when the green line aligns closely with the purple line, it's an indication that the assets have returned to their typical price relationship. This serves as a signal for traders to consider closing out their positions, locking in the gains from the arbitrage opportunity.
It's important to note that when you're trading based on symbol relations, you're essentially betting on the relative performance of the two assets. This strategy, often referred to as "pairs trading," seeks to capitalize on price imbalances between related financial instruments. By taking opposing positions in the two symbols, traders aim to profit from the eventual reversion of the price difference to the mean.

Opening Range Gap + Std Dev [starclique]The ICT Opening Range Gap is a concept taught by Inner Circle Trader and is discussed in the videos: 'One Trading Setup For Life' and 2023 ICT Mentorship - Opening Range Gap Repricing Macro
ORGs, or Opening Range Gaps, are gaps that form only on the Regular Trading Hours chart.
The Regular Trading Hours gap occurs between 16:15 PM - 9:29 AM EST (UTC-4)
These times are considered overnight trading, so it is useful to filter the PA (price action) formed there.
The RTH option is only available for futures contracts and continuous futures from CME Group.
To change your chart to RTH, first things first, make sure you’re looking at a futures contract for an asset class, then on the bottom right of your chart, you’ll see ETH (by default) - Click on that, and change it to RTH.
Now your charts are filtering the price action that happened overnight.
To draw out your gap, use the Close of the 4:14 PM candle and the open of the 9:30 AM candle.
How is this concept useful?
Well, It can be used in many ways.
---
How To Use The ORG
One of the ways you can use the opening range gap is simply as support and resistance
If we extend out the ORG from the example above, we can see that there is a clean retest of the opening range gap high after breaking structure to the upside and showing acceptance outside of the gap after consolidating within it.
The ORG High (4:14 Candle Close in this case) was used as support.
We then see an expansion to the upside.
Another way to implement the ORG is by using it as a draw on liquidity (magnet for price)
In this example, if we looked to the left, there was a huge ORG to the downside, leaving a massive gap.
The market will want to rebalance that gap during the regular trading hours.
The market rallies higher, rejects, comes down to clear the current days ORG low, then closes.
That is one example of how you can combine liquidity & ICT market structure concepts with Opening Range Gaps to create a story in the charts.
Now let’s discuss standard deviations.
---
Standard Deviations
Standard Deviations are essentially projection levels for ranges / POIs (Point of Interests)
By this I mean, if you have a range, and you would like to see where it could potentially expand to, you’d place your fibonacci retracement tool on and high and low of the range, then use extension levels to find specific price points where price might reject from.
Since 0 and 1 are your Range High and Low respectively, your projection levels would be something like 1.5, 2, 2.5, and 3, for the extension from your 1 Fib Level, and -0.5, -1, -1.5, and -2 for your 0 Fib level.
The -1 and 2 level produce a 1:1 projection of your range low and high, meaning, if you expect price to expand as much as it did from the range low to range high, then you can project a -1 and 2 on your Fib, and it would show you what ICT calls “symmetrical price”
Now, how are standard deviations relevant here?
Well, if you’ve been paying attention to ICT’s recent videos, you would’ve caught that he’s recently started using Standard Deviation levels on breakers.
So my brain got going while watching his video on ORGs, and I decided to place the fib on the ORG high and low and see what it’d produce.
The results were very interesting.
Using this same example, if we place our fib on the ORG High and Low, and add some projection levels, we can see that we rejected right at the -2 Standard Deviation Level.
---
You can see that I also marked out the EQ (Equilibrium, 50%, 0.5 of Fib) of the ORG. This is because we can use this level as a take profit level if we’re using an old ORG as our draw.
In days like these, where the gap formed was within a consolidation, and it continued to consolidate within the ORG zone that we extended, we can use the EQ in the same way we’d use an EQ for a range.
If it’s showing acceptance above the EQ, we are bullish, and expect the high of the ORG to be tapped, and vice versa.
---
Using The Indicator
Here’s where our indicator comes in play.
To avoid having to do all this work of zooming in and marking out the close and open of the respective ORG candles, we created the Opening Range Gap + Standard Deviations Indicator, with the help of our dedicated Star Clique coder, a1tmaniac.
With the ORG + STD DEV indicator, you will be able to view ORG’s and their projections on the ETH (Electronic Trading Hours) chart.
---
Features
Range Box
- Change the color of your Opening Range Gap to your liking
- Enable or disable the box from appearing using the checkbox
Range Midline
- Change the color of your Opening Range Gap Equilibrium
- Enable or disable the midline from appearing using the checkbox
Std. Dev
- Add whichever standard deviation levels you’d like.
- By default, the indicator comes with 0.5, 1, 1.5, and 2 standard deviation levels.
- Ensure that you add a comma ( , ) in between each standard deviation level
- Enable or disable the standard deviations from appearing using the opacity of the color (change to 0%)
Labels / Offset
- Adjust the offset of the label for the Standard Deviations
- Enable or disable the Labels from appearing using the checkbox
Time
- Adjust the time used for the indicators range
- If you’d like to use this for a Session or ICT Killzone instead, adjust the time
- Adjust the timezone used for the time referenced
- Options are UTC, US (UTC-4, New York Local Time) or UK (UTC+1, London Time)
- By default, the indicator is set to US

Z-Score Heikin-Ashi TransformedThe Z-Score Heikin-Ashi Transformed (𝘡 𝘏-𝘈) indicator is a powerful technical tool that combines the principles of Z-Score and Heikin Ashi to provide traders with a smoothed representation of price movements and a standardized measure of market volatility.
The 𝘡 𝘏-𝘈 indicator applies the Z-Score calculation to price data and then transforms the resulting Z-Scores using the Heikin Ashi technique. Understanding the individual components of Z-Score and Heikin Ashi will provide a foundation for comprehending the methodology and unique features of this indicator.
Z-Score:
Z-Score is a statistical measure that quantifies the distance between a data point and the mean, relative to the standard deviation. It provides a standardized value that allows traders to compare different data points on a common scale. In the context of the 𝘡 𝘏-𝘈 indicator, Z-Score is calculated based on price data, enabling the identification of extreme price movements and the assessment of their significance.
Heikin Ashi:
Heikin Ashi is a popular charting technique that aims to filter out market noise and provide a smoother representation of price trends. It involves calculating each candlestick based on the average of the previous candle's open, close, high, and low prices. This approach results in a chart that reduces the impact of short-term price fluctuations and reveals the underlying trend more clearly.
Methodology:
The 𝘡 𝘏-𝘈 indicator starts by calculating the Z-Score of the price data, which provides a standardized measure of how far each price point deviates from the mean. Next, the resulting Z-Scores are transformed using the Heikin Ashi technique. Each Z-Score value is modified according to the Heikin Ashi formula, which incorporates the average of the previous Heikin Ashi candle's open and close prices. This transformation smooths out the Z-Score values and reduces the impact of short-term price fluctuations, providing a clearer view of market trends.
This tool enables traders to identify significant price movements and assess their relative strength compared to historical data. Positive transformed Z-Scores indicate that prices are above the average, suggesting potential overbought conditions, while negative transformed Z-Scores indicate prices below the average, suggesting potential oversold conditions. Traders can utilize this information to identify potential reversals, confirm trend strength, and generate trading signals.
Utility:
The indicator offers valuable insights into price volatility and trend analysis. By combining the standardized measure of Z-Score with the smoothing effect of Heikin Ashi, traders can make more informed trading decisions and improve their understanding of market dynamics. 𝘡 𝘏-𝘈 can be used in various trading strategies, including identifying overbought or oversold conditions, confirming trend reversals, and establishing entry and exit points.
Note that the 𝘡 𝘏-𝘈 should be used in conjunction with other technical indicators and analysis tools to validate signals and avoid false positives. Additionally, traders are encouraged to conduct thorough backtesting and experimentation with different parameter settings to optimize the effectiveness of the indicator for their specific trading approach.
Key Features:
Optional Reversion Doritos
Adjustable Reversion Threshold
2 Adjustable EMAs
Example Charts:
See Also:
On Balance Volume Heikin-Ashi Transformed
Regularized-Moving-Average Oscillator SuiteThe Regularized-MA Oscillator Suite is a versatile indicator that transforms any moving average into an oscillator. It comprises up to 13 different moving average types, including KAMA, T3, and ALMA. This indicator serves as a valuable tool for both trend following and mean reversion strategies, providing traders and investors with enhanced insights into market dynamics.
Methodology:
The Regularized MA Oscillator Suite calculates the moving average (MA) based on user-defined parameters such as length, moving average type, and custom smoothing factors. It then derives the mean and standard deviation of the MA using a normalized period. Finally, it computes the Z-Score by subtracting the mean from the MA and dividing it by the standard deviation.
KAMA (Kaufman's Adaptive Moving Average):
KAMA is a unique moving average type that dynamically adjusts its smoothing period based on market volatility. It adapts to changing market conditions, providing a smoother response during periods of low volatility and a quicker response during periods of high volatility. This allows traders to capture trends effectively while reducing noise.
T3 (Tillson's Exponential Moving Average):
T3 is an exponential moving average that incorporates additional smoothing techniques to reduce lag and provide a more responsive indicator. It aims to maintain a balance between responsiveness and smoothness, allowing traders to identify trend reversals with greater accuracy.
ALMA (Arnaud Legoux Moving Average):
ALMA is a moving average type that utilizes a combination of linear regression and exponential moving average techniques. It offers a unique way of calculating the moving average by providing a smoother and more accurate representation of price trends. ALMA reduces lag and noise, enabling traders to identify trend changes and potential entry or exit points more effectively.
Z-Score:
The Z-Score calculation in the Regularized-MA Oscillator Suite standardizes the values of the moving average. It measures the deviation of each data point from the mean in terms of standard deviations. By normalizing the moving average through the Z-Score, the indicator enables traders to assess the relative position of price in relation to its mean and volatility. This information can be valuable for identifying overbought and oversold conditions, as well as potential trend reversals.
Utility:
The Regularized-MA Oscillator Suite with its unique moving average types and Z-Score calculation offers traders and investors powerful analytical tools. It can be used for trend following strategies by analyzing the oscillator's position relative to the midline. Traders can also employ it as a mean reversion tool by identifying peak values above user-defined deviations. These features assist in identifying potential entry and exit points, enhancing trading decisions and market analysis.
Key Features:
Variety of 13 MA types.
Potential reversal point bubbles.
Bar coloring methods - Trend (Midline cross), Extremities, Reversions, Slope
Example Charts:

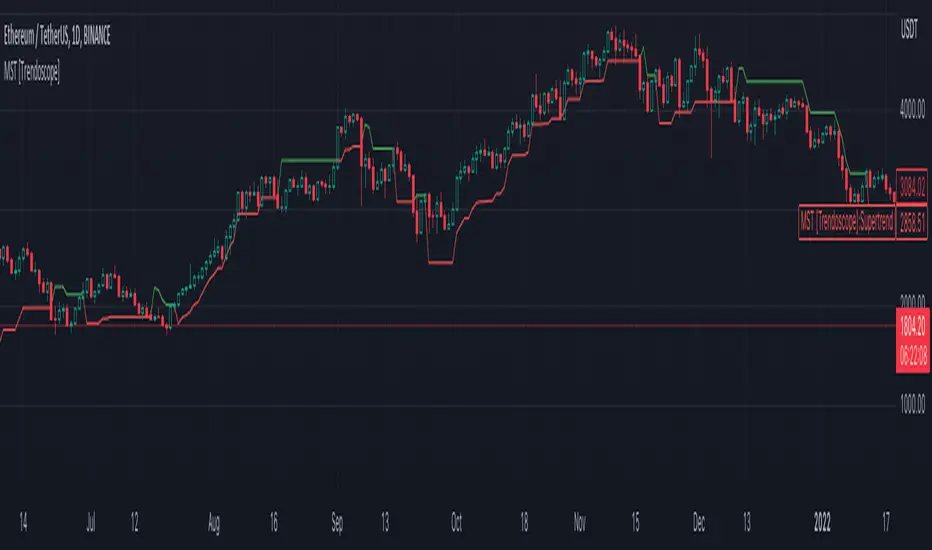
Master Supertrend [Trendoscope]Are you a fan of supertrend? Me too!! Here is a supertrend indicator which provides multiple variation options to chose from.
🎲 Introduction
Supertrend is a popular technical indicator used by traders to identify potential trend reversals and determine entry and exit points in financial markets. It is a trend-following indicator that combines price and volatility to generate its signals. Generally supertrend is calculated based on ATR and multiplier value which is used for calculation of stops. In these adaptions, we look to provide few variations to classical methods.
🎲 Variations
Following variations are provided in the form of settings.
🎯 Range Type
Instead of ATR, different types of ranges can be used for stop calculation. Here is the complete list used in the script.
Plus/Minus Range - Calculates plus range and minus range for each candle and uses them for different sides of stop calculation
Ladder ATR - Based on the existing concept of Ladder ATR defined in Supertrend-Ladder-ATR
True Range - True range derived from standard function ta.tr
Standard Deviation - Standard deviation of close prices
🎯 Applied Calculation
In standard ATR, rma of TR is used for calculations. But, the application calculation provides option to users to use different mechanisms. It can be a type of moving average or few other types of calculations.
Available values are
sma
ema
hma
rma
wma
high
median
medianHigh (Highest of the last N medians)
medianLow (Lowest of the last N medians)
🎯 Other options
Few other options provided are
Use Close Price - If selected stops are calculated based on the close price instead of high/low prices
Wait for Close If selected, change of supertrend direction is calculated based on close price instead of high/low prices
Diminishing Stop Distance - When selected, stop distance for the trend direction can only reduce and cannot increase. This option is useful for keeping the tight stops on strong trends.
🎯 Plus Minus Range
One of the range type used is Plus/Minus Range. What it means and how are these ranges calculated? Let's have a look.
Plus Range is an upward movement of a candle from its last price or open price whichever is lower.
Minus Range is a downward movement of a candle from its last price or open price whichever is higher.
This divides True Range into two separate range for positive and negative side.
Here are the simple settings in nutshell which reflects the same.
L&S Volatility IndexOverview
L&S Volatility Index is a tool designed to helps traders identify overpriced or underpriced moments in the market and adjust their trading strategies accordingly.
Calculations
This tool calculates how far the price is from the 21-period simple moving average as a ratio of the average historical volatility calculated over the last 21 candles.
How It Works
A L&S Volatility Index with a value greater than 30% may indicate that the asset is overpriced or underpriced relative to its average price.
How To Use
If the L&S Volatility Index > 30, the asset is overpriced or underpriced. This means that there is a good probability of initiating a mean reversion.
If the L&S Volatility Index < 30, the asset is in a fair price region. This means that it is acceptable to buy or sell in that price region.
Where To Use
Mean Reversion Strategy
Breakout Strategy
What Makes it Original
There is already an indicator that use a normalized calculation and a different approach to calculate historical volatility, whereas this script calculation is non-normalized and historical volatility is calculated using Don Fishback's formula. All calculations are used as originally described.
Credits
The L&S Volatility Index indicator was originally written by L&S Educação Financeira.
Historical Volatility calculation is based on the book "Odds: The Key to 90% Winners" written by Don Fishback.

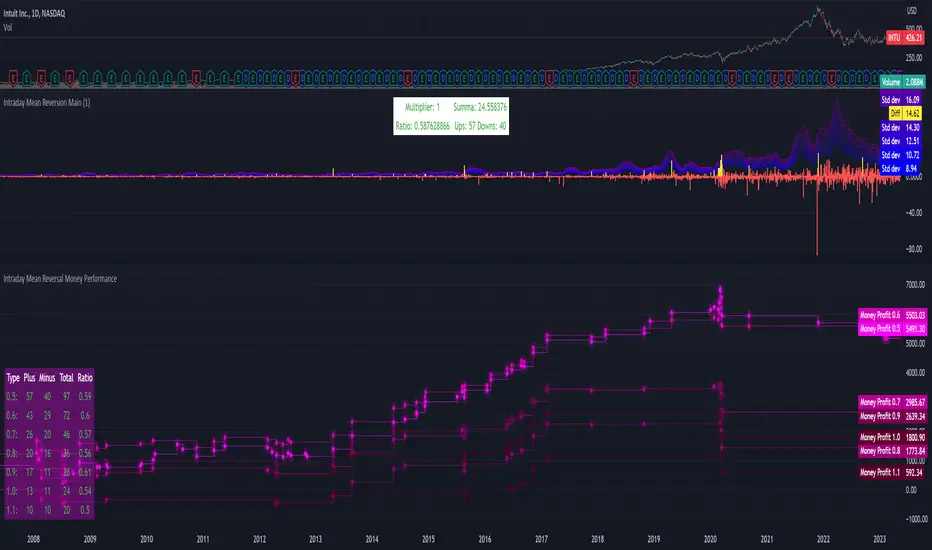
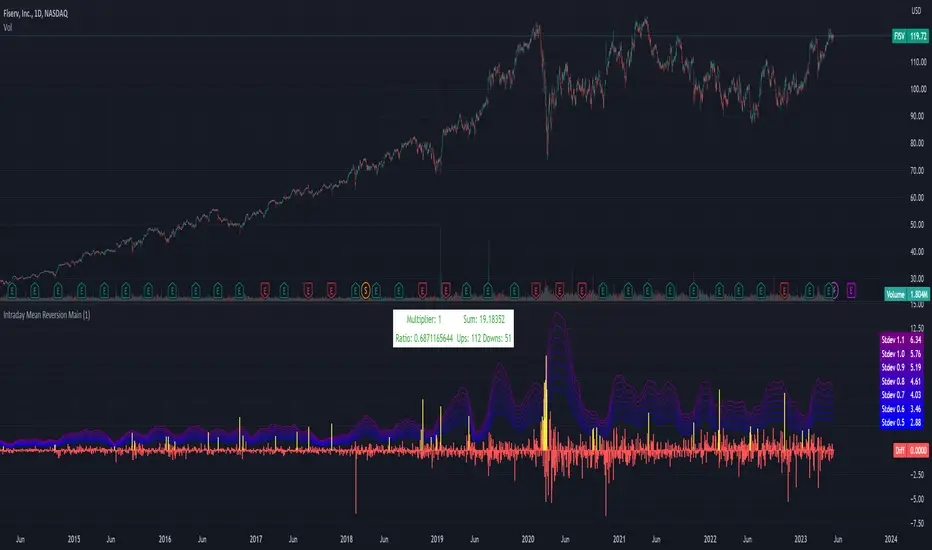
Intraday Mean Reversion Money Performance indicatorThe diagram shows Money Performance when buying stocks for 10 000 at every buy signal from the Intraday Mean Reversion indicator.
The indicator is best used in combination with Intraday Mean Reversion Main Indicator
The rules for trading are: Buy on Open price if the Intraday Mean Reversion Main indicator gives a buy signal. Sell on the daily close price.
According to my knowledge it is not possible to create a PineScript strategy based on these rules, because the indicator is used on Day to Day graph. Therefore this indicator can be used to analyze Money performance of this strategy.
The lines show the performance of the Intraday Mean Reversion Strategy, based on the different levels in the strategy (from 0.5 Standard deviation to 1.1 standard deviation)
Using this indicator it is possible to find stocks that often reverse towards mean after open.
Use this strategy on stocks with high positive performance. Do not use on stocks with negative performance.
Intraday Mean Reversion MainThe Intraday Mean Reversion Indicator works well on certain stocks. It should be used for day trading stocks but need to be applied on the Day to Day timeframe.
The logic behind the indicator is that stocks that opens substantially lower than yesterdays close, very often bounces back during the day and closes higher than the open price, thus the name Intraday Mean reversal. The stock so to speak, reverses to the mean.
The indicator has 7 levels to choose from:
0.5 * standard deviation
0.6 * standard deviation
0.7 * standard deviation
0.8 * standard deviation
0.9 * standard deviation
1.0 * standard deviation
1.1 * standard deviation
The script can easily be modified to test other levels as well, but according to my experience these levels work the best.
The info box shows the performance of one of these levels, chosen by the user.
Every Yellow bar in the graph shows a buy signal. That is: The stocks open is substantially lower (0.5 - 1.1 standard deviations) than yesterdays close. This means we have a buy signal.
The Multiplier shows which multiplier is chosen, the sum shows the profit following the strategy if ONE stock is bought on every buy signal. The Ratio shows the ratio between winning and losing trades if we followed the strategy historically.
We want to find stocks that have a high ratio and a positive sum. That is More Ups than downs. A ratio over 0.5 is good, but of course we want a margin of safety so, 0.75 is a better choice but harder to find.
If we find a stock that meets our criteria then the strategy will be to buy as early as possible on the open, and sell as close as possible on the close!
Z-Score(Slope(OBV(LBC)))Summary : Market price is simply a dance of liquidity to the specific market.
tl;dr: "Cash come-in, market moon; Cash go-out, market doom"
In Simple Language : Large changes in the money flow to an asset often mark local price extremia.
Academic paper:
Title: Z-Score(Slope(OBV)): An Efficient Indicator for Identifying Local Extremes in Asset Prices
Abstract: This paper presents a novel trading indicator, Z-Score(Slope(OBV)), that aims to predict local extremes in asset prices by analyzing the patterns of money flow. The indicator is constructed using the Z-score of the slope of the On Balance Volume (OBV).
Hypothesis: The price levels at which the money flows into and out of an asset often mark local extremes. This notion underpins our exploration of the Z-Score(Slope(OBV)) indicator's potential in identifying these critical points.
1. On Balance Volume (OBV): The OBV is a momentum indicator that leverages the volume flow to forecast potential changes in asset prices. It operates on the premise that changes in volume often presage shifts in price. The OBV algorithm adds a period's volume to the cumulative total when the closing price is up and subtracts it when the closing price is down. Therefore, an ascending OBV suggests positive volume pressure, potentially heralding higher prices, while a declining OBV signifies negative volume pressure, possibly indicating lower prices.
2. Slope: In this context, the slope represents the rate of change of the OBV. It is a measure of the rise-over-run for a linear regression line through the OBV data points. By evaluating the slope of the OBV, we can extract valuable insights into the momentum of the volume. A positive slope indicates increasing volume momentum, suggesting growing interest in the asset, while a negative slope implies declining volume momentum, potentially reflecting dwindling interest.
3. Z-Score: The Z-score is a statistical measure that delineates a data point's relationship to the mean of a group of values, expressed in terms of standard deviations from the mean. For instance, a Z-score of 0 reveals that the data point's score aligns with the mean score. Positive Z-scores indicate values higher than the mean, and negative Z-scores represent values lower than the mean. Applying the Z-score to the slope of the OBV allows us to comprehend the degree of deviation of the current OBV slope from its historical mean.
A Z-score of 1 suggests that the OBV's slope is one standard deviation from the mean, which implies that the slope is within the range of values where approximately 68% (not 67%) of all values lie.
A Z-score of 2 implies that the slope is two standard deviations from the mean, thus within the range where roughly 95% of all values lie.
A Z-score of 3 indicates that the slope is three standard deviations from the mean, putting it within the range where about 99.7% of all values lie.
Z-scores of 4 and 5 and beyond are increasingly rare and represent extreme values.
4. The Z-Score(Slope(OBV)) Indicator and Line Break Chart Synergy: The Z-Score(Slope(OBV)) indicator's efficiency is further amplified when visualized using a Line Break chart. This chart type disregards time, concentrating solely on price changes, thus providing a clear visualization of market trends. When combined with the Line Break chart, the Z-Score(Slope(OBV(LBC))) indicator can help traders identify trend shifts more accurately and promptly, reinforcing the hypothesis that price levels where money flows into and out of an asset often mark local extremes.
In summary, the Z-Score(Slope(OBV)) indicator, combining volume, momentum, and statistical analysis, provides a robust tool for traders to predict local extremes in asset prices.
Regarding Implementation:
- This is implemented using Pinescript V5
- Uses inbuilt ta module
- Very effective and simple and efficient computation in 30 lines of code

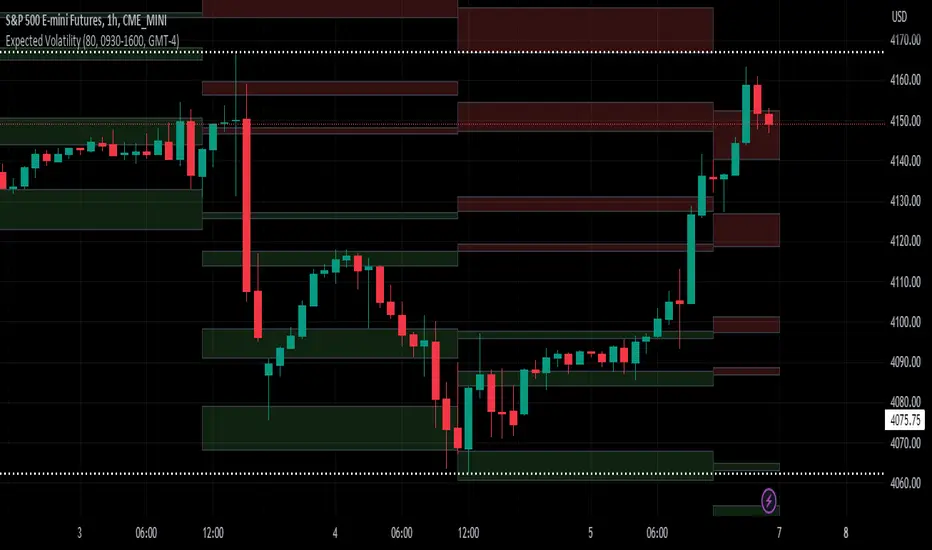
Expected VolatilityExpected Volatility
Hello and welcome to my first indicator! I'm publishing this indicator as free to use and modify because I think it's a great place to learn and I hope I can teach you something.
There are some terms which you need to understand before I begin explaining this indicator and what it does for you:
Daily Settlement - The price at which a market closes when the trading day closes (RTH or Regular Trading Hours close)
Standard Deviation - A measure in statistics that declares how far away a data point is from the mean when compared with all the data points before it to an extent
Now for the history behind this indicator:
Rule of 16. This goes back to the VIX, or S&P 500 volatility index. The idea behind the volatility index is to determine what magnitude of movement could be expected from the market the following day based on recent movement. The rule of 16 is an easier way to refer to the square root of the number of trading days in a year. There are 252 trading days in a year and the square root of 252 is approximately 15.87. We estimate it to be 16 because it's easier to talk about when it's easier to say and therefore easier to remember.
The relevance of this rule is that when the VIX is at 16, we can expect a market movement of 1% or so unless some special circumstances overrule this estimate. To get the expected market movement, we take 16 and divide by 16 and get 1, or 1%. If the VIX is trading at 24, we get 24/16 or 1.5 which is 1.5% movement. This indicator seeks to simplify the math and lay it out in a visual way to show the highest probability of range the market is expected to trade.
Thanks for taking the time to read my description, I hope you like my indicator.
Special thanks to my trading friends and coaches for helping me complete this indicator.
Deviations from ARL (DARL)Similar to Bollinger Bands, this indicator uses standard deviations but from Adaptive Rebound Lines (See: 'ARL').
The adaptiveness of the 'ARL' is further affected by volatility and helps greatly in spotting the possible strength and direction of rebounds.
All this information is presented with minimal lag thanks to the rebound qualities of the 'ARL' adapting to market volatility.
----- HOW TO USE IT -----
1) Use with 1h time frame.
2) Smaller width typically means that price will be moving is smaller movements.
3) Small price movements while the width is increasing typically means that a large price move will occur soon.
4) Larger width typically means that price will be moving in larger movements.
5) Very large width with sideways price typically means that the price will have a bias towards the center.
Note: A V-Offset of 1 is also a good setting alternative for this indicator.
----- HOW THIS INDICATOR IS ORIGINAL; WHAT IT DOES AND HOW IT DOES IT -----
This indicator has an original, unique ability in anticipating the strength and direction of a price rebound while at the same time showing the bias of the rebound with minimal lag.
It does this by letting the adaptive qualities of the 'ARL' be affected by market volatility, not just by price movement alone.
----- VERSION -----
This indicator is not a variation, replacement, or presentation of the 'ARL' or the 'ARL' Bands -- it merely derives its base calculations for standard deviations from the 'ARL'.
However, this indicator affects the calculations of the standard 'ARL' with volatility and creates a new, unique calculation.
It thus presents a totally different context for price action.
A standard 'ARL' helps in finding possible rebounds but it does not help in finding the strength of them or the directional bias of a rebound.
This is because a standard 'ARL' is more negligent of market volatility and adapts to price movement alone.
In contrast, this indicator does help in anticipating the strength and direction of the rebound because it adapts deviations from an 'ARL' to market volatility.
Therefore, the lines cannot be adjusted individually but in pairs and only further from their respective, mirroring lines.

Ladder StDevThis indicator shows the upwards (green) and downward (red) volatility of the market. It is a standard deviation of the price but with a twist! For the upwards volatility , only the green candles are taken into account, and for the downwards only the red candles are.
Compared to my previous "Ladder ATR" indicator this a different approach to measure the the upwards and downwards volatility of the market by utilizing the standard deviation instead of the ATR. When both measure the volatility they have different "dynamics". Standard deviation increases the weight of larger values over smaller values. The ATR indicator is based on the average of absolute changes. So, if we apply the indicators on a daily chart , ATR considers intraday and between-day data, while the standard deviation calculation includes only daily returns (source price).
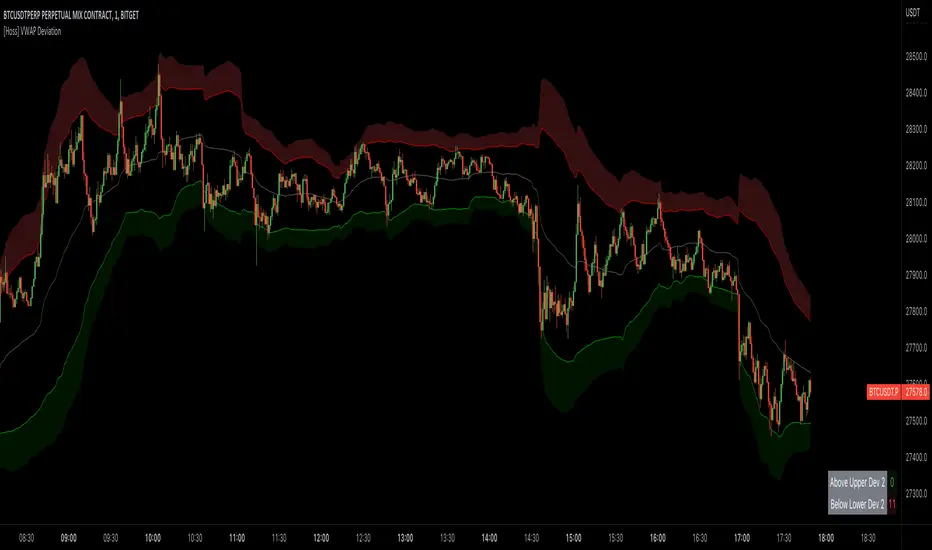
[Hoss] VWAP ADThe VWAP ( Volume Weighted Average Price ) Deviation script is a powerful tool designed for traders to analyze the relationship between price and volume . By calculating deviations around the VWAP , the script allows users to identify key support and resistance levels that can help in making better-informed trading decisions.
The script calculates VWAP based on the chosen data source (default is closing price) and then computes deviations above and below the VWAP using either the Average Deviation or the Standard Deviation method. The user can select the desired method through the script's input options. These deviations are then plotted as bands on the chart, providing a visual representation of the areas where the price may potentially revert or experience a breakout.
A unique and valuable feature of this script is the addition of a monitor that counts the number of times the price crosses above the Upper Deviation level 2 and below the Lower Deviation level 2 within a user-defined lookback period. This monitor is displayed as a table in the bottom right corner of the chart and can be enabled or disabled through an input option.
The cross count monitor serves as a valuable aid to traders by providing insights into the historical frequency of price crossing the deviation levels. This information can be used to identify potential trading opportunities based on historical price behavior around these levels.
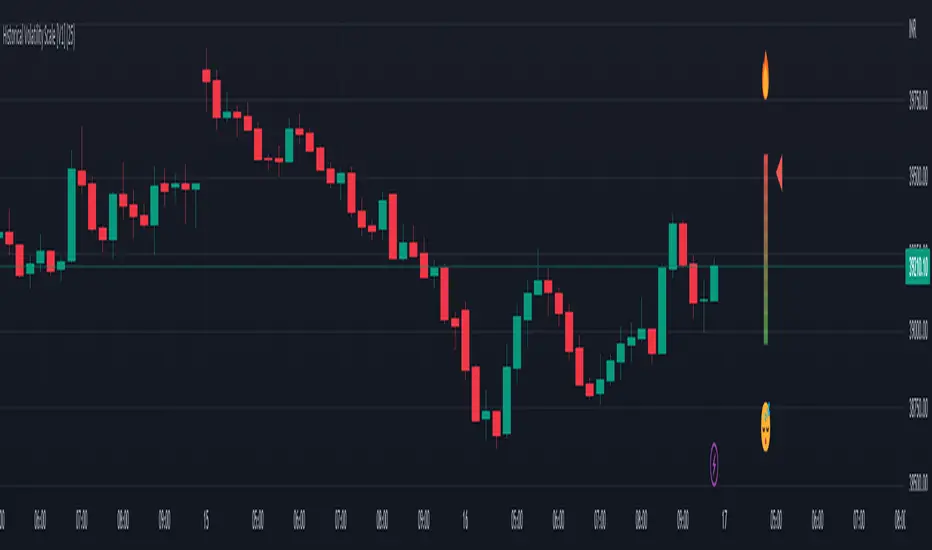
Historical Volatility Scale [ChartPrime]This indicator outputs a visual scale representing the level of volatility in the market relative to the timeframe selected on the users chart. The method of volatility used is "historical volatility" which is calculated by taking the standard deviation of a series of "x" length which contains the current closing price divided by the previous closing price for all nodes. The output of the volatility is standardized by also running an additional percentrank calculation over the raw volatility values to allow the volatility scale to oscillate properly between its minimum of 0 and maximum of 100.
📗 SETTINGS
Length: The length determines how many bars/nodes should be considered when calculating the standard deviation. In simple terms, the higher the length, the less sensitive and less reactive the scale will be to current price action, and larger moves would be required to trigger the scale.
🧰 UTILITY
The arrow or "The Pin" will move upwards towards the "fire" emoji when the volatility is higher than the majority of values for the amount of bars back that you set the "length" setting to. Vise Versa for when the pin is lowering towards the "snooze" emoji, the volatility is less than the majority of nodes/values for the past "length" amount of values.
When the volatility is low, a trader could consider utilizing more leading indicators to make their trading decisions as opposed to lagging indicator such as trend indicators. When the volatility is low, the price action is consolidation which would be bad for a trend following strategy. Vise Versa for trend strategies, having a higher volatility may be better for such strategies.
Its important to remember that this indicator itself is a lagging indicator, in that it relies on historical data to showcase the current state of the markets volatility. This means that although the recommendation in the previous paragraph may make logical sense, it is not a guarantee that if the volatility is showcasing a trending market, that your trend strategies will necessarily be profitable.
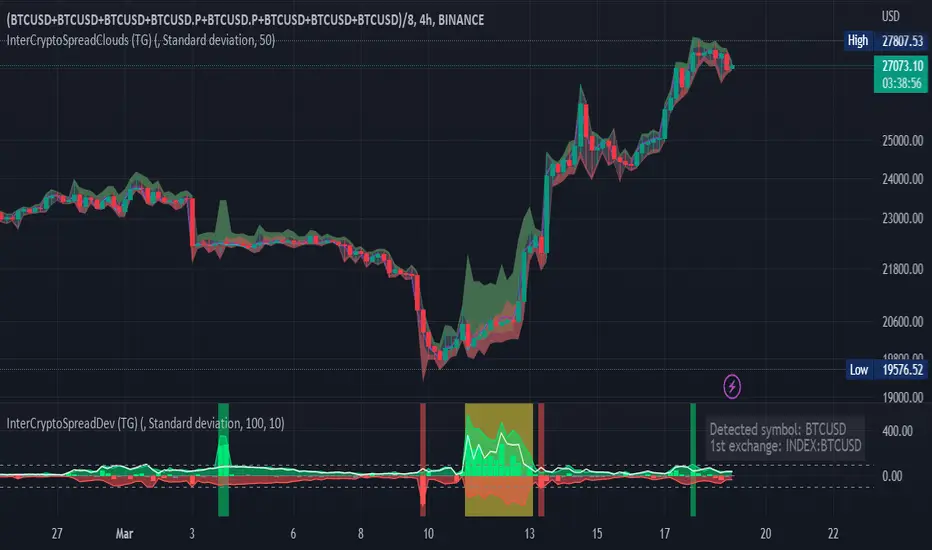
Inter-Exchanges Crypto Price Spread Deviation (Tartigradia)Measures the deviation of price metrics between various exchanges. It's a kind of realized volatility indicator, as the idea is that in times of high volatility (high emotions, fear, uncertainty), it's more likely that market inefficiencies will appear for the same asset between different market makers, ie, the price can temporarily differ a lot. This indicator will catch these instants of high differences between exchanges, even if they lasted only an instant (because we use high and low values).
Both standard deviation and median absolute deviation (more robust to outliers, ie, exchanges with a very different price from others won't influence the median absolute deviation, but the standard deviation yes).
Compared to other inter-exchanges spread indicators, this one offers two major features:
* The symbol automatically adapts to the symbol currently selected in user's chart. Hence, switching between tickers does not require the user to modify any option, everything is dynamically updated behind the scenes.
* It's easy to add more exchanges (requires some code editing because PineScript v5 does not allow dynamical request.security() calls).
Limitations/things to know:
* History is limited to what the ticker itself display. Ie, even if the exchanges specified in this indicator have more data than the ticker currently displayed in the user's chart, the indicator will show only a timeperiod as long as the chart.
* The indicator can manage multiple exchanges of different historical length (ie, some exchanges having more data going way earlier in the past than others), in which case they will simply be ignored from calculations when far back in the past. Hence, you should be aware that the further you go in the past, the less exchanges will have such data, and hence the less accurate the measures will be (because the deviation will be calculated from less sources than more recent bars). This is thanks to how the array.* math functions behave in case of na values, they simply skip them from calculations, contrary to math.* functions.
Weighted Deviation Bands [Loxx]What are Weighted Deviation Bands?
Variation of the Bollinger bands but it uses linear weighted average and weighted deviation via Mladen Rakic.
What is Weighted Deviation?
This weighted deviation is a sort of all linear weighted deviation. It uses linear weighting in all the steps calculated (which makes it different from the built in deviation in a case when linear weighted ma is used in the ma method). It is more responsive than the standard deviation
Included
Bar coloring

Fibonacci Volatility BandsFibonacci Volatility Bands are just an alternative that allows for more margin than regular Bollinger Bands. They are created based on an average of moving averages that use the Fibonacci sequence as lookback periods.
The use of the Fibonacci Volatility Bands is exactly the same as the Bollinger Bands.

DEVIATION OF THE STOCHASTIC INDICATORThis new technical indicator uses the stochastic oscillator as its base and calculates the deviation of its moving average, generating an alternative view of market volatility.

Fair value bands / quantifytools— Overview
Fair value bands, like other band tools, depict dynamic points in price where price behaviour is normal or abnormal, i.e. trading at/around mean (price at fair value) or deviating from mean (price outside fair value). Unlike constantly readjusting standard deviation based bands, fair value bands are designed to be smooth and constant, based on typical historical deviations. The script calculates pivots that take place above/below fair value basis and forms median deviation bands based on this information. These points are then multiplied up to 3, representing more extreme deviations.
By default, the script uses OHLC4 and SMA 20 as basis for the bands. Users can form their preferred fair value basis using following options:
Price source
- Standard OHLC values
- HL2 (High + low / 2)
- OHLC4 (Open + high + low + close / 4)
- HLC3 (High + low + close / 3)
- HLCC4 (High + low + close + close / 4)
Smoothing
- SMA
- EMA
- HMA
- RMA
- WMA
- VWMA
- Median
Once fair value basis is established, some additional customization options can be employed:
Trend mode
Direction based
Cross based
Trend modes affect fair value basis color that indicates trend direction. Direction based trend considers only the direction of the defined fair value basis, i.e. pointing up is considered an uptrend, vice versa for downtrend. Cross based trends activate when selected source (same options as price source) crosses fair value basis. These sources can be set individually for uptrend/downtrend cross conditions. By default, the script uses cross based trend mode with low and high as sources.
Cross based (downtrend not triggered) vs. direction based (downtrend triggered):
Threshold band
Threshold band is calculated using typical deviations when price is trading at fair value basis. In other words, a little bit of "wiggle room" is added around the mean based on expected deviation. This feature is useful for cross based trends, as it allows filtering insignificant crosses that are more likely just noise. By default, threshold band is calculated based on 1x median deviation from mean. Users can increase/decrease threshold band width via input menu for more/less noise filtering, e.g. 2x threshold band width would require price to cross wiggle room that is 2x wider than typical, 0x erases threshold band altogether.
Deviation bands
Width of deviation bands by default is based on 1x median deviations and can be increased/decreased in a similar manner to threshold bands.
Each combination of customization options produces varying behaviour in the bands. To measure the behaviour and finding fairest representation of fair and unfair value, some data is gathered.
— Fair value metrics
Space between each band is considered a lot, named +3, +2, +1, -1, -2, -3. For each lot, time spent and volume relative to volume moving average (SMA 20) is recorded each time price is trading in a given lot:
Depending on the asset, timeframe and chosen fair value basis, shape of the distributions vary. However, practically always time is distributed in a normal bell curve shape, being highest at lots +1 to -1, gradually decreasing the further price is from the mean. This is hardly surprising, but it allows accurately determining dynamic areas of normal and abnormal price behaviour (i.e. low risk area between +1 and -1, high risk area between +-2 to +-3). Volume on the other hand is typically distributed the other way around, being lowest at lots +1 to -1 and highest at +-2 to +-3. When time and volume are distributed like so, we can conclude that 1) price being outside fair value is a rare event and 2) the more price is outside fair value, the more anomaly behaviour in volume we tend to find.
Viewing metric calculations
Metric calculation highlights can be enabled from the input menu, resulting in a lot based coloring and visibility of each lot counter (time, cumulative relative volume and average relative volume) in data window:
— Alerts
Available alerts are the following:
Individual
- High crossing deviation band (bands +1 to +3 )
- Low crossing deviation band (bands -1 to -3 )
- Low at threshold band in an uptrend
- High at threshold band in a downtrend
- New uptrend
- New downtrend
Grouped
- New uptrend or downtrend
- Deviation band cross (+1 or -1)
- Deviation band cross (+2 or -2)
- Deviation band cross (+3 or -3)
— Practical guide
Example #1 : Risk on/risk off trend following
Ideal trend stays inside fair value and provides sufficient cool offs between the moves. When this is the case, fair value bands can be used for sensible entry/exit levels within the trend.
Example #2 : Mean reversions
When price shows exuberance into an extreme deviation, followed by a stall and signs of exhaustion (wicks), an opportunity for mean reversion emerges. The higher the deviation, the more volatility in the move, the more signalling of exhaustion, the better.
Example #3 : Tweaking bands for desired behaviour
The faster the length of fair value basis, the more momentum price needs to hit extreme deviation levels, as bands too are moving faster alongside price. Decreasing fair value basis length typically leads to more quick and aggressive deviations and less steady trends outside fair value.
