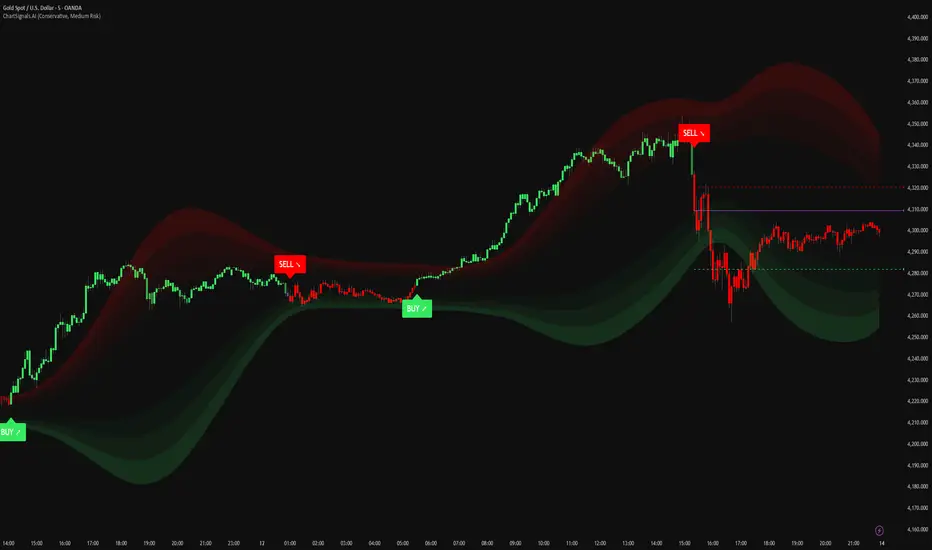
ChartSignals.AIChartSignals.AI is an overlay indicator designed to simplify chart reading by highlighting potential trade opportunities and providing optional visual context tools.
WHAT YOU’LL SEE
• Buy/Sell signals displayed directly on the chart
• Optional trade level guides (Entry / Take Profit / Stop Loss) to help structure a plan
• Optional trend and zone overlays to help interpret market conditions
• Optional key levels and breakout markers for additional context
• Dynamic candle coloring to help visualize momentum vs. quieter conditions
HOW TO USE (SIMPLE)
• Add ChartSignals.AI to your chart
• Choose a Signal Mode (controls how frequently signals appear)
• Enable/disable the optional overlays you want
• Use signals as chart assistance and confirm with your own analysis and risk management
ALERTS
This script includes alert conditions for:
• Buy, Sell, general signal notifications, and key level break events (when enabled).
DISCLAIMER
For educational and charting purposes only. Not financial advice. Trading involves risk and you are responsible for your own decisions.
Трендовый анализ
First 5-Min Candle DetectorHighlights the high and low of the first 5-minute candle of the regular trading session, beginning at 9:30am EST.

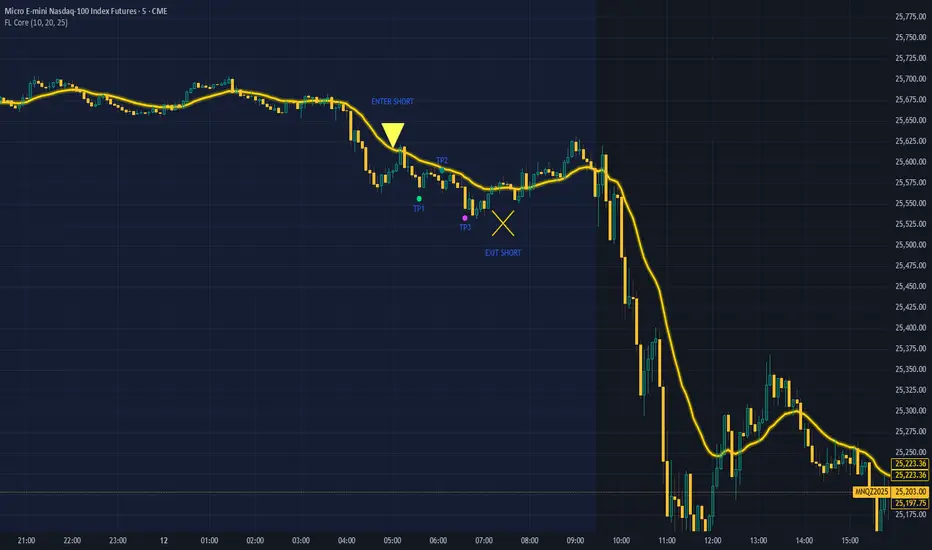
FL Core Signals Only FL Core shows only what matters: where to enter, where to exit, and where prof
No indicator noise — just confirmed decision points on a clean chart.
Designed for traders who value structure, patience, and clarity.
What FL Core Does
FL Core marks:
ENTER LONG
ENTER SHORT
AND
EXIT SHORT
TP1 / TP2 / TP3 profit targets
All signals are generated using a fixed, non-repainting ruleset and are confirmed only after candle close.
How It Trades (High Level)
Identifies momentum shifts using internal trend logic
Requires a full candle confirmation before signaling entries
Holds trades until momentum breaks, then signals exit
Tracks profit targets automatically in points
No guessing. No anticipation. No repainting.
Session Rules
FL Core is hard-wired to operate only between 4:00 AM and 4:00 PM (exchange time).
Signals outside of this window are intentionally ignored to avoid low-liquidity and overnight conditions.
Chart Design Philosophy
This version intentionally hides all underlying indicators and displays only:
Clean entry markers
Clean exit markers
Profit plate
A single gold Exit Rail that visually guides trade management
The focus stays on execution and decision-making, not indicator interpretation.
Profit Targets
Default profit targets are:
TP1: 25 points
TP2: 40 points
TP3: 60 p
Targets can be adjusted by the user.
Note: Default profit targets are optimized for NQ/MNQ, which was the primary instrument used during testing.
Traders using ES/MES should reduce target distances to better match volatility.
Important Notes
FL Core is an indicator, not an automated trading system
Stop-loss placement is handled manually according to your trading plan
Signals are designed to encourage discipline and patience, not over-trading
Marker placement (above/below bar) is intentional and should not be changed
Who This Is For
✔ Beginner traders
✔ Traders overwhelmed by indicators
✔ Traders who want clear structure and rules
✔ Traders focused on execution discipline
Who This Is NOT For
✘ Traders looking for fully automated execution
✘ Traders who want constant signals
✘ Traders who ignore risk management
Final Thought
FL Core does not try to predict the market.
It helps you wait for confirmation, execute cleanly, and manage trades with structure.
If you want fewer decisions, clearer trades, and a calmer trading experience — this is where you start.
FTL Context Teaser - PublicFTL Context (Teaser) – Public
FTL Context (Teaser) is a visual market context layer designed to highlight periods of increased market risk and structural tension.
This script does NOT provide trading signals and is NOT intended for standalone trading decisions.
It serves as a contextual overlay only, helping traders visually identify when market conditions shift away from equilibrium.
The teaser version is intentionally limited and does not expose the underlying logic or decision framework.
Full functionality, advanced filters, and integrated decision logic are available in the invite-only FTL Context Layer (PRO).
📩 Contact / PRO access:
fairtradinglab@gmail.com
Educational & informational use only.

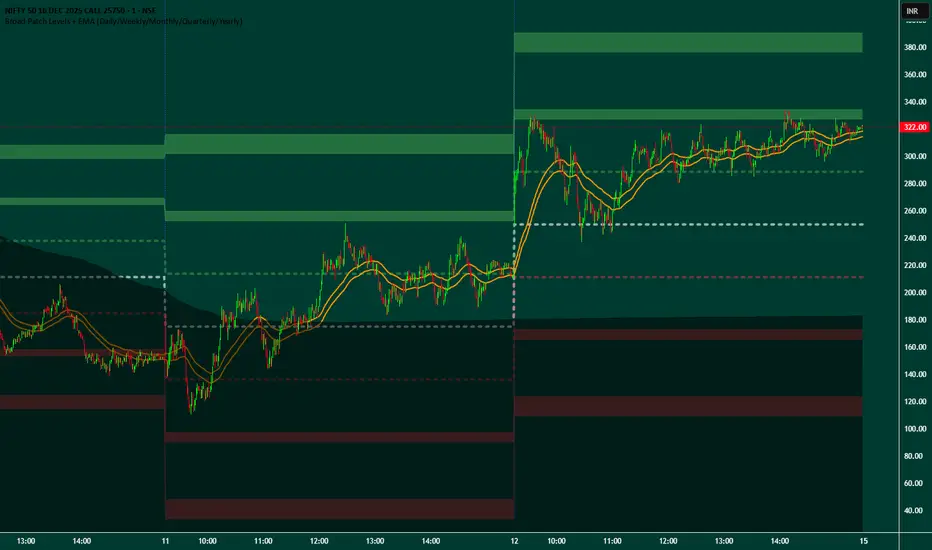
Broad Patch Levels + EMA (Daily/Weekly) with Directional AlertsThis indicator provides dynamic support and resistance levels along with trend guidance using EMA lines for daily or weekly timeframes. It is fully customizable, offering toggles for individual levels, trend lines, and alert notifications.
Key highlights:
Clearly visualize key market levels for potential trade entries and exits.
Monitor trend direction with EMA-based guidance.
Receive alerts when price interacts with important levels or trend zones.
Configurable visibility and alert options for a clean and personalized chart layout.
Ideal for professional traders looking for a structured, easy-to-read market perspective without exposing proprietary methods or calculations.
BIGG CHIEFF RWB MASTER v2.0 (Indicator) [v1.0]Here is a **clean, professional TradingView indicator description** you can paste directly into the script description. It explains the *logic and philosophy* without exposing proprietary specifics, while still sounding robust and credible.
---
## 📊 Indicator Overview
This indicator is a **rule-based EMA crossover strategy built on price action, opening range structure, directional bias, and momentum confirmation**.
It is designed for intraday trading during the New York session and adapts to both time-based and tick-based charts.
The system focuses on **clarity, patience, and consistency**, filtering out low-quality conditions while aligning trades with higher-probability market structure.
---
## 🧭 Core Concepts
### Opening Range Structure
* The strategy uses the **first 15 minutes of the New York session** to define an Opening Range.
* This range establishes **key intraday structure**, including:
* High
* Low
* Midpoint
* The Opening Range remains visible for the entire session and resets each day.
* Trades are framed around **breaks, retests, and rejections** of this structure.
---
## 📈 Trend, Bias & Momentum
### Directional Bias
Bias is determined by:
* **EMA stacking order**
* **Price location relative to the Opening Range**
* Optional **higher-timeframe trend alignment**
Once bias is confirmed:
* Trades are only taken **in the direction of that bias**
* Opposing trades are locked out until structure meaningfully changes
This prevents overtrading and reduces whipsaws in choppy conditions.
---
### Higher-Timeframe Alignment (Optional)
A higher-timeframe trend filter can be enabled to:
* Keep trades aligned with the broader market direction
* Improve win rate during trending sessions
* Reduce countertrend entries
---
## ⚡ Volatility & Time Filters
To avoid low-quality trades, the system includes:
* **Volatility filtering** to prevent entries during compressed or dead markets
* **Session time windows** to focus on the most liquid trading hours
* Optional **no-trade time blocks** for news or known high-risk periods
---
## 💧 Liquidity Awareness
The indicator accounts for **key liquidity zones**, such as:
* Prior session highs and lows
* Overnight and premarket extremes
Trades are filtered to ensure there is **sufficient room for reward** before running into nearby liquidity, helping avoid premature exits.
---
## ✅ Entry Logic (Primary Mode)
Trades are based on **structure first, confirmation second**:
* Breakouts must be confirmed by **candle closes**, not wicks
* Entries occur on **retracements and rejection candles**, not chase candles
* Priority is given to cleaner retests closer to structure
* Optional controls allow limiting trades to **first-touch setups only**
This encourages patience and avoids emotional entries.
---
## 🛑 Risk Management & Trade Management
The system is built around **R-multiple consistency**, not fixed targets.
* Stops are volatility-based
* Multiple profit targets can be enabled
* Optional partial profits and trailing stop logic are included
* Trailing behavior can follow momentum or structure once price moves favorably
Everything is designed to **protect capital first and scale winners second**.
---
## 🧠 Philosophy
This indicator is not designed to predict the market.
It is designed to **react intelligently** to what price is already confirming.
It prioritizes:
* Structure over indicators
* Bias over impulse
* Confirmation over hope
* Risk management over win rate
Best results come from disciplined execution, patience, and respecting the filters.

Reversal Buy and Sell SignalsThis indicator is fast and minimalistic reversal-detection indicator designed to capture high-probability turning points in the market. It combines engulfing candlestick patterns, a strong candle body filter, and RSI momentum analysis to generate precise BUY and SELL signals with minimal noise.

Index & Stock Options Reference Tool-(ISORT) [Arjo]The Index & Stock Options Reference Tool-(ISORT) is an indicator that helps users observe price trend direction together with commonly used option strike levels for selected indices and stocks in Indian market .
The indicator integrates a smoothed trend framework with structured option-related data to help users observe how price direction aligns with commonly referenced option strike levels .
It does not generate trading signals, does not provide buy or sell recommendations, and does not evaluate profitability .
Key Features
1. Trend Context Engine
Uses a Super-Smoother filter combined with EMA smoothing
Highlights directional context through color-based trend states
Designed to reduce short-term noise
2. Dynamic ATM & Strike Reference
Automatically computes ATM strike and offset strike levels to select OTM strike
Strike intervals adapt to the selected index or stock
Supports both NSE and BSE instruments, including SENSEX
3. Expiry Awareness
User-selectable expiry date inputs
Displays a visual warning if the selected expiry has already passed
Helps avoid referencing outdated option contracts
4. Option Price Reference Panel
Displays last observed CALL and PUT prices (when available)
Allows optional manual entry values for analytical comparison
All price values are shown strictly as references
5. Informational Table Overlay
Customizable on-chart table layout
Displays strike, timestamp, price reference, and arithmetic P&L values
Table values are informational only, not predictive or advisory
How to Use
1. Select the Underlying Instrument
Choose whether to reference the current chart symbol or a custom index/stock from the input settings
Supported instruments include major NSE indices, selected stocks, and SENSEX
2. Configure Expiry Parameters
Enter the option expiry date using the Day, Month, and Year inputs
If an expired date is selected, the indicator will display a visual warning
This helps ensure option references remain time-relevant
3. Observe Trend Context
The smoothed trend line provides directional context only
Color changes reflect shifts in price structure, not trade instructions
This trend is intended for contextual analysis, not timing entries
4. Review Strike References
The indicator automatically calculates ATM and offset strike levels
Strike spacing adjusts based on the selected index or stock
These values serve as reference levels commonly observed in options markets
5. Interpret the Information Table
The on-chart table displays:
Strike level
Timestamp of the most recent context change
Last observed option price (when available)
Arithmetic price difference values
All values are informational references only and do not represent performance or outcomes
6. Optional Manual Inputs
Manual price fields can be used to compare external reference values
These inputs do not trigger signals or automated calculations
Important Notes
This indicator is not a trading system
It does not generate buy or sell signals
It does not provide financial or trading advice
It is intended for learning, observation, and market study
Disclaimer
This script is provided for educational and analytical purposes only. It does not constitute investment advice, trading advice. The author assumes no responsibility for decisions made using this indicator.
Happy Trading (Arjo)

Range Strategy (kasatura84)Winning Range Strategy (Set Heikin Ashi Candles)
Incredible winning strategy. You have to set Heikin Ashi Candles to activate strategy! It works both long and short trades.

Navigator Volume Profil FixedLong Term Investing
Day Trading
Navigator Volume Profile Fixed (Fixed + Current Session)
**Navigator Volume Profile Fixed** plots a horizontal volume profile on your chart using a **fixed timeframe anchor** (ex: Daily) and optionally overlays a **live “current” profile** for the active session/period.
It’s designed to help you quickly see where volume is building (acceptance) vs. thinning out (rejection), and to identify the key reference levels traders watch most: **PoC, VAH, and VAL**.
### What it plots
**Fixed Volume Profile (anchored to a timeframe)**
Builds a completed profile each time the selected anchor timeframe rolls over (ex: each new day on a Daily anchor).
**Current Volume Profile (live)**
Continuously updates the developing profile for the current anchor period (optional toggle).
**Point of Control (PoC)**
Highlights the single price level with the highest traded volume.
**Value Area (VAH / VAL)**
Plots the Value Area boundaries using a configurable percentage (default **68%**), and visually differentiates the value area from the rest of the profile.
Key settings
* **Enable Fixed VP**: turn the fixed/anchored profile on/off
* **Timeframe Anchor**: choose the profile reset period (ex: 1D)
* **Show Current Fixed VP**: show/hide the developing (current) profile
* **Number of Rows**: controls profile resolution (price “bins”)
* **Profile Width (%)** and **Bar Thickness**: visual scaling controls
* **PoC + Value Area toggles**: show/hide PoC and VA boundaries
* **Extend PoC Line**: optionally extend the PoC into the future
How to use it (practical)
* Treat **PoC** as the most accepted price for the anchored period.
* Use **VAH/VAL** as reference boundaries for balance vs. imbalance.
* Compare **Fixed** vs **Current** profiles to see whether volume is migrating higher/lower during the session and where price is building acceptance.
**Note:** This script draws using TradingView line objects and is optimized to stay within platform limits while maintaining a clean profile display.

Round Strike Price, Levels Options Series➤ Strike Price Range Mode:
➤ Exact Strike Price Mode:
⭐ Overview and How It Works
Round Strike Price or Levels is a precision-focused visual tool designed for options and index traders.
It dynamically plots round strike levels around the current price and presents them either as:
⠀ — Exact strike prices, or
⠀ — Strike price ranges, where each zone represents the midpoint between two adjacent strikes.
The indicator continuously recalculates the base strike using the current price and aligns all surrounding levels using a fixed step size.
All lines and labels are updated only on the last bar for optimal performance and stability.
This makes StrikePrice ideal for:
🔹 Identifying key option strikes.
🔹 Visualizing price acceptance zones.
🔹 Understanding strike-to-strike movement during intraday trading.
⭐ Key Features and Functionality
Strike Price Range:
⠀ — Treats each pair of strike lines as a price zone.
⠀ — Labels are plotted at the midpoint between two lines.
⠀ — Last label is intentionally hidden (no upper range exists)
Exact Strike Price:
⠀ — Labels are plotted directly on each strike line.
⠀ — Useful for precise strike-based analysis.
Dynamic Base Calculation:
⠀ — Automatically snaps price to the nearest round strike.
⠀ — Re-centers the entire grid as price moves.
⠀ — No manual adjustment required.
Efficient Object Management:
⠀ — Uses persistent arrays for lines and labels.
⠀ — Objects are reused instead of recreated.
⠀ — Prevents flickering and avoids TradingView object limits.
🎨 Visualizations and User Experience
Clean horizontal strike grid with configurable:
⠀ — Line width, Line color, Line style (Solid / Dashed / Dotted), Extension direction (Left / Right / Both / None).
Labels are:
⠀ — Positioned to the right of price, Size-adjustable, Fully customizable in text color and background color.
Designed to stay visually clear even on:
⠀ — Fast-moving intraday charts, Options-focused layouts, Multi-indicator setups.
Tip: Increase Right Bars Margin in chart settings to give labels proper spacing.
⭐ Settings and Customization
🔹 Strike Settings:
⠀ — Step (points): Distance between adjacent strike levels (e.g., 50, 100)
⠀ — Levels per side: Number of strike levels plotted above and below the base.
⠀ — Strike Mode: Strike Price Range, Exact Strike Price.
🔹 Line Settings:
⠀ — Line width, Line color, Line style (Solid / Dashed / Dotted), Line extension direction.
🔹 Label Settings:
⠀ — Show / hide labels, Label distance (bars to the right), Label size, Label text color, Label background color.
All label properties are updated dynamically, allowing real-time UI tuning without reloading the script.
⭐ Uniqueness of the Concept:
Unlike generic round-number indicators, StrikePrice:
⠀ — Understands option-style strike structure.
⠀ — Separates range-based thinking from exact price levels.
⠀ — Uses midpoint logic to visualize strike-to-strike movement.
⠀ — Maintains strict performance discipline by updating only when necessary.
This makes it especially useful for:
⠀ • NIFTY / BANKNIFTY options.
⠀ • Index and futures traders.
⠀ • Intraday strike rotation analysis.
⠀ • Premium decay and range-bound setups.
🚀 Conclusion:
StrikePrice is a focused, professional-grade indicator for traders who think in strikes, ranges, and levels rather than arbitrary prices.
It offers:
⠀ • Clear structure
⠀ • Accurate strike alignment
⠀ • Clean visuals
⠀ • Zero repainting logic

FTL Context - Public TeaserFTL Context (Teaser) – Public
FTL Context (Teaser) is a visual market context layer designed to highlight periods of increased market risk and structural tension.
This script does NOT provide trading signals and is NOT intended for standalone trading decisions.
It serves as a contextual overlay only, helping traders visually identify when market conditions shift away from equilibrium.
The teaser version is intentionally limited and does not expose the underlying logic or decision framework.
Full functionality, advanced filters, and integrated decision logic are available in the invite-only FTL Context Layer (PRO).
Educational & informational use only.


Vega Convexity Engine [PRO]ENGINEERED ASYMMETRY.
This is the flagship Stage 2 Specialist Model of the Vega Crypto Strategies ecosystem.
While the free "Regime Filter" tells you when to trade (filtering out chop), the Convexity Engine tells you how to trade. It activates only when the Regime Filter confirms an Impulse, classifying the specific vector of the market move to maximize risk-adjusted returns.
PRO FEATURES
This script visualizes the output of our Hierarchical Machine Learning Engine:
🚀 Directional Classification:
It does not just say "Buy." It classifies volatility into 4 distinct probability classes:
- EXPLOSION: High-confidence, high-velocity upside (Fat-Tail).
- RALLY: Standard trend continuation.
- PULLBACK: Short-term correction opportunity.
- CRASH: High-confidence downside (Long Squeeze Detection).
🛡️ Dynamic Risk Engine (Intraday Stops):
The "+" markers on your chart represent the Vega Institutional Stop Loss . These levels dynamically adjust based on Average True Range (ATR) and Volatility Z-Scores.
Strategy: If price breaches the "+" marker, the hypothesis is invalidated. Exit immediately.
📊 Institutional HUD:
A professional heads-up display showing the current Regime, Vector, and Risk Deployment status in real-time.
THE PHILOSOPHY
"Convexity" means limited downside with unlimited upside. By combining the Regime Filter (sitting in cash during noise) with Dynamic Stops (cutting losers fast), this engine is designed to capture the "fat tails" of the crypto market distribution.
🔒 HOW TO GET ACCESS
This is an Invite-Only script. It is strictly for members of Vega Crypto Strategies .
To unlock access, please visit the link in the Author Profile below or check our signature. Once subscribed via Whop, your TradingView username will be automatically authorized instantly.
Disclaimer: This tool is for educational purposes only. Past performance is not indicative of future results. Trading cryptocurrencies involves significant risk.

Pops Dividend 7-Day RadarHow traders use it as a strategy anyway 🧠
In real life, this becomes a manual or semi-systematic strategy:
Strategy logic (human-driven):
Scan for highest yield stocks
Filter for ex-date within 7 days
Apply technical rules (trend, EMAs, support)
Enter before ex-date
Exit:
Before ex-date (momentum run-up)
On ex-date
Or after dividend (reversion play)
Indicator’s role:
“Tell me when a stock qualifies so I can decide how to trade it.”
That’s exactly what this tool does.
How we could turn this into a strategy-style framework
Even though Pine won’t let us backtest dividends properly, we can:
Build a rules-based checklist (entry/exit rules)
Create alerts that behave like strategy triggers
Combine with:
EMA trend filters
Volume conditions
ATR-based exits
Label it as:
“Pops Dividend Capture Playbook” (manual execution)
This keeps it honest, legal, and reliable.
Bottom line
🧩 Indicator = what we built
📘 Strategy = how you trade it using the indicator
⚠️ TradingView limitations prevent a true dividend strategy backtest

Vega Convexity Regime Filter [Institutional Lite]STOP TRADING THE NOISE.
90% of retail trading losses occur during "Chop"—sideways markets where standard trend-following bots bleed capital through slippage and fees. Institutional desks know that the secret to high returns isn't just winning trades; it's knowing when to sit in cash.
The Vega V6 Regime Filter is the "Gatekeeper" layer of our proprietary Hierarchical Machine Learning engine (developed by a 25-year TradFi Risk Quant). It calculates a composite volatility score to answer one simple question: Is this asset tradeable right now?
THE VISUAL LOGIC
This indicator visually filters market conditions into two distinct Regimes based on our institutional backtests:
🌫️ GREY BARS (Noise / Chop)
The State: Volatility is compressing. The trend is undefined or weak.
The Trap: This is where MACD/RSI give false signals.
Institutional Action: Sit in Cash. Preserve Capital. Wait.
🟢 🔴 COLORED BARS (Impulse)
The State: Volatility is expanding. Momentum is statistically significant.
The Opportunity: A "Fat-Tail" move is likely beginning.
Institutional Action: Deploy Risk. Look for entries.
HOW IT WORKS (The Math)
Unlike simple moving average crossovers, the Vega Gatekeeper analyzes 4 distinct market dimensions simultaneously to generate a Tradeability Score (0-10) :
Trend Strength (ADX): Is there a vector?
Momentum (RSI/MACD): Is the move accelerating?
Volatility (Bollinger Bands): Is the range expanding?
Volume Flow: Is there institutional participation?
The Rule: If the composite score is < 4 , the market is Noise. The bars turn Grey. You do nothing.
BEST PRACTICES
For Swing Trading (Daily): Use Medium sensitivity. Only look for entries when the background turns Green/Red.
For Day Trading (4H/1H): Use Low sensitivity (more conservative). Use the Grey zones to tighten stops or exit positions.
THE PHILOSOPHY: "CASH IS A POSITION"
Most traders feel the need to be in a trade 24/7. The Vega V6 Engine (the system this tool is based on) achieved a +3,849% backtested return (18 months) largely by sitting in cash during chop. This tool visualizes that discipline.
🔒 WANT THE DIRECTIONAL SIGNALS?
This Lite version provides the Regime (When to trade).
To get the specific Entry Signals , Intraday Stop-Losses , and Probability Matrix (Stage 2 of our model), you need the Vega V6 Convexity Engine .
The Pro Version includes:
🚀 Specific Direction: Classification of "Explosion," "Rally," or "Crash."
🛡️ Dynamic Risk: Plots the exact Stop Loss levels used in our institutional backtests.
🌊 Macro Data: Integration of M2 Liquidity flow alerts.
👉 ACCESS INSTRUCTIONS:
Links to the Pro System , our Live Dashboard , and the 18-Month Performance Audit can be found in the Author Profile below or in the script settings.
Disclaimer: This tool is for educational purposes only. Past performance is not indicative of future results. Trading cryptocurrencies involves significant risk.

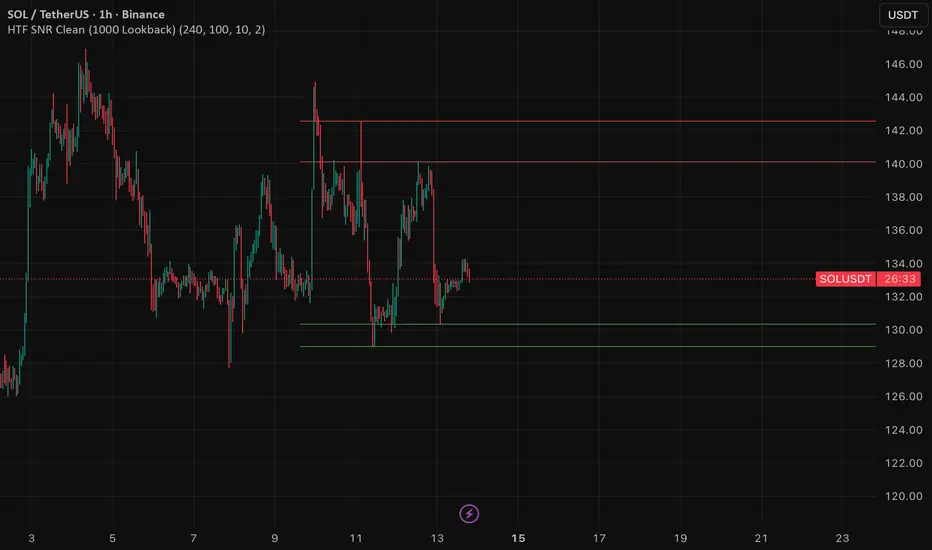
HTF SNR MMW✔ HTF SNR
✔ Non-repaint
✔ Limit 1000 candle
✔ Support & Resistance
✅ Full HTF SNR Final Clean
• ✅ Lookback 1000 candle
• ✅ Timeframe selectable (D / W)
• ✅ Support & Resistance
• ✅ Tidak repaint
• ✅ Tanpa error editor
INSTITUTIONAL MOMENTUM [@Ash_TheTrader]⚡ The Impulse Engine: Institutional Velocity & Smart Structure System
Subtitle/Short Description: Stop looking at just Open and Close. Visualize the speed of price action, detect institutional footprints, and trade off dynamic "living" market structure that flips and burns automatically. Developed by @Ash_TheTrader.
The Hidden Dimension of Price Action
Most traders look at a standard candlestick and see four data points: Open, High, Low, and Close.
But this hides the most critical information: The struggle.
Did the buyers step in aggressively in the first 5 minutes, pushing price to highs instantly? (Institutional buying)
Or did it take 59 minutes of slow, grinding effort to reach that high? (Retail exhaustion/Trap)
Standard candles look identical in both scenarios. The Impulse Engine, developed by @Ash_TheTrader, solves this by visualizing the "Speed of Price" (Velocity) directly onto your chart, combined with a state-of-the-art, dynamic market structure system.
It’s not just an indicator; it’s a complete market X-ray.
1. The Velocity Painter: See the Speed ⚡
The core of this system is the Velocity Engine. It looks "inside" your current timeframe bar (using lower timeframe data) to calculate how fast price traveled to its extremes.
It paints the bars based on institutional urgency, allowing you to ignore the noise and focus on the momentum.
The Visual Code:
⚡ NEON CYAN (Bullish Impulse) : Aggressive buying. Price ripped from the open to the high very quickly. This is where the smart money is stepping on the gas.
⚡ NEON MAGENTA (Bearish Impulse): Aggressive selling. Price crashed from the open to the low immediately.
💤 FADED GREY (Exhaustion/Trap): The "grind." Price took a long time to reach its extremes. These are often low-momentum environments or potential traps waiting to reverse.
STANDARD GREEN/RED: Normal market flow with no significant velocity extremes.
"Trade the Neon, Ignore the Grey." — @Ash_TheTrader
2. Smart Structure: "Living" Levels 🏗️
Old-school pivot indicators clutter your chart with endless historical lines that are no longer relevant. The Impulse Engine uses a "Living Structure" algorithm that manages the lifecycle of every support and resistance level.
It only shows you the two most relevant Resistance levels (R1, R2) above price, and the two most relevant Support levels (S1, S2) below price.
Risk-Based Classification:
You choose the structure based on your trading style in the settings:
Scalp Mode: Detects short-term, 5-bar swings. (Thin dotted lines).
Trend Mode: Detects standard trend swings (21-bar). (Dashed lines).
Major Swing: Detects deep, major structural points (60-bar). (Thick solid lines).
The "Flip & Burn" Mechanic (Viral Feature) 🔥
This is where the system gets smart. It understands market mechanics:
The Flip (Role Reversal): If a Resistance level is broken by a candle close, it automatically turns Gold and becomes Support (Flip). The same applies to Support turning into Resistance. You no longer need to guess if an old level will hold from the other side.
The Burn (Auto-Cleaning): If a "Flipped" level is broken again, the system recognizes it has lost its structural integrity. The line is instantly "burned" (removed from the chart).
This ensures your chart only ever shows levels that are active and respected.
3. Whale Signs: The Footprint of Big Money 🐋
Sometimes, velocity isn't enough. You need to see raw power.
The Whale Sign feature detects massive expansions in volatility. It flags any candle whose range is significantly larger (default 2x) than the average of the previous two candles.
💚 Green Triangle + $ (Below Bar): A massive bullish expansion candle. A "Wake Up" call for longs.
❤️ Red Triangle + $ (Above Bar): A massive bearish expansion candle. A warning sign for shorts.
These often precede sustained velocity moves.
4. The Pro HUD (Heads-Up Display) 💻
In the bottom right corner, the dynamic HUD gives you a real-time health check of the current candle.
Status Header: Instantly tells you if the current candle is IMPULSE, EXHAUSTION, or NORMAL.
Live Velocity %: The exact speed score. The text color changes to Neon during impulses and fades to grey during exhaustion.
Mode Info: Reminds you which risk setting you are currently using (e.g., Mode: ).
Signature: The official @Ash_TheTrader stamp of quality.
How to Trade With The Impulse Engine
This system is designed for confluence. Never trade a signal in isolation.
📈 Strategy 1 : The "Velocity Bounce" (Trend Continuation)
Ensure the market is trending (e.g., making higher highs).
Wait for price to pull back to a Smart Support level (Cyan dashed line or Gold "Flip" line).
Trigger: Look for a Neon Cyan Impulse Candle to form right off that support level. This confirms institutions are defending the structure with speed.
📉 Strategy 2: The "Whale Breakout"
Identify a consolidation zone below a Smart Resistance level.
Trigger: A Whale Sign ($) appears on a candle that successfully closes above the Resistance level.
Confirmation: The very next candle should ideally be a Neon Impulse candle continuing the move.
Conclusion
The markets are moved by aggression and speed. By obscuring this data, standard charts put you at a disadvantage.
The Impulse Engine brings this hidden data to the forefront, combining institutional velocity detection with smart, automated market structure that reacts to price just like a professional trader would.
Trade faster, trade smarter.
Developed by @Ash_TheTrader.
(Disclaimer: This tool is for informational purposes only and does not constitute financial advice. Always manage your risk.)

MTH Trend FinderMTH Trend Finder is an invite-only, advanced market analysis indicator developed by MarketToolHub for traders who want a complete intraday & scalping setup on their charts.
This indicator focuses on accurate trend identification combined with market strength analysis, helping traders avoid weak and false trade setups.
🔹 What It Offers
High-Accuracy Trend Detection
Market Strength Confirmation
False Signal Filtering
Auto-Plotted Trade Levels
Entry
Stop Loss
Targets
Non-Repainting Logic
Works Across All Timeframes
Supports Multiple Markets
Indian Markets | Global Stocks | Indices | Crypto | Commodities | Forex
🔹 How to Use
Apply the indicator to any instrument or timeframe
Trade in the direction of the identified trend
Use the auto-plotted Entry, SL, and Targets for structured risk management
Always confirm trades with proper discipline and risk control
🔹 Access Information
This is an invite-only script.
Access is provided to approved users only.
Redistribution, resale, or sharing access is strictly prohibited.
⚠️ Disclaimer:
This script is for educational and informational purposes only. It does not provide investment advice. Trading involves risk—use proper risk management at all times.

support@tennaflow.comAI-Powered Market Sentiment & Trend Detector for Bitcoin
Experience next-level trading with an AI-driven indicator optimized for the 5-minute timeframe. Using advanced AI algorithms to detect market fear and predict trend shifts with precision.
Notes: Only subscribers can use this indicator.
Subscription Access: $168/month .
Email: support@tennaflow.com
Trading Pair:
BINANCE:BTCUSDT26Z2025

SVTR [Ultimate]SVTR v1.0 is a fully automated trading strategy designed to identify high-probability market opportunities using structured momentum, trend validation, and risk-controlled execution logic.
This strategy is not a simple signal generator.
It is a complete decision engine that evaluates market conditions, confirms entries with multiple filters, and manages trades automatically according to predefined logic.
Built for traders who want consistency, discipline, and objective execution, SVTR removes emotional bias and delivers rule-based trading across different market environments.
KEY FEATURES
• Fully automated entry and exit logic
• Multi-layer confirmation system
• Momentum and trend validation
• Smart trade filtering to reduce noise
• Works on multiple markets and timeframes
• Non-repainting logic
• Alert-ready for automation and integrations
AUTOMATED STRATEGY LOGIC
SVTR continuously analyzes the market and only executes trades when all required conditions align.
This prevents overtrading and avoids weak or low-quality setups.
The strategy is designed to:
Enter when momentum and direction are confirmed
Avoid choppy and uncertain market phases
Exit trades based on objective, rule-driven logic
Maintain consistency regardless of emotions or bias
WHY THIS STRATEGY?
Most traders fail not because of bad ideas, but because of:
Late entries
Emotional decisions
Overtrading
Lack of discipline
SVTR v1.0 solves these problems by automating the decision process and executing trades exactly as designed, every time.
You trade the system.
Not your emotions.
WHO IS IT FOR?
• Traders looking for automated execution
• System-based and rule-driven traders
• Swing traders and intraday traders
• Traders who want consistency over discretion
• Users who want a ready-to-use strategy framework
IMPORTANT NOTES
• Invite-Only / Private access
• Source code is protected
• Designed for backtesting, automation, and live monitoring
• Strategy behavior may vary depending on market conditions and settings
VERSION
v1.0 – Initial Private Release
Future updates may include optimizations, additional filters, and performance improvements.
FINAL STATEMENT
SVTR v1.0 is built for traders who value structure, confirmation, and automation over guesswork.
If you are looking for a strategy that executes with discipline, filters weak setups, and operates as a complete automated system, this strategy is designed for you.

Multi-Timeframe CPR Pattern AnalyzerMulti-Timeframe CPR + Advanced Pattern Analyzer
A powerful, all-in-one indicator designed for professional price-action traders who use CPR (Central Pivot Range) as the core of their intraday, positional, and swing-trading strategies.
This script automatically plots Daily, Weekly, and Monthly CPR, identifies major CPR patterns, highlights Developing / Next CPR, and displays everything neatly in an interactive dashboard.
✨ Key Features
1️⃣ Daily, Weekly & Monthly CPR
Fully configurable CPR for all three timeframes
Clean plots with no vertical connector lines
Automatic zone shading
Adjustable line width, transparency, and colors
2️⃣ Support & Resistance (S1–S3, R1–R3)
Choose which timeframe’s S/R you want
Only plotted for the current day/week/month (no cluttering past charts)
Helps traders identify reaction zones and breakout levels
3️⃣ Next / Developing CPR
A unique feature rarely found in CPR indicators.
You can display:
Developing Daily CPR
Developing Weekly CPR
Next Monthly CPR (after month close)
All next/developing CPRs are plotted in a dashed style with optional transparency, plus labels:
“Developing Daily CPR”
“Developing Weekly CPR”
“Next Weekly CPR”
“Next Monthly CPR”
This allows you to anticipate the next session’s CPR in advance, a major edge for intraday, swing, and options traders.
4️⃣ Advanced CPR Pattern Detection
The script automatically detects all important CPR market structures:
📌 Narrow CPR
Uses statistical percentiles based on historical CPR width
Helps identify potential high-volatility breakout days
📌 CPR Width Contraction
Detects compression zones
Excellent for identifying trending days after tight ranges
📌 Ascending / Descending CPR
Bullish trend continuation (Ascending)
Bearish trend continuation (Descending)
📌 Virgin CPR
Highlights untouched CPR zones
Strong support/resistance zones for future days/weeks
📌 Overshoots
Detects:
Bullish Overshoot
Bearish Overshoot
Useful for understanding trend exhaustion.
📌 Breakouts
Identifies when price breaks above TC or below BC, signaling trend shifts.
📌 Rejections
Shows wick-based CPR rejections — reversal cues used by many price-action traders.
5️⃣ CPR Pattern Dashboard
A beautifully formatted dynamic table showing:
For Daily, Weekly, Monthly:
TC, Pivot, BC values
Current CPR Pattern
CPR Width with %
+ Next/Developing CPR values and patterns (for Daily/Weekly)
No need to manually calculate anything — everything is displayed in a clean, compact panel.
6️⃣ Completely Dynamic Across Timeframes
Works on all intraday, daily, weekly, and monthly charts
Automatically adjusts CPR length based on chart timeframe
Perfect for NIFTY, BANKNIFTY, FINNIFTY, stocks, crypto, forex
7️⃣ Alerts Included
Receive alerts for:
Narrow CPR formation
Virgin CPR
CPR breakouts
Pattern transitions
Great for traders who want automated monitoring.
8️⃣ Clean Chart, No Clutter
The script includes:
No vertical connecting lines
S/R only on the current period
Smart hiding of CPR on boundaries (to avoid "jump lines")
Fully toggleable features
You get a professional-grade, clutter-free CPR experience.
🎯 Why This Indicator?
This script goes beyond standard CPR tools by offering:
Next AND Developing CPR
Multi-timeframe CPR analysis
Professional CPR pattern detection
Smart dashboard visualization
Perfect setup for trend traders, reversal traders, and breakout traders
Whether you're scalping, day trading, swing trading, or doing positional analysis — this tool gives you context, structure, and precision.
📌 Recommended Use Cases
Intraday index trading (NIFTY, BANKNIFTY, NIFTY 50 Stocks)
Swing trading stocks
Crypto CPR analysis
Options directional setups
CPR-based breakout and reversal strategies
Trend continuation identification
Understanding volatility days (Narrow CPR Days)
⚠️ Disclaimer
This is a technical tool for chart analysis and does not guarantee profits. Always combine CPR analysis with price action, volume, and risk management.

Nooner's Heikin-Ashi/Bull-Bear CandlesCandles are colored red and green when Heikin-Ashi and Bull/Bear indicator agree. They are colored yellow when they disagree.
