Lower Timeframe Volume BarsDescription:
The Lower Timeframe Volume Bars indicator enhances your TradingView experience by allowing you to visualize volume data from lower timeframes on your current chart. This powerful tool helps you gain deeper insights into volume trends and activity that are not immediately visible on higher timeframe charts. Specifically, it shows the volume data from the last bar of the selected lower timeframe.
Key Features:
Volume Bars from Lower Timeframes:
Display volume data from 1-minute or 1-second timeframes directly on higher timeframe charts, such as 15 minutes or 1 hour.
Each volume bar represents the aggregated volume from the lower timeframe within the selected higher timeframe period.
Enhanced Volume Analysis:
Gain a more detailed understanding of volume spikes and troughs that may be hidden in higher timeframe charts.
Identify potential market turning points and confirm trends with precise volume data.
Customizable Display:
Adjust the appearance of volume bars to fit your chart style and preferences.
Configure settings such as color, size, and positioning of volume bars for optimal visibility and clarity.
Seamless Integration:
Easily add the indicator to any chart in TradingView with a few clicks.
Works in conjunction with other technical indicators and tools to provide a comprehensive analysis environment.
How to Use:
Add the Lower Timeframe Volume Bars indicator to your chart.
Select the lower timeframe you wish to fetch volume data from (e.g., 1-minute or 1-second).
Customize the display settings to match your charting style.
Observe the volume bars overlaying your current chart to analyze volume activity across different timeframes, specifically showing the last bar's volume.
Use the detailed volume information to make informed trading decisions and enhance your market analysis.
Benefits:
Increased Clarity: See detailed volume activity that is often lost in higher timeframe aggregation.
Better Decision Making: Make more informed trading decisions with a clear view of volume trends and spikes.
Improved Trend Confirmation: Use lower timeframe volume data to confirm the strength and sustainability of market trends.
Enhance your trading strategy and gain a deeper understanding of market dynamics with the Lower Timeframe Volume Bars indicator. Visualize, analyze, and trade with confidence by leveraging detailed volume insights from lower timeframes.
Индикатор объёма

[EVI]Enhanced Volume IndicatorEnglish Version
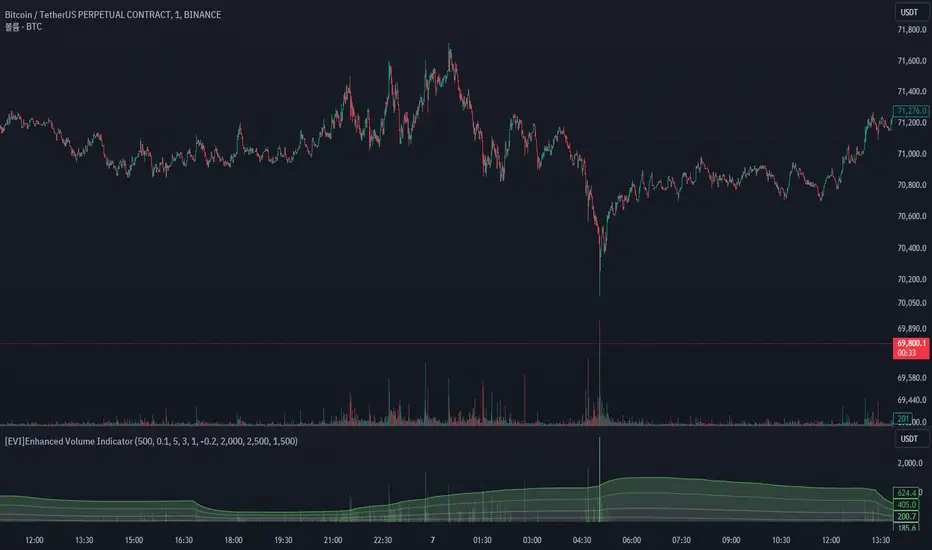
Enhanced Volume Indicator (EVI)
The Enhanced Volume Indicator (EVI) is an advanced yet user-friendly tool designed to measure and visualize the strength of market volume using the statistical power of standard deviation. By offering a clear and dynamic representation of volume fluctuations, the EVI enables traders to effortlessly identify significant market movements and potential trading opportunities.
Key Features:
Sophisticated Volume Strength Assessment: The EVI leverages the standard deviation of historical candle volumes to evaluate and categorize the current volume intensity. This sophisticated methodology allows for the precise detection of when current volume levels significantly deviate from their historical norms.
Intuitive Visual Cues: Volume bars are color-coded to represent varying levels of volume intensity, ranging from very weak to very strong. This intuitive visual differentiation aids traders in quickly grasping the market's underlying volume dynamics at a glance.
Proactive Threshold Alerts: Stay ahead of the market with the EVI’s built-in alert functionality. Receive real-time notifications of critical volume changes, ensuring that you remain informed of significant market developments even while away from your trading desk.
How It Works:
The EVI calculates the Simple Moving Average (SMA) and Standard Deviation (STDEV) of volume over a user-defined period (default set to 500 candles). Utilizing these statistical measures, the indicator establishes various volume thresholds by applying predefined multipliers for extreme, high, medium, and low volume levels. The volume bars are then color-coded based on these thresholds, providing traders with a clear visual representation of volume intensity. Additionally, horizontal lines indicating these thresholds are plotted on the chart for easy reference, further enhancing the indicator’s usability.
This version of the EVI is particularly suited for traders who prefer simplicity and efficiency over complexity, making it an excellent alternative to the more intricate Volume Delta Divergence (VDD) indicator. The EVI delivers powerful volume insights in a straightforward and accessible manner, ensuring that even those who favor less complexity can benefit from robust volume analysis.
Ideal for traders seeking to capture major market moves or pinpoint potential reversals, the Enhanced Volume Indicator (EVI) is a must-have tool. Elevate your trading strategy with the EVI and ensure you never miss out on significant volume breakouts again.
Korean Version
Enhanced Volume Indicator (EVI)
Enhanced Volume Indicator (EVI)는 시장 볼륨의 강도를 표준편차의 통계적 힘을 사용하여 측정하고 시각화하는 고급적이면서도 사용하기 쉬운 도구입니다. EVI는 볼륨 변동의 명확하고 동적인 표현을 제공하여 트레이더가 중요한 시장 움직임과 잠재적인 거래 기회를 쉽게 식별할 수 있도록 합니다.
주요 기능:
정교한 볼륨 강도 평가: EVI는 이전 캔들의 볼륨 표준편차를 활용하여 현재 볼륨 강도를 평가하고 분류합니다. 이 정교한 방법론은 현재 볼륨 수준이 과거 평균에서 크게 벗어날 때를 정확하게 감지할 수 있도록 합니다.
직관적인 시각적 신호: 볼륨 바는 매우 약한 것부터 매우 강한 것까지 다양한 볼륨 강도를 나타내는 색상으로 코딩됩니다. 이 직관적인 시각적 차별화는 트레이더가 시장의 기본적인 볼륨 동향을 한눈에 쉽게 파악할 수 있도록 돕습니다.
선제적 임계값 알림: EVI의 내장 알림 기능으로 시장을 앞서가십시오. 중요한 볼륨 변화에 대한 실시간 알림을 받아 거래 데스크를 떠나 있는 동안에도 중요한 시장 발전에 대해 계속 정보를 얻을 수 있습니다.
작동 원리:
EVI는 사용자가 정의한 기간(기본값은 500 캔들)의 볼륨에 대한 단순 이동평균(SMA)과 표준편차(STDEV)를 계산합니다. 이러한 통계적 측정을 활용하여, 인디케이터는 극단적, 높은, 중간 및 낮은 볼륨 수준에 대한 사전 정의된 배수를 적용하여 다양한 볼륨 임계값을 설정합니다. 그런 다음, 볼륨 바는 이러한 임계값을 기반으로 색상 코딩되어 트레이더에게 볼륨 강도의 명확한 시각적 표현을 제공합니다. 또한, 이러한 임계값을 나타내는 수평선이 차트에 참조용으로 표시되어 인디케이터의 사용성을 더욱 향상시킵니다.
이 버전의 EVI는 복잡함보다는 단순함과 효율성을 선호하는 트레이더에게 특히 적합하여, 더 복잡한 Volume Delta Divergence (VDD) 인디케이터에 대한 훌륭한 대안이 됩니다. EVI는 강력한 볼륨 정보를 간단하고 접근 가능한 방식으로 제공하여, 복잡함을 싫어하는 사용자도 강력한 볼륨 분석의 혜택을 누릴 수 있도록 합니다.
주요 시장 움직임을 포착하거나 잠재적인 반전을 식별하려는 트레이더에게 이상적인 Enhanced Volume Indicator (EVI)는 반드시 갖추어야 할 도구입니다. EVI로 트레이딩 전략을 강화하고 중요한 볼륨 돌파를 절대 놓치지 마세요.
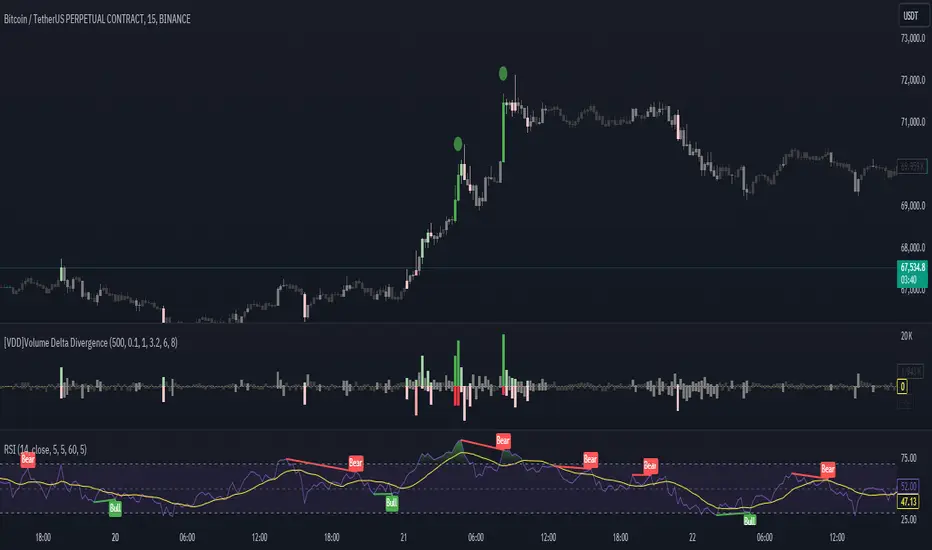
[VDD]Volume Delta DivergenceThis indicator displays volume candles bidirectionally and indicates the strength of the volume. It can create better synergy when used together with the Momentum Squeeze Indicator and can be very useful for bottom and top catching. I am continually modifying it for additional features, so please evaluate it with that in mind.
Volume Spectrum Candles"Volume Spectrum Candles" is a visually intuitive trading indicator that enhances candlestick charts by incorporating trading volume directly into the color of each candle.
Purpose and Utility:
This tool assigns a unique color gradient to candlesticks, which varies from light to dark based on the volume of trades executed. This feature allows traders to immediately recognize and differentiate periods of varying trading activity at a glance.
Target User:
It is specifically designed for traders who integrate volume analysis into their trading strategies, offering a seamless blend of visual cues and technical data.
Benefits:
By providing a visual representation of volume intensity, traders can more effectively identify key market movements, helping to determine optimal entry and exit points. The color gradation adds a layer of quick analysis, making it easier to spot trends in trading volume without the need for additional indicators.
Application and Versatility:
Whether used by day traders to capture short-term price movements or by long-term investors to gauge broader market sentiment, "Volume Spectrum Candles" serves as a valuable addition to any trading setup.

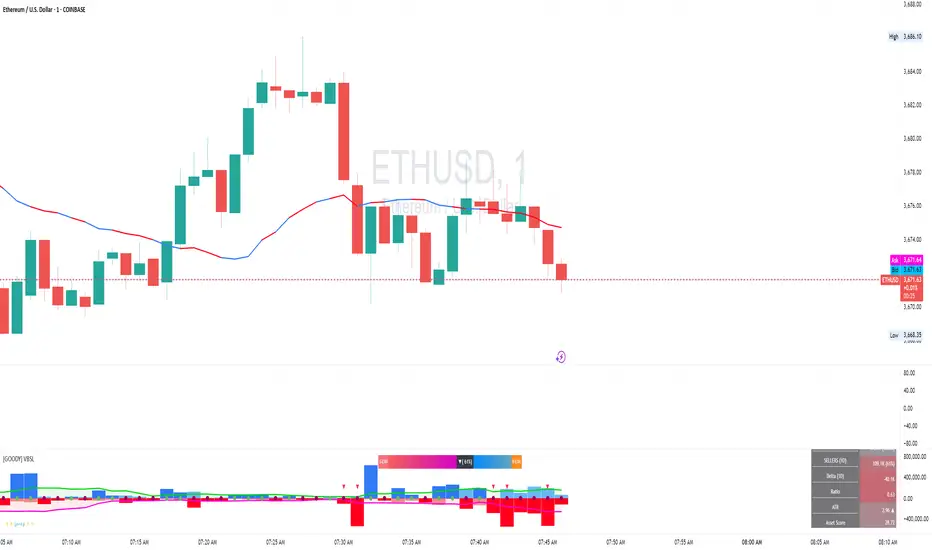
Volume Buyer-Seller [GOODY]This indicator was designed to analyze buying and selling pressure through volume calculations, providing insights into market dynamics. It can be used to determine whether buyers or sellers dominate the market at any given time.
Key Features
1. Volume Calculations: This indicator calculates the volume attributable to buyers and sellers for each bar, then represents it as buying and selling columns on the chart. It also provides the average volume over a specified period for context.
2. Dominance Logic: By comparing the buying and selling volumes, the indicator determines which side (buyers or sellers) has dominance. If the difference between the two is within a specified threshold, the market is considered indecisive.
3. Dominance Marker: Circles or squares appear on the chart to indicate the dominant force, helping traders quickly assess market sentiment. The colors of these markers can be customized.
4. Label Display: The indicator displays a comprehensive label on the chart with information like total volume, buyer/seller percentages, average volume, ratio, and ATR (Average True Range) details. This label can show current or past data depending on user preference.
5. Ratio and Control: A critical component is the ratio, calculated as the proportion of buying volume to selling volume. This ratio is a key indicator of market sentiment, with an appended symbol to denote whether buyers or sellers are in control.
How to Use
• Settings: Adjust the settings to align with your trading strategy. You can modify the length for average volume, ATR, and other parameters to suit your trading style.
• Volume Analysis: Monitor the buying and selling columns to determine market activity. The larger columns indicate higher volume, suggesting a strong buying or selling pressure.
• Dominance: Pay attention to the dominance markers. Green markers indicate buying dominance, while red markers signify selling dominance. If the market is indecisive, the marker will be gray.
• Ratio: A ratio above 1 suggests buying dominance, while a ratio below 1 indicates selling dominance. The ratio's appended color tag helps quickly identify which side is in control.
• Labels: The labels provide a snapshot of key data, including total volume, buyer/seller percentages, average volume, ratio, and ATR. This information is helpful in understanding overall market conditions.
Reading the Indicator
• Buying and Selling Columns: These represent the respective volumes for each side. Positive columns are buying volumes, and negative columns are selling volumes.
• Dominance Circles: A circle appears at the zero baseline to show which side is currently dominant. A blue circle indicates buying dominance, while a red circle indicates selling dominance.
• Ratio with Dominance: The label includes a ratio with a tag showing who is in control. A green tag indicates buyers, and a red tag indicates sellers.
• ATR and Average Volume: The label provides additional context with ATR and average volume, helping you understand volatility and relative volume.
Volume Gauge Addition : Introduced a volume gauge display option to visualize the relative strength of buying vs. selling volumes. Users can toggle this feature on or off according to their analysis needs.
Total Volume
Metric: Displays "Total Vol."
Value: Shows the total trading volume for the current bar, formatted in a human-readable format (K for thousands, M for millions). Additionally, it shows the percentage of this volume relative to the average volume, aiding in understanding volume spikes or drops.
Usage: Compare current volume to historical averages to identify unusual market activity.
Average Volume
Metric: Displays "Avg Vol."
Value: Shows the simple moving average of the volume over a user-defined period, formatted similarly to Total Volume.
Usage: Helps determine if current volume is above or below average, indicating potential interest or disinterest in the asset.
Buyers
Metric: Displays "BUYERS."
Value: Shows the volume of buying calculated from the upward price movements within the bar, along with its percentage of the total volume.
Usage: Spot dominance in buying activity which might suggest bullish conditions.
Sellers
Metric: Displays "SELLERS."
Value: Shows the volume of selling calculated from the downward price movements within the bar, along with its percentage of the total volume.
Usage: Spot dominance in selling activity which might suggest bearish conditions.
Delta
Metric: Displays "Delta."
Value: Shows the difference between buying and selling volumes, providing a quick snapshot of which side of the market is exerting more pressure.
Usage: Use to gauge overall market sentiment and potential price direction.
Ratio
Metric: Displays "Ratio."
Value: Shows the ratio of buying volume to selling volume, providing insight into the relative strength of buyers vs. sellers.
Usage: Ratios significantly above or below 1 can indicate strong market biases.
ATR (Average True Range)
Metric: Displays "ATR."
Value: Shows the current ATR value to gauge volatility, with an arrow indicating the direction of change from the previous bar’s ATR.
Usage: Utilize to assess market volatility and potentially adjust trading strategies or risk management settings.
Dynamic Background Colors
The table employs dynamic background colors for certain metrics to visually represent data intensity or significance:
Total Volume: Changes color based on the percentage relative to the average volume.
Buyers/Sellers: The background color indicates whether buying or selling is dominant.
Delta and Ratio: Colors change based on their calculated values to reflect market conditions quickly.
What is Volume Delta?
Volume delta, also known as volume difference or volume delta divergence, refers to the difference between buying (accumulation) and selling (distribution) volumes within a given time period. It provides a quantitative measure of the net buying or selling pressure in the market.
How to Use Volume Delta:
Identifying Market Sentiment:
Positive delta values indicate that buying volume exceeds selling volume, suggesting bullish sentiment.
Negative delta values indicate that selling volume exceeds buying volume, suggesting bearish sentiment.
Confirming Price Movements:
Volume delta can be used to confirm price movements. For example, if prices are rising and volume delta is positive, it may suggest that the uptrend is supported by strong buying interest.
Conversely, if prices are falling and volume delta is negative, it may suggest that the downtrend is supported by strong selling pressure.
Spotting Divergence:
Divergence between price and volume delta can signal potential trend reversals. For example, if prices are rising but volume delta is declining (or vice versa), it may indicate weakening momentum and a possible reversal in trend.
Confirming Breakouts:
Volume delta can help confirm breakout moves. For instance, a breakout accompanied by increasing positive delta values may suggest strong buying interest and validate the breakout.
In summary, volume delta provides valuable insights into market sentiment and can be used alongside price action analysis to make more informed trading decisions.
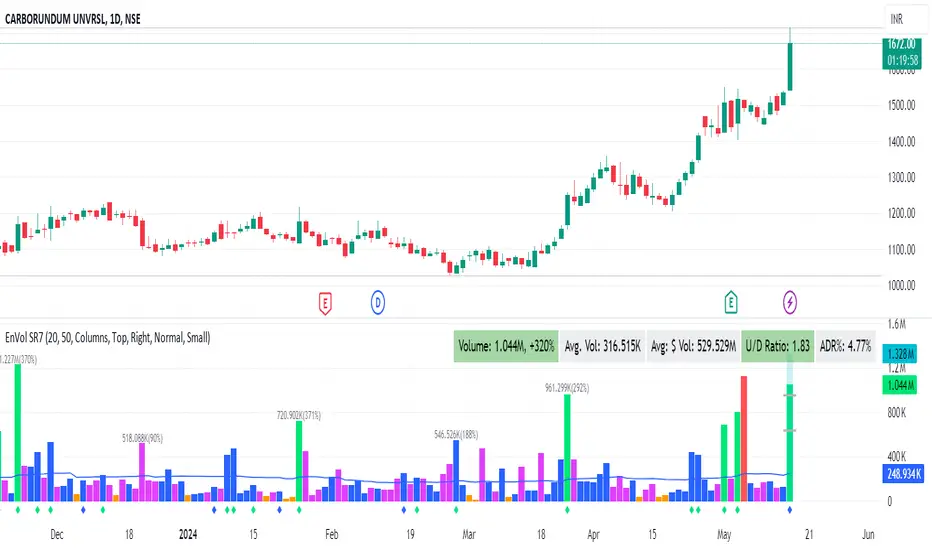
Enhanced Volume by SR7SiddharthaRay007's Enhanced Volume Indicator works on any Timeframe
⦿ Volume Labels:
1. Current Volume, Volume Change%, Average Volume, Average Doller Volume, Up/Down Ratio, ADR%.
=>Average value can be changed using 'Lookback Length' (Default: 20)
⦿ Simple Moving Average: MA (Default: 50). Color of MA changes based on the up down volume ratio.
1. Up/Down Ratio > 1: Blue
2. Up/Down Ratio < 1: Orange
⦿ Volume Bar Colors:
1. High Relative Volume Positive Candle: Lime Green .
2. High Relative Volume Negative Candle: Red .
3. Normal Volume Positive Candle: Blue .
4. Normal Volume Negative Candle: Fuchsia .
5. Low Relative Volume Positive/Negative Candle: Orange .
=>High Relative Volume > 300% of Average Volume; Low Relative Volume < 30% of Average Volume
⦿ Pocket Pivot (A pocket pivot is an up day with volume greater than any of the down days volume in the past 10 days)
1. 10 day Pocket Pivots: Lime Green Diamond below volume bar
2. 5 day Pocket Pivots: Blue Diamond below volume bar
⦿ 'Highest Volume (HV) ' on top of the Volume Bar:
1. Highest Volume Ever (HVE)
2. Highest Volume in Over a Year (HVY)
⦿ Projected Volume Bar: Aqua
⦿ Plot a line at 2x and 3x Average Volume and set Alerts
Uptrick: Volume StrengthPurpose:
The "Uptrick: Volume Strength" indicator, known by its short title 'VolStrength,' is meticulously designed to evaluate the strength of volume activity within a market, providing traders with valuable insights into liquidity dynamics. By visualizing volume bars and comparing them to a predefined threshold, traders can gauge the intensity of buying or selling pressure, thereby assessing market liquidity and potential price movements.
Explanation:
Input Parameters:
Traders benefit from the ability to customize the threshold for high volume, allowing them to adapt the indicator to varying market conditions and trading strategies.
The calculation of the average volume over a specified period adds depth to the analysis, offering traders a reference point for assessing current volume levels relative to historical averages and evaluating liquidity trends.
Volume Analysis:
The script discerns between bars where the closing price exceeds the opening price (up bars) and bars where the closing price is lower than the opening price (down bars), facilitating the identification of bullish or bearish market sentiment.
High-volume bars that surpass the predefined threshold are prominently highlighted, serving as indicators of increased trading activity and enhanced liquidity levels.
Average Volume Visualization:
A line representing the average volume over the specified period is plotted on the chart, providing traders with a visual reference for evaluating current volume levels against historical averages. This aids in assessing the overall liquidity conditions in the market.
Volume Bar Representation:
The colorization of volume bars is contingent upon their direction (up or down) and whether they exceed the high volume threshold.
Up bars, symbolizing buying pressure, are typically depicted in green, while down bars, indicative of selling pressure, are rendered in red.
Notably, when volume surpasses the high volume threshold, the respective bar color is applied, accentuating significant volume spikes and their potential impact on liquidity and price dynamics.
Through its meticulous design and comprehensive features, the "Uptrick: Volume Strength" indicator equips traders with actionable insights into market liquidity dynamics. By integrating volume analysis into their trading strategies, traders can effectively assess liquidity conditions, identify potential price movements, and make informed trading decisions.

Volume Flow ImbalanceVolume Flow Imbalance (VFI) Indicator
The Volume Flow Imbalance (VFI) indicator is designed to provide traders with insights into the market's buying and selling pressure by calculating the imbalance between buy and sell volumes over a user-defined lookback period. This indicator is particularly useful for identifying potential pivot points and market sentiment shifts.
How to Use :
Setup Parameters :
Lookback Period: Set the number of bars over which the imbalance is calculated. Increasing this number provides a broader view of market trends.
Lower Timeframe Data: Optionally enable this feature to analyze volume data from lower timeframes, offering a more granified view of volume flows.
Interpreting the Indicator :
The VFI outputs a value that represents the net imbalance between buying and selling volumes. Positive values indicate a predominance of buying volume, suggesting bullish conditions, while negative values suggest bearish conditions with more selling volume.
The indicator also provides dynamic threshold lines based on the standard deviation of the calculated imbalances, helping to visually identify extreme conditions where reversals might occur.
Application :
Apply the VFI to any chart to assess the balance of trade volumes in real-time.
Use the indicator in conjunction with other technical analysis tools to confirm trends or potential reversals.
Tips :
Adjust the lookback period based on the volatility and trading volume of the asset to optimize performance.
The VFI is best used in liquid markets where volume data is a reliable indicator of market activity.
By providing a clear measure of how much buying and selling is occurring relative to the past, the VFI helps traders make informed decisions based on underlying market dynamics.

Points Per Share Traded1. This is a simple measurement of what is basically Price-Change/Volume
2. The actual "price per share metric" (PPST) is shown
3. There are a few different kinds of moving averages to test
4. There is an option to show or hide the current bar data
5. There is a multiplier - if on your market it displays a number of 0.00 or a very high number you can multiply by powers of 10 if you'd like to make a detailed measurement (this doesn't change the relationship of the measurement vs 0)
This indicator makes a very simple metric to understand - how many dollars is the price moving per share traded?
... at highs the price usually moves the fastest vs amount of shares traded
... at lows it's the usually the opposite
There are many ways to use this indicator - but I am leaving it up to the user to test their own market and find a use for it
example: Sometimes price makes an new high or low yet this indicator has not yet done so, can be a sign that continuance of the trend is possible - even if at price resistance
A great compliment to AVWAPS or VWAPs or Volume/Price indicators
The chart you are analyzing MUST have volume accessible or the indicator will not work
Hopefully we can build up a good library the best settings for certain markets
Cheers!
Joe

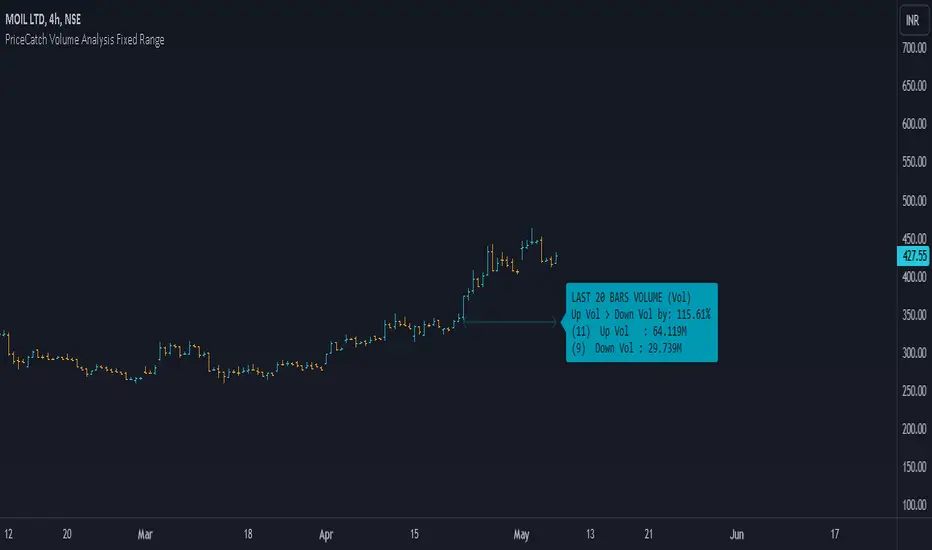
PriceCatch Volume Analysis Fixed RangeHi TV Community.
It's been sometime since I published any script / utility. But today, I am back with a new script.
Volume Analysis
Studying volume when in trade or before taking one is very important as seasoned traders would tell you. So, this script helps you to look at volume over a specific interval from current bar. You will have to set the look-back period in the settings dialog.
The script will then show over that period :
Number of Up and Down bars
Volume Ratio of Up Volume over Down Volume
Actual Up and Down Volume
Percentage of Up Volume to Down Volume
I use this information in all my trades and hope that you will also find this Script useful.
To my knowledge, I have not seen another volume analysis script that helps see volume in the way this script does.
NOTE:
This script does not give any buy or sell signal if that is what you are looking for. But if you see that Up Volume is 3 times Down Volume, then that should mean something to you. So also when price is slipping down.
Disclaimer
I am sharing this Script without any warranties as to its usability. Use it only if you like it. As always when it comes to trading you and you alone are responsible for your actions.
All the best with your trades.
PriceCatch
Volume Buy/Sell Signals [EdgeTerminal]Volume Signals is an indicator based on volume moving averages and divergence to provide different types of information.
The first signal is the peak volume box shown in red or green, showing the volume peak in an uptrend or downtrend. This usually is a sign of reversal or a slowdown in the trend, depending on the direction of the price.
Peak zones assume that a movement has reached your end for the time being or a new movement is initiated. This cannot be verified by simple volume alone, that's why we have a buy/sell signal feature based on divergence.
The narrow box indicates a continuation of the trend but can be used as support or resistance.
Medium box size usually means the price is in an accumulation phase. This can act as both support and resistance, meaning if the price pushes above, a long position can be taken, and if the price drops below, a short position can be taken.
Large box size indicates a range in which the price will stay shortly. This is usually a sign of high volume volatility and depending on the direction, the price can revisit the area and drop back down or go back up fast. For example, if the large green box appears after a major volume peak and if the price goes above the box, there is a major chance that the price will revisit the box zone and will drop as fast as it went up.
The second signal is a buy/sell signal generated based on the volume divergence and volume numbers compared to average volume values. If the volume is showing signs of lower lows or higher highs, the signal will appear. This indicator is great at generating early entry and exit signals.
Additionally, the script can generate LP (lower possibility) buy/sell signals. Usually, the script looks for two moving average lower lows in volume to generate a signal but when this is turned on, the indicator will also show single confirmed (we call them lower possibility) signals. This is useful when there are not enough signals generated on screen and you want to see more data points.
The settings:
Volume Peak MA: Sets the moving average of the volume peak,
Volume Peak Box Length: Defines the box display length of the volume box across the chart
Volume Box Threshold: Threshold of volume peak detection. A lower number generates more signals and a higher number generates fewer.
First Signal MA Length: First moving average length used in the calculation of the volume signals
Second Signal MA length: Second moving average length used in the calculation of the volume signals
Volume Lookback Right: How many bars to look back on the right side (forward) to confirm the signal
Volume Lookback Left: How many bars to look back on the left side (behind) to confirm the signal
Max Lookback Range: Max lookback range for the KNN machine learning volume data of signal generation.
Min Lookback Range: Minimum lookback range for the KNN machine learning volume data of signal generation.
Show Buy Signals: It shows or hides buy signals.
Show LP Buys: It shows or hides lower possibility buy signals.
Show Sell Signals: It shows or hides sell signals.
Show LP Sells: It shows or hides lower possibility sell signals.

Volume RSIRelative strength index based on volume data.
Indicate volume momentum, and help you define divergences on volume.
The goal is to have an idea and represent in another form volumes and kept eyes on volume momentum on a certain period.
RSI is an indicator about the strength, I keep the oversold/overbought thresholds. I think it still makes sense to interpret.
the calculations is simple, we use the average volume up (avg_vol_up) and average volume down (avg_vol_down) over the period.
then calculate the relatives strength : ( avg_vol_up / ( avg_vol_up + avg_vol_down ) ) * 100
The period is 14 by default. The period is used for calculating mean.
I also add MA it helps to have a global look on the indicator.
In my code I used the idea of @Padronhosnai in his code "positve/negative volume" to get volumes in the right form.
For pictures I also use his indicator it's the one above.

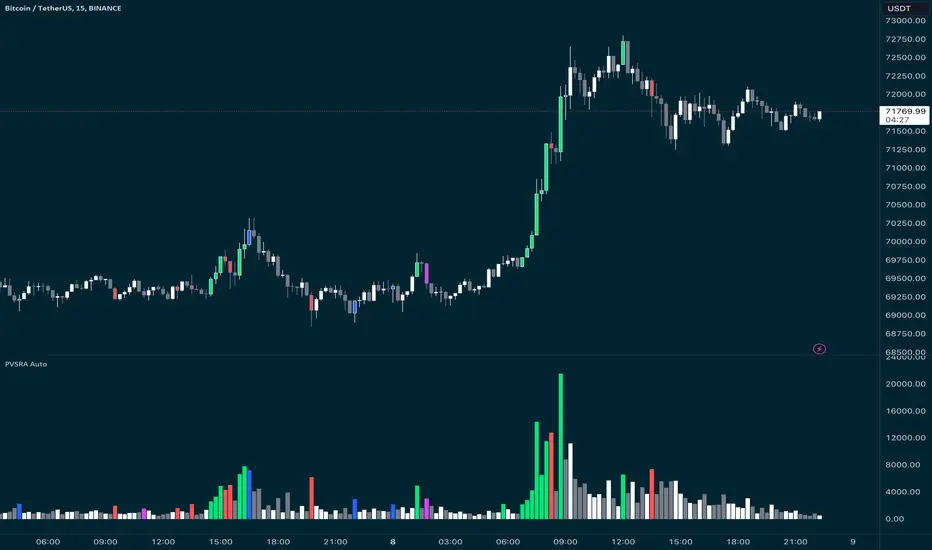
PVSRA Candles Auto OverrideWhat does this “PVSRA Candles Auto Override” Indicator
do?
This indicator automates PVSRA analysis for crypto traders. It finds the corresponding Binance Perpetual Futures chart for the current instrument, then replaces the current chart's volume profile with the perpetual futures data (if available) to ensure the PVSRA calculation uses the most relevant volume. This not only reduces human error during market scans but also automatically selects the appropriate Binance Perpetual Futures contract, saving time and improving the accuracy of PVSRA calculations.
How can a trader use this indicator?
This helps the trader to identify if there is volume data available in an equivalent Binance Perpetual Futures chart and automatically displays it, making it easier to switch coins whilst viewing the market. Why do we want to use Binance Perpetual Futures Volume? In most markets Binance volume surpasses those of other crypto exchanges so this will give us a better view on the volume spikes in the market.
What is PVSRA and how can I trade using this indicator?
PVSRA candles are a type of candlestick chart formatting. PVSRA stands for Price, Volume, Support and Resistance Analysis.
Here's a breakdown of what PVSRA candles aim to achieve:
Combine multiple factors: They take into account price movement, trading volume, and support and resistance levels to identify potential trading opportunities.
Highlight potential imbalances: By color-coding candles based on PVSRA analysis, they aim to show areas of high volume activity, potentially representing imbalances created by market makers (large institutions that influence price).
Identify areas of revisit: The theory is that these high-volume zones may be revisited by the market in the future, as there's "unrecovered liquidity" in those areas.
Usage of the Indicator:
By default the indicator will automatically use the Equivalent Binance Perpetual Chart for the Data
You can override the symbol manually if you what to view another instrument’s data.
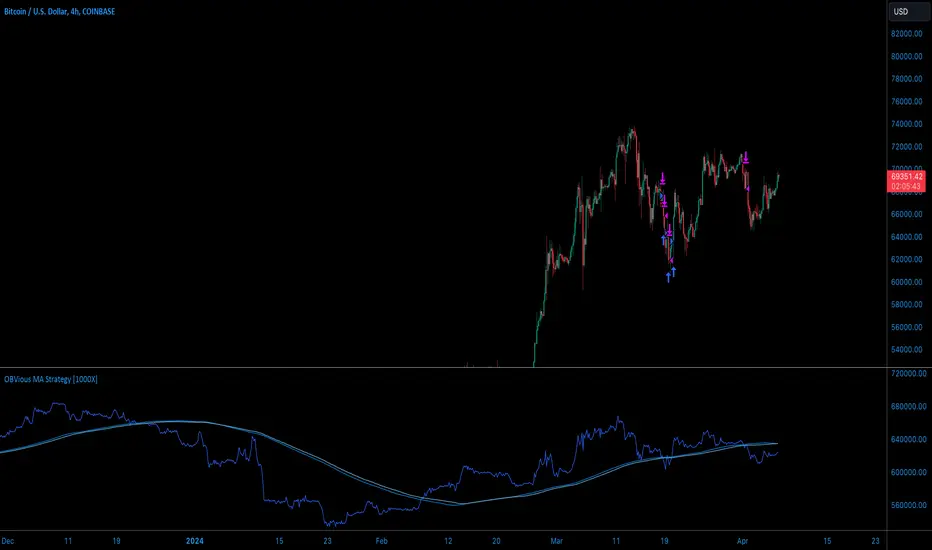
OBVious MA Strategy [1000X Trader]Exploring OBV: The OBVious MA Strategy
Are you using On Balance Volume (OBV) effectively? OBV is a gift to traders. OBV often provides a leading signal at the outset of a trend, when compression in the markets produces a surge in OBV prior to increased volatility.
This strategy demonstrates one method of utilizing OBV to your advantage. I call it the "OBVious MA Strategy ” only because it is so simple in its mechanics. This is meant to be a demonstration, not a strategy to utilize in live trading, as the primary utility of the OBVious MA indicator is as a volume confirmation filter that complements other components of a strategy. That said, I felt useful to present this indicator in isolation in this strategy to demonstrate the power it holds.
Strategy Features:
• OBV is the core signal: this strategy revolves around the On Balance Volume indicator. OBV is a straightforward indicator: it registers a value by adding total volume traded on up candles, and subtracts total volume on down candles, generating a line by connecting those values. OBV was described in 1963 by Joe Granville in his book "Granville's New Key to Stock Market Profits” in which the author argues that OBV is the most vital key to success as a trader, as volume changes are a major predictor of price changes.
• Dual Moving Averages: here we use separate moving averages for entries and exits. This allows for more granular trade management; for example, one can either extend the length of the exit MA to hold positions longer, or shorten the MA for swifter exits, independently of the entry signals.
Execution: long trades are taken when the OBV line crosses above the Long Entry Moving Average of the OBV. Long exits occur when the OBV line crosses under the Long Exit MA of the OBV. Shorts enter on a cross below the Short Entry MA, and exit on a cross above the Short Exit MA.
• Directional Trading: a direction filter can be set to "long" or "short," but not “both”, given that there is no trend filter in this strategy. When used in a bi-directional strategy with a trend filter, we add “both” to the script as a third option.
Application:
While this strategy outlines entry and exit conditions based on OBV crossovers with designated moving averages, is is, as stated, best used in conjunction with a supporting cast of confirmatory indicators (feel free to drop me a note and tell me how you've used it). It can be used to confirm entries, or you might try using it as a sole exit indicator in a strategy.
Visualization:
The strategy includes conditional plotting of the OBV MAs, which plot based on the selected trading direction. This visualization aids in understanding how OBV interacts with the set moving averages.
Further Discussion:
We all know the importance of volume; this strategy demonstrates one simple yet effective method of incorporating the OBV for volume analysis. The OBV indicator can be used in many ways - for example, we can monitor OBV trend line breaks, look for divergences, or as we do here, watch for breaks of the moving average.
Despite its simplicity, I'm unaware of any previously published cases of this method. The concept of applying MAs or EMAs to volume-based indicators like OBV is not uncommon in technical analysis, so I expect that work like this has been done before. If you know of other similar indicators or strategies, please mention in the comments.
One comparable strategy that uses EMAs of the OBV is QuantNomad’s "On Balance Volume Oscillator Strategy ", which uses a pair of EMAs on a normalized-range OBV-based oscillator. In that strategy, however, entries and exits occur on one EMA crossing the other, which places trades at distinctly different times than crossings of the OBV itself. Both are valid approaches with strength in simplicity.
Volume Candles By Anil ChawraHow Users Can Make Profit Using This Script:
1. Volume Representation : Each candle on the chart represents a specific time period (e.g., 1 minute, 1 hour, 1 day) and includes information about both price movement and trading volume during that period.
2. Candlestick Anatomy : A volume candle has the same components as a regular candlestick: the body (which represents the opening and closing prices) and the wicks or shadows (which indicate the highest and lowest prices reached during the period).
3. Volume Bars : Instead of just the candlestick itself, volume candles also include a bar or histogram representing the trading volume during that period. The height or length of the volume bar indicates the amount of trading activity.
4. Interpreting Volume : High volume candles typically indicate increased market interest or activity during that period. This could be due to significant buying or selling pressure.
5. Confirmation : Traders often look for confirmation from other technical indicators or price action to validate the significance of a high volume candle. For example, a high volume candle breaking through a key support or resistance level may signal a strong market move.
6. Trend Strength : Volume candles can provide insights into the strength of a trend. A series of high volume candles in the direction of the trend suggests strong momentum, while decreasing volume may indicate weakening momentum or a potential reversal.
7. Volume Patterns : Traders also analyze volume patterns, such as volume spikes or divergences, to identify potential trading opportunities or reversals.
8. Combination with Price Action: Volume analysis is often used in conjunction with price action analysis and other technical indicators to make more informed trading decisions.
9. Confirmation and Validation: It's important to confirm the significance of volume candles with other indicators or price action signals to avoid false signals.
10. Risk Management : As with any trading strategy, proper risk management is crucial when using volume candles to make trading decisions. Set stop-loss orders and adhere to risk management principles to protect your capital.
How the Script Works:
1. Volume Representation : Each candle on the chart represents a specific time period (e.g., 1 minute, 1 hour, 1 day) and includes information about both price movement and trading volume during that period.
2. Candlestick Anatomy : A volume candle has the same components as a regular candlestick: the body (which represents the opening and closing prices) and the wicks or shadows (which indicate the highest and lowest prices reached during the period).
3. Volume Bars : Instead of just the candlestick itself, volume candles also include a bar or histogram representing the trading volume during that period. The height or length of the volume bar indicates the amount of trading activity.
4. Interpreting Volume : High volume candles typically indicate increased market interest or activity during that period. This could be due to significant buying or selling pressure.
5. Confirmation : Traders often look for confirmation from other technical indicators or price action to validate the significance of a high volume candle. For example, a high volume candle breaking through a key support or resistance level may signal a strong market move.
6. Trend Strength : Volume candles can provide insights into the strength of a trend. A series of high volume candles in the direction of the trend suggests strong momentum, while decreasing volume may indicate weakening momentum or a potential reversal.
7. Volume Patterns : Traders also analyze volume patterns, such as volume spikes or divergences, to identify potential trading opportunities or reversals.
8. Combination with Price Action : Volume analysis is often used in conjunction with price action analysis and other technical indicators to make more informed trading decisions.
9. Confirmation and Validation : It's important to confirm the significance of volume candles with other indicators or price action signals to avoid false signals.
10. Risk Management : As with any trading strategy, proper risk management is crucial when using volume candles to make trading decisions. Set stop-loss orders and adhere to risk management principles to protect your capital.
Understanding volume candles can provide valuable insights into market dynamics and help traders make more informed decisions. However, like any technical tool, it's essential to use volume analysis in conjunction with other forms of analysis for comprehensive market assessment.
Understanding volume candles can provide valuable insights into market dynamics and help traders make more informed decisions. However, like any technical tool, it's essential to use volume analysis in conjunction with other forms of analysis for comprehensive market assessment.

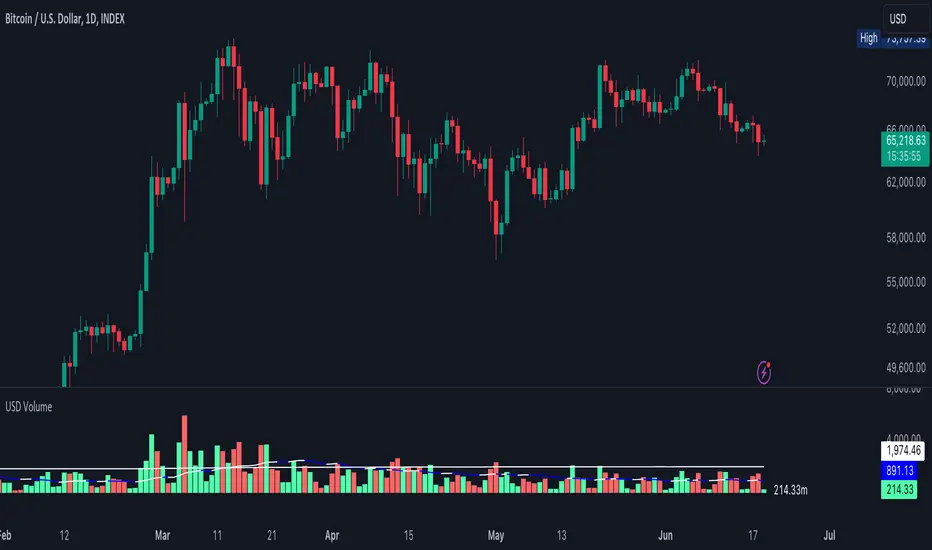
USD VolumeA volume tool but the candles represent Volume in USD Format which is usually
here are some examples of what the numbers represent on the right-hand side.
.01 = $10,000
.5 = $500,000
1 = $1,000,000
50 = $50,000,000
250 = $250,000,000
1000 = $1,000,000,000
The lower line is the "Average Volume" based on lifetime history. Anytime volume is below average, this likely denotes most people have capitulated or the markets have grown bored at these price ranges. A squeeze in volume primes the asset for a big move.
The upper line is the 3rd standard of Deviation from the average line. Anytime volume touches that line or goes higher, this denotes its a very big move relative to how the asset typically trades. If the volume stays above this range for an extended period of time, it would be wise to watch the chart closely and start taking profits off the table whether you're shorting or longing the asset.
1. [Pufferman] - Comprehensive VolumeThis indicator presents a comprehensive approach to volume analysis, incorporating several key metrics to provide traders with a detailed view of market activity. Here's what's included:
1. Cumulative Relative Volume (Intraday): This metric accumulates volume data throughout the day, comparing it to historical session averages up to the current time. It's particularly useful for intraday analysis to determine if the stock is trading high or low volume before the day is over.
2. Real Relative Volume - This feature calculates the relative volume of a stock in comparison to the SPY, offering insight into whether a stock is trading with higher relative volume than the broader market.
3. Configurable Moving Average for Volume: Users can adjust the moving average period for average volume, allowing for flexible adaptation to different trading strategies and time frames. (green line in photo)
4. Above/Below Average Line: This line indicates whether the current volume bar exceeds or falls short of the session's average volume, providing immediate context for volume analysis. (red line in photo).
5. Volume Display in Abbreviations: Actual volume figures are presented in an abbreviated format, using "K" for thousands and "M" for millions, facilitating quick and easy analysis.
6. Color-Coded Relative and Real Relative Volume: Both the Relative Volume (RVOL) and Real Relative Volume (RRVOL) are color-coded to instantly convey volume concentration levels, enhancing visual analysis across multiple charts.
7. Volume Bars with Bullish and Bearish Highlights: Traditional volume bars are color-highlighted according to corresponding candle patterns, aiding in the identification of market sentiment.
Key Points:
The RVOL is a cumulative metric, considering time-of-day volume comparisons for intraday analysis. This approach offers a nuanced understanding of volume patterns specific to the timeframe being viewed.
The RRVOL provides a comparative analysis against the market, offering insights into stock-specific volume activity relative to market trends.
Note: This indicator is designed for intraday analysis and may not function as intended on timeframes above daily due to the cumulative nature of its volume calculations.

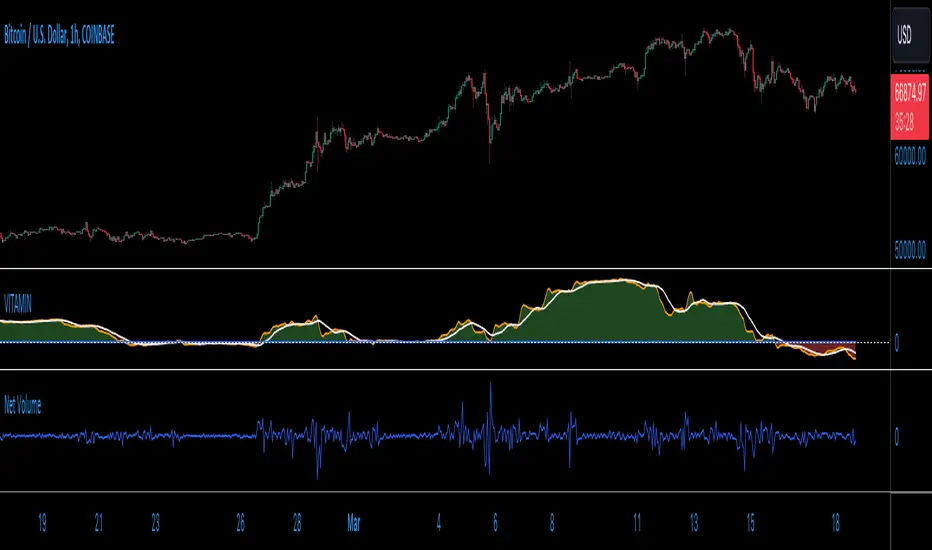
VITAMIN: Volume Insight Trend Analyzer - Multilayered INdicator)Meet VITAMIN, an indicator created mainly to function as a confirmation volume indicator to integrate into strategies as a signal filter, but it can also be used as a general-purpose indicator to enhance market analysis through volume trend insights.
The name was choses to help with recall, with VITAMIN short for "Volume Insight Trend Analyzer - Multilayered INdicator".
The indicator is grounded in the net volume calculation, using TradingView's built-in Net Volume indicator as a starting point, and taking as a series of simple Moving Averages based on the Net Volume data.
Core Features:
Multilayered Analysis: VITAMIN layers multiple moving averages on top of net volume—volume adjusted for price movement direction—to filter market noise and reveal clearer volume trends.
Foundation in Net Volume: The starting point is net volume, which combines volume magnitude with the direction of price changes, offering a baseline for momentum analysis.
Visual Trend Indicators: The indicator uses green and red shading between its moving average layers and a reference zero line to visually denote bullish (green) and bearish (red) volume trends, simplifying the interpretation of market sentiment.
Utility of VITAMIN:
Volume plays a crucial role in market analysis, but interpreting volume directly can be complex due to inherent market noise. Net Volume in particular features a great deal of noise, as a sequence of spikes and dips from bar to bar. My purpose with this indicator was to separate the signal from the noise. VITAMIN's multilayered moving averages provide a smoother, more interpretable trend line that distinguishes significant market moves from short-term fluctuations.
Applications:
Confirming Trends: VITAMIN can help validate price trends. A price uptrend paired with a bullish volume trend indicated by VITAMIN may reinforce the strength of the movement.
Identifying Divergences: Observing discrepancies between price trends and VITAMIN's volume trends can highlight potential reversals or continuations.
Assessing Market Sentiment: The overall trend and colour shading within VITAMIN aims to provide insight into market sentiment.
VITAMIN is designed for simplicity and effectiveness, aiming to provide deeper insights into volume trends, supporting more informed decisions.
Like any indicator featuring moving averages, and averages of those averages, there is a built-in lag to this indicator, but this is the trade-off for removing noise from the signal. Adjust the user inputs to suit your time frame.
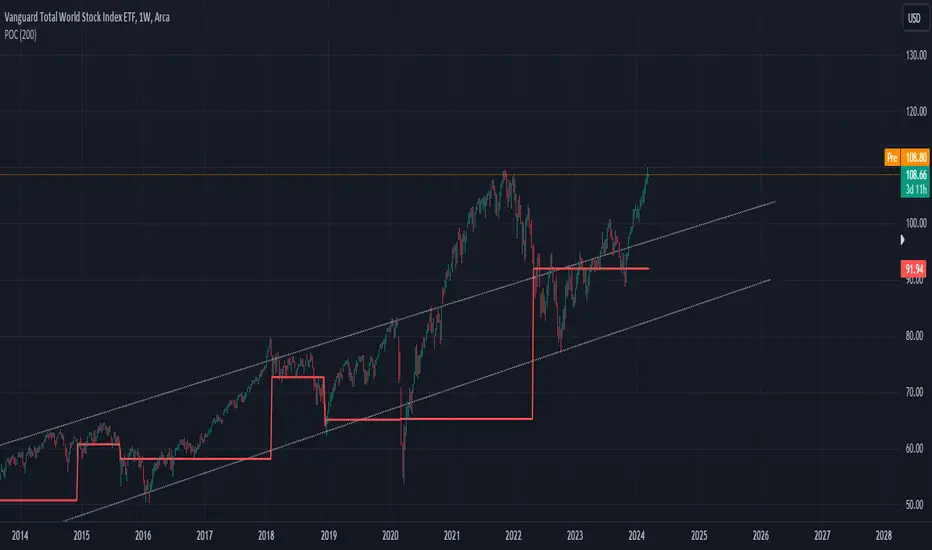
POC IndicatorThis simplified Point of Control (POC) indicator for TradingView is designed to identify and plot the price level where the highest volume of trading occurred over a specified period. The script works as follows:
Input and Initialization: The user specifies a length for the analysis period. Variables highestVolPrice and highestVol are initialized to track the price with the highest volume and the highest volume encountered, respectively.
Volume Analysis Loop: For each bar in the specified period (up to length bars back from the current bar), the script compares the volume of the current bar (volume ) to highestVol. If the current bar's volume is higher, highestVol and highestVolPrice are updated to reflect the volume and closing price of the current bar.
Plotting the POC: Instead of using a horizontal line (hline), which cannot be dynamically updated within the loop, the script uses plot to draw the POC. This plotting function draws a line on the chart that represents the closing price level associated with the highest volume observed within the analysis period.
Resetting Variables: To ensure the indicator updates correctly with each new bar, the script resets highestVol and highestVolPrice at the start of the analysis for each new period. This step is designed to recalculate the POC dynamically as new data comes in.
This approach offers a basic method for visualizing significant price levels where substantial trading activity occurred, potentially indicating areas of strong support or resistance. However, it's a simplified model and does not calculate the true POC based on a detailed volume profile across all price levels within the period.
Cumulative Delta Volume WaveIntroducing an Enhanced Version of the CDV by LonesomeTheBlue
For the original version and description check this link:
What Makes This Version Different than the original?
This enhanced version of the CDV indicator incorporates advanced signal processing techniques to bring new depth to market analysis.
Standard Deviation Bands and EMAs: These additions to the CDV offer a visual representation of significant market movements—highlighting major pumps and dumps, as well as identifying potential support and resistance levels.
Color-Coded Insights: The standard deviation bands utilize color coding based on signal processing principles. This feature becomes increasingly useful the more you zoom out, making it easier to observe and interpret market waves.
Market Maker Activity: By examining fluctuations within the standard deviation bands, traders can gauge when Market Makers are actively maneuvering to establish their long and short positions, often at the expense of retail traders.
EMA Support and Resistance: The embedded Exponential Moving Averages (EMAs) serve as dynamic support and resistance levels. Analyzing these can help traders determine the continuing strength of a market move, whether bullish or bearish.
Visual Guide to the Basics
For a clearer understanding of what this enhanced indicator can show, please refer to the image below:
And in addition to all the above one can detect relevant W and M structures way easier with this indicator ;)

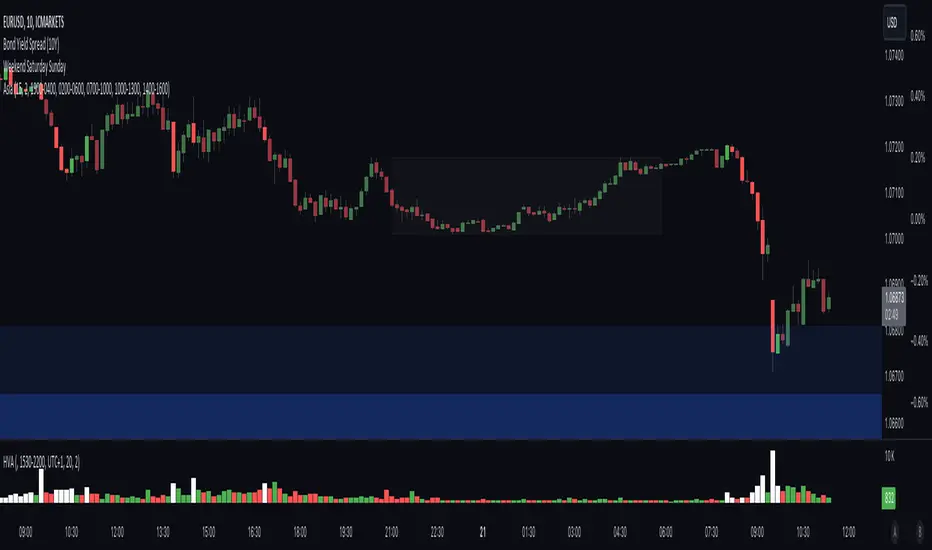
High Volume AlertThe High Volume Alert Script is developed for all traders focusing on volume analysis in their trading strategies, providing alerts for unusually high trading volumes during specified trading sessions.
Functionality:
Volume Moving Average Calculation:
Average Volume = Moving Average(Volume) = Sum of last the x last candles Volume
Where n is the user-defined period for the moving average calculation (denoted as movingaverageinput in the script. This moving average serves as the baseline to compare current volume levels against historical averages.
High Volume Detection:
HighVolume = CurrentVolume >= (MA(Volume) x HighVolumeRatio)
Here, HighVolumeRatio is a user-defined multiplier that sets the threshold for what is considered high volume. If the current volume exceeds this threshold (the product of the moving average of volume and the HighVolumeRatio ), the script identifies this as a high-volume event.
Session Filtering:
The script further refines these alerts by ensuring they only trigger during the specified trading session, enhancing relevance for traders interested in specific market hours. This session is defined by the sess and timezone parameters.
Visualisation and Alerts:
If high volume is detected (HighVolume = True), the script colors the volume bar with the highVolumeColor . If the option is selected, it also changes the color of the candlestick to either highVolumeCandleColorUp (for bullish candles) or highVolumeCandleColorDown (for bearish candles), depending on the price movement within the high-volume period. An alert is generated through the alertcondition function when high volume is detected during the specified session, notifying the trader of potentially significant market activity.
Application in Trading:
This indicator serves traders who prioritize volume as a leading indicator of potential price movement. High trading volumes may indicate the presence of significant market activity, often associated with events like news releases, market openings, or large trades, which can precede price movements.
Originality and Practicality:
This script is self-developed, aiming to fill the gap in automatic ratio adjusted volume alerts within the TradingView environment.
Conclusion:
The High Volume Alert Script is an essential tool for traders who integrate volume analysis into their strategy, offering tailored alerts and visual cues for high volume periods.
Compliance and Limitations:
The script complies with TradingView scripting standards, ensuring no lookahead bias and maintaining real-time data integrity. However, its utility depends on the availability on volume data, and please be aware that forex pairs never offer real volume data, this tool is best used with a exchange traded symbol.
Volume Breakout [Afnan]Introducing the Relative Volume / Volume Breakout Multiplier (RVI) , RVI is specifically designed for traders who incorporate volume breakout analysis into their trading strategies, particularly breakout traders.
This indicator provides a unique perspective on volume dynamics by quantifying the extent of volume breakouts in relation to the Simple Moving Average (SMA). It offers an upgraded version of the default volume indicator on TradingView, with the added feature of Relative Volume.
For example, if the volume SMA is 100M and the current volume is 200M, the indicator will return a breakout number of 2.0, indicating that the current volume is twice that of the volume SMA. Conversely, if the volume SMA is 100M and the current volume is 50M, the indicator will return a value of 0.50, indicating that the current volume is half of the volume SMA.
This tool can be a very helpful for breakout traders, helping them identify potential trading opportunities and assess volume strength more effectively. this indicator is a must-have in the toolkit of any trader who focuses on volume breakout analysis.
Remember, every tool we use, every analysis we perform, is a step towards becoming better traders. So, let’s embrace this journey of continuous learning and improvement together. As the saying goes, “The only limit to our realization of tomorrow will be our doubts of today." Let’s step into the future with confidence, armed with the right tools and the right mindset.
Lastly, a big thank you for your support, your likes, and your comments. They mean a lot! If you have any questions, feel free to ask. Together, let’s make trading a rewarding experience!

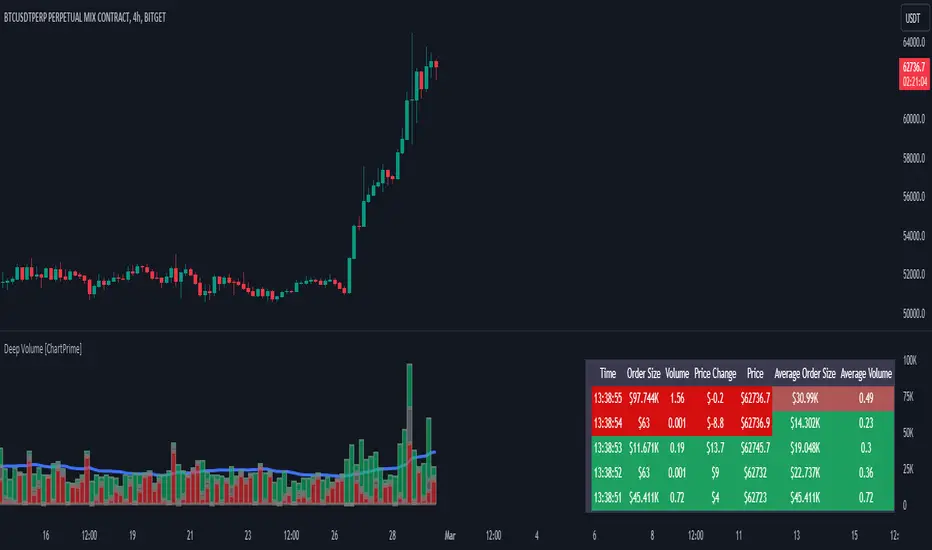
Deep Volume [ChartPrime]Deep Volume is an indicator designed to give you high fidelity volume information. It does this by utilizing real time data provided by Tradingview to generate a wide range of metrics. We have included a convenient column chart to visualize the polarity of the volume, and a table to see the real time data. This works by utilizing pine script's varip feature to get information within candles. This is convenient as it allows users to get lower time frame information without the use of ltf functions. The result is seconds level data with out the need to be on a lower time frame chart. As a result, as you increase the time frame of the chart the updates will become slower. This is because Tradingview doesn't update the chart information as frequently on higher time frames as there isn't as much of a need.
This indicator works on real time data so to compensate for this we generate a simulated history based on candle structure. This helps in estimating the state of the moving average before the real time data starts. As a result the estimated history isn't as accurate and should be treated as such. That being said it is nice to have an estimation when the indicator is first loaded onto the chart.
Finally we have included a cumulative volume comparison that shows you how much volume there is compared to the average cumulative volume for the day. This metric utilizes a gradient to help you interpret the information at a glance. Low daily volume is represented with grays by default, while normal volume and greater is represented with a green color by default.
The table is partitioned into two sections; tick data, and average data. On the left you will see color coded information based on the direction of the move. On the left, the information is color coded based on the average movement direction. You can control how much information is displayed in the table within the indicators settings. This is defaulted to 20 but it can be as long or short as you like. Every new candle open the far left of the table you will see a 🗘 symbol and at the start of a new session you will see a 🗓 symbol.
The included metrics are as follows:
Time: This displays the time of the real time data update.
Time Delta: This displays the elapsed time between updates.
Order Size: This is the volume times the price change between updates.
Volume: This is the volume change for the update.
Price Change: This is the change in price since the last update.
Price: This is the price of the asset at the time of the update.
Speed of Tape: This is the average time delta. Use this to see how quickly the market is moving.
Average Order Size: This is the average order size.
Average Volume: This is the average volume
Volume Ratio: This the the ratio of bullish to bearish volume as expressed by a percent. 100% is all bullish within the window and -100% is all bearish within the window.
Average Price Change: This is the average price change within the window.
Sensitivity: This is a volatility metric designed to show you the price change per 1 volume unit.
Relative Sensitivity: This is a volatility metric designed to show you the average price change per average volume.
Enjoy