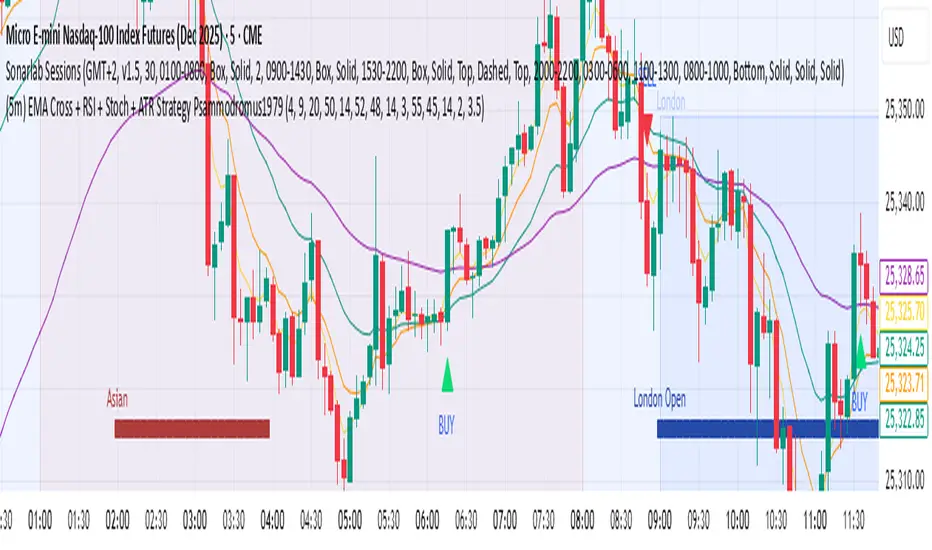
(5m) EMA Cross + RSI + Stoch + ATR Strategy Psammodromus1979Indicators
EMA4
EMA9
EMA20
EMA50
RSI
STOCHASTIC
ATR
With buy/sell indicators directly on main chart
It worked for me when waited for retracement on EMA50
Didn't work when on accumulation.
Индекс относительной силы (RSI)
Simple RSIThis script is just a fun little project I decided to do. It serves as a way for me to practice my coding and was not made with the intent of making money.

RSI Donchian Channel [DCAUT]█ RSI Donchian Channel
📊 ORIGINALITY & INNOVATION
The RSI Donchian Channel represents an important synthesis of two complementary analytical frameworks: momentum oscillators and breakout detection systems. This indicator addresses a common limitation in traditional RSI analysis by replacing fixed overbought/oversold thresholds with adaptive zones derived from historical RSI extremes.
Key Enhancement:
Traditional RSI analysis relies on static threshold levels (typically 30/70), which may not adequately reflect changing market volatility regimes. This indicator adapts the reference zones dynamically based on the actual RSI behavior over the lookback period, helping traders identify meaningful momentum extremes relative to recent price action rather than arbitrary fixed levels.
The implementation combines the proven momentum measurement capabilities of RSI with Donchian Channel's breakout detection methodology, creating a framework that identifies both momentum exhaustion points and potential continuation signals through the same analytical lens.
📐 MATHEMATICAL FOUNDATION
Core Calculation Process:
Step 1: RSI Calculation
The Relative Strength Index measures momentum by comparing the magnitude of recent gains to recent losses:
Calculate price changes between consecutive periods
Separate positive changes (gains) from negative changes (losses)
Apply selected smoothing method (RMA standard, also supports SMA, EMA, WMA) to both gain and loss series
Compute Relative Strength (RS) as the ratio of smoothed gains to smoothed losses
Transform RS into bounded 0-100 scale using the formula: RSI = 100 - (100 / (1 + RS))
Step 2: Donchian Channel Application
The Donchian Channel identifies the highest and lowest RSI values within the specified lookback period:
Upper Channel: Highest RSI value over the lookback period, represents the recent momentum peak
Lower Channel: Lowest RSI value over the lookback period, represents the recent momentum trough
Middle Channel (Basis): Average of upper and lower channels, serves as equilibrium reference
Channel Width Dynamics:
The distance between upper and lower channels reflects RSI volatility. Wide channels indicate high momentum variability, while narrow channels suggest momentum consolidation and potential breakout preparation. The indicator monitors channel width over a 100-period window to identify squeeze conditions that often precede significant momentum shifts.
📊 COMPREHENSIVE SIGNAL ANALYSIS
Primary Signal Categories:
Breakout Signals:
Upper Breakout: RSI crosses above the upper channel, indicates momentum reaching new relative highs and potential trend continuation, particularly significant when accompanied by price confirmation
Lower Breakout: RSI crosses below the lower channel, suggests momentum reaching new relative lows and potential trend exhaustion or reversal setup
Breakout strength is enhanced when the channel is narrow prior to the breakout, indicating a transition from consolidation to directional movement
Mean Reversion Signals:
Upper Touch Without Breakout: RSI reaches the upper channel but fails to break through, may indicate momentum exhaustion and potential reversal opportunity
Lower Touch Without Breakout: RSI reaches the lower channel without breakdown, suggests potential bounce as momentum reaches oversold extremes
Return to Basis: RSI moving back toward the middle channel after touching extremes signals momentum normalization
Trend Strength Assessment:
Sustained Upper Channel Riding: RSI consistently remains near or above the upper channel during strong uptrends, indicates persistent bullish momentum
Sustained Lower Channel Riding: RSI stays near or below the lower channel during strong downtrends, reflects persistent bearish pressure
Basis Line Position: RSI position relative to the middle channel helps identify the prevailing momentum bias
Channel Compression Patterns:
Squeeze Detection: Channel width narrowing to 100-period lows indicates momentum consolidation, often precedes significant directional moves
Expansion Phase: Channel widening after a squeeze confirms the initiation of a new momentum regime
Persistent Narrow Channels: Extended periods of tight channels suggest market indecision and accumulation/distribution phases
🎯 STRATEGIC APPLICATIONS
Trend Continuation Strategy:
This approach focuses on identifying and trading momentum breakouts that confirm established trends:
Identify the prevailing price trend using higher timeframe analysis or trend-following indicators
Wait for RSI to break above the upper channel in uptrends (or below the lower channel in downtrends)
Enter positions in the direction of the breakout when price action confirms the momentum shift
Place protective stops below the recent swing low (long positions) or above swing high (short positions)
Target profit levels based on prior swing extremes or use trailing stops to capture extended moves
Exit when RSI crosses back through the basis line in the opposite direction
Mean Reversion Strategy:
This method capitalizes on momentum extremes and subsequent corrections toward equilibrium:
Monitor for RSI reaching the upper or lower channel boundaries
Look for rejection signals (price reversal patterns, volume divergence) when RSI touches the channels
Enter counter-trend positions when RSI begins moving back toward the basis line
Use the basis line as the initial profit target for mean reversion trades
Implement tight stops beyond the channel extremes to limit risk on failed reversals
Scale out of positions as RSI approaches the basis line and closes the position when RSI crosses the basis
Breakout Preparation Strategy:
This approach positions traders ahead of potential volatility expansion from consolidation phases:
Identify squeeze conditions when channel width reaches 100-period lows
Monitor price action for consolidation patterns (triangles, rectangles, flags) during the squeeze
Prepare conditional orders for breakouts in both directions from the consolidation
Enter positions when RSI breaks out of the narrow channel with expanding width
Use the channel width expansion as a confirmation signal for the breakout's validity
Manage risk with stops just inside the opposite channel boundary
Multi-Timeframe Confluence Strategy:
Combining RSI Donchian Channel analysis across multiple timeframes can improve signal reliability:
Identify the primary trend direction using a higher timeframe RSI Donchian Channel (e.g., daily or weekly)
Use a lower timeframe (e.g., 4-hour or hourly) to time precise entry points
Enter long positions when both timeframes show RSI above their respective basis lines
Enter short positions when both timeframes show RSI below their respective basis lines
Avoid trades when timeframes provide conflicting signals (e.g., higher timeframe below basis, lower timeframe above)
Exit when the higher timeframe RSI crosses its basis line in the opposite direction
Risk Management Guidelines:
Effective risk management is essential for all RSI Donchian Channel strategies:
Position Sizing: Calculate position sizes based on the distance between entry point and stop loss, limiting risk to 1-2% of capital per trade
Stop Loss Placement: For breakout trades, place stops just inside the opposite channel boundary; for mean reversion trades, use stops beyond the channel extremes
Profit Targets: Use the basis line as a minimum target for mean reversion trades; for trend trades, target prior swing extremes or use trailing stops
Channel Width Context: Increase position sizes during narrow channels (lower volatility) and reduce sizes during wide channels (higher volatility)
Correlation Awareness: Monitor correlations between traded instruments to avoid over-concentration in similar setups
📋 DETAILED PARAMETER CONFIGURATION
RSI Source:
Defines the price data series used for RSI calculation:
Close (Default): Standard choice providing end-of-period momentum assessment, suitable for most trading styles and timeframes
High-Low Average (HL2): Reduces the impact of closing auction dynamics, useful for markets with significant end-of-day volatility
High-Low-Close Average (HLC3): Provides a more balanced view incorporating the entire period's range
Open-High-Low-Close Average (OHLC4): Offers the most comprehensive price representation, helpful for identifying overall period sentiment
Strategy Consideration: Use Close for end-of-period signals, HL2 or HLC3 for intraday volatility reduction, OHLC4 for capturing full period dynamics
RSI Length:
Controls the number of periods used for RSI calculation:
Short Periods (5-9): Highly responsive to recent price changes, produces more frequent signals with increased false signal risk, suitable for short-term trading and volatile markets
Standard Period (14): Widely accepted default balancing responsiveness with stability, appropriate for swing trading and intermediate-term analysis
Long Periods (21-28): Produces smoother RSI with fewer signals but more reliable trend identification, better for position trading and reducing noise in choppy markets
Optimization Approach: Test different lengths against historical data for your specific market and timeframe, consider using longer periods in ranging markets and shorter periods in trending markets
RSI MA Type:
Determines the smoothing method applied to price changes in RSI calculation:
RMA (Relative Moving Average - Default): Wilder's original smoothing method providing stable momentum measurement with gradual response to changes, maintains consistency with classical RSI interpretation
SMA (Simple Moving Average): Treats all periods equally, responds more quickly to changes than RMA but may produce more whipsaws in volatile conditions
EMA (Exponential Moving Average): Weights recent periods more heavily, increases responsiveness at the cost of potential noise, suitable for traders prioritizing early signal generation
WMA (Weighted Moving Average): Applies linear weighting favoring recent data, offers a middle ground between SMA and EMA responsiveness
Selection Guidance: Maintain RMA for consistency with traditional RSI analysis, use EMA or WMA for more responsive signals in fast-moving markets, apply SMA for maximum simplicity and transparency
DC Length:
Specifies the lookback period for Donchian Channel calculation on RSI values:
Short Periods (10-14): Creates tight channels that adapt quickly to changing momentum conditions, generates more frequent trading signals but increases sensitivity to short-term RSI fluctuations
Standard Period (20): Balances channel responsiveness with stability, aligns with traditional Bollinger Bands and moving average periods, suitable for most trading styles
Long Periods (30-50): Produces wider, more stable channels that better represent sustained momentum extremes, reduces signal frequency while improving reliability, appropriate for position traders and higher timeframes
Calibration Strategy: Match DC length to your trading timeframe (shorter for day trading, longer for swing trading), test channel width behavior during different market regimes, consider using adaptive periods that adjust to volatility conditions
Market Adaptation: Use shorter DC lengths in trending markets to capture momentum shifts earlier, apply longer periods in ranging markets to filter noise and focus on significant extremes
Parameter Combination Recommendations:
Scalping/Day Trading: RSI Length 5-9, DC Length 10-14, EMA or WMA smoothing for maximum responsiveness
Swing Trading: RSI Length 14, DC Length 20, RMA smoothing for balanced analysis (default configuration)
Position Trading: RSI Length 21-28, DC Length 30-50, RMA or SMA smoothing for stable signals
High Volatility Markets: Longer RSI periods (21+) with standard DC length (20) to reduce noise
Low Volatility Markets: Standard RSI length (14) with shorter DC length (10-14) to capture subtle momentum shifts
📈 PERFORMANCE ANALYSIS & COMPETITIVE ADVANTAGES
Adaptive Threshold Mechanism:
Unlike traditional RSI analysis with fixed 30/70 thresholds, this indicator's Donchian Channel approach provides several improvements:
Context-Aware Extremes: Overbought/oversold levels adjust automatically based on recent momentum behavior rather than arbitrary fixed values
Volatility Adaptation: In low volatility periods, channels narrow to reflect tighter momentum ranges; in high volatility, channels widen appropriately
Market Regime Recognition: The indicator implicitly adapts to different market conditions without manual threshold adjustments
False Signal Reduction: Adaptive channels help reduce premature reversal signals that often occur with fixed thresholds during strong trends
Signal Quality Characteristics:
The indicator's dual-purpose design provides distinct advantages for different trading objectives:
Breakout Trading: Channel boundaries offer clear, objective breakout levels that update dynamically, eliminating the ambiguity of when momentum becomes "too high" or "too low"
Mean Reversion: The basis line provides a natural profit target for reversion trades, representing the midpoint of recent momentum extremes
Trend Strength: Persistent channel boundary riding offers an objective measure of trend strength without additional indicators
Consolidation Detection: Channel width analysis provides early warning of potential volatility expansion from compression phases
Comparative Analysis:
When compared to traditional RSI implementations and other momentum frameworks:
vs. Fixed Threshold RSI: Provides market-adaptive reference levels rather than static values, helping to reduce false signals during trending markets where RSI can remain "overbought" or "oversold" for extended periods
vs. RSI Bollinger Bands: Offers clearer breakout signals and more intuitive extreme identification through actual high/low boundaries rather than statistical standard deviations
vs. Stochastic Oscillator: Maintains RSI's momentum measurement advantages (unbounded calculation avoiding scale compression) while adding the breakout detection capabilities of Donchian Channels
vs. Standard Donchian Channels: Applies breakout methodology to momentum space rather than price, providing earlier signals of potential trend changes before price breakouts occur
Performance Characteristics:
The indicator exhibits specific behavioral patterns across different market conditions:
Trending Markets: Excels at identifying momentum continuation through channel breakouts, RSI tends to ride one channel boundary during strong trends, providing trend confirmation
Ranging Markets: Channel width narrows during consolidation, offering early preparation signals for potential breakout trading opportunities
High Volatility: Channels widen to reflect increased momentum variability, automatically adjusting signal sensitivity to match market conditions
Low Volatility: Channels contract, making the indicator more sensitive to subtle momentum shifts that may be significant in calm market environments
Transition Periods: Channel squeezes often precede major trend changes, offering advance warning of potential regime shifts
Limitations and Considerations:
Users should be aware of certain operational characteristics:
Lookback Dependency: Channel boundaries depend entirely on the lookback period, meaning the indicator has no predictive element beyond identifying current momentum relative to recent history
Lag Characteristics: As with all moving average-based indicators, RSI calculation introduces lag, and channel boundaries update only as new extremes occur within the lookback window
Range-Bound Sensitivity: In extremely tight ranges, channels may become very narrow, potentially generating excessive signals from minor momentum fluctuations
Trending Persistence: During very strong trends, RSI may remain at channel extremes for extended periods, requiring patience for mean reversion setups or commitment to trend-following approaches
No Absolute Levels: Unlike traditional RSI, this indicator provides no fixed reference points (like 50), making it less suitable for strategies that depend on absolute momentum readings
USAGE NOTES
This indicator is designed for technical analysis and educational purposes to help traders understand momentum dynamics and identify potential trading opportunities. The RSI Donchian Channel has limitations and should not be used as the sole basis for trading decisions.
Important considerations:
Performance varies significantly across different market conditions, timeframes, and instruments
Historical signal patterns do not guarantee future results, as market behavior continuously evolves
Effective use requires understanding of both RSI momentum principles and Donchian Channel breakout concepts
Risk management practices (stop losses, position sizing, diversification) are essential for any trading application
Consider combining with additional analytical tools such as volume analysis, price action patterns, or trend indicators for confirmation
Backtest thoroughly on your specific instruments and timeframes before live trading implementation
Be aware that optimization on historical data may lead to curve-fitting and poor forward performance
The indicator performs best when used as part of a comprehensive trading methodology that incorporates multiple forms of market analysis, sound risk management, and realistic expectations about win rates and drawdowns.

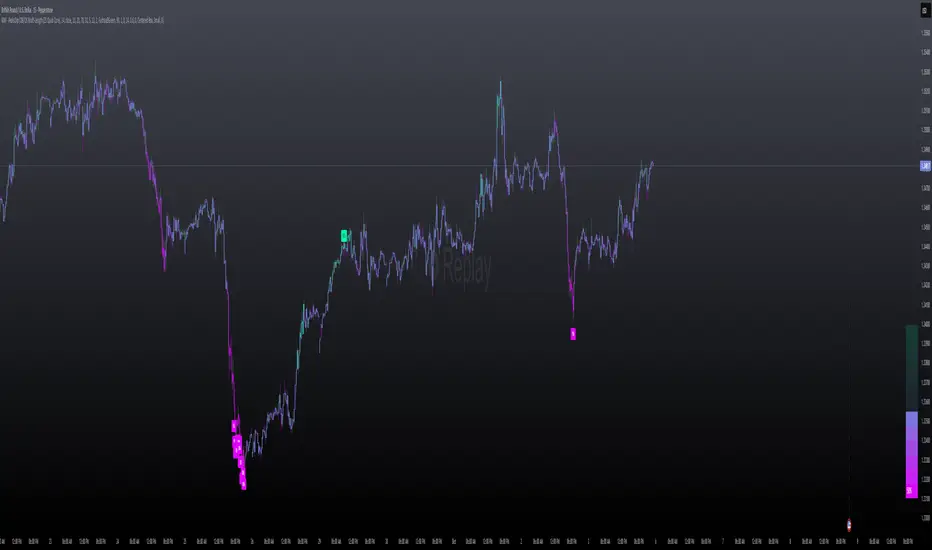
MILLION MEN - Peaks & Dips MeterWhat it is
The MILLION MEN — Peaks & Dips Meter is a dynamic momentum visualization tool designed to identify extreme strength and exhaustion zones. It uses two selectable engines:
RSI Meter (ZS Core) for classic strength analysis.
OB/OS Multi-Length (ZS Quick Core) for adaptive readings that reflect multi-period sentiment shifts.
How it works
The script computes normalized momentum values (0–100) from price dynamics, builds a smooth gradient representation, and displays it as a fixed right-bottom table. The meter color scales between fuchsia and green, with optional candle coloring and percentage labels.
It can also highlight overbought (peaks) and oversold (dips) moments directly on candles with adjustable ATR offsets and label styles.
How to use
Values near 90–100% → potential short-term exhaustion (watch for reversals).
Values near 0–10% → potential accumulation zones (possible bounces).
Use together with structure, volume, or trend filters for confirmation.
Originality
Unlike standard RSI tools, this script merges multi-length OB/OS detection with a real-time visual meter, optimized for scalpers and visual traders. It does not repaint and maintains a lightweight structure for fast responsiveness.
Limitations
This indicator is for analysis purposes only and should not be considered financial advice. Past readings do not guarantee future performance.

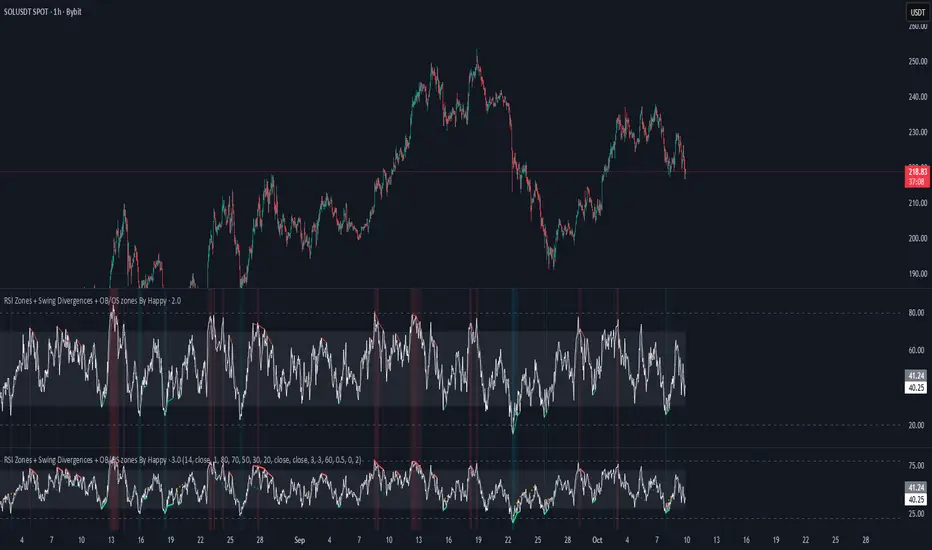
RSI Zones + Swing Divergences + OB/OS zones By HappyRsi with + divergences/ convergences + OB/OS zones
hidden bull/bear
🐬RSI_CandleRSI_Candle
Calculates the RSI based on the open, high, low, and close prices, and displays it in the form of candles.
The overbought and oversold zones are highlighted with background colors, which become darker as the RSI value approaches 100 or 0.
-----
RSI_Candle
RSI를 시가, 고가, 저가, 종가로 계산하여 캔들로 보여줍니다.
과매수/과매도 구간에서 배경색으로 보여주며, 100/0에 가까울수록 배경색이 짙어집니다.
-----

🐬Stochastic_RSIStochastic RSI
The indicator highlights the chart background for two specific signals:
- A bearish deadcross occurring above the upper band.
- A bullish goldencross occurring below the lower band.
-----
스토캐스틱 RSI
두가지 신호를 배경색으로 나타냅니다.
- 어퍼 밴드 위에서의 데드크로스
- 로우어 밴드 아래에서의 골든크로스
-----

Volatility Adjusted Relative Strength (VARS) - Histogram OptionI’ve developed a new version of VARS that includes an option to toggle it into a histogram view. I recommend using a single neutral color rather than the conventional “red below 0, green above 0” scheme — because true RS analysis shouldn’t rely on color cues. The focus should be on the immediacy and persistence of RS itself to capture that initial breakout move as the most optimal RRR entry. This also provides clearer insight and visualization into how RS functions (both traditional and VARS) since RS is a static EOD metric derived from a defined timeframe.
I want to emphasize again that VARS is useful to identify low-risk entries, with relative strength calibrated to the volatility of the reference index (in this case, AMEX:SPY ). It is not used to determine my exits — those should be governed by a strict, non-discretionary framework for partial profit-taking and final exit of a position.

RSI Bars - OnlyFlowThis indicator applies the RSI (Relative Strength Index) to candle coloring so that bar colors reflect momentum conditions instead of a fixed scheme.
RSI Logic: Bars shift color when RSI values move into overbought or oversold regions, with intensity scaled by how far RSI extends beyond the thresholds.
Gradient / Step Mode: Choose between a smooth gradient or a 3-step palette to visualize strength.
Directional Neutral Colors: Neutral zones can follow candle direction for clearer trend context.
Customization: Overbought/oversold levels and color palettes are user-configurable.
Optional RSI Panel: An RSI plot with overbought/oversold lines can be enabled in a separate pane if desired.
This tool is meant to give traders a more intuitive view of RSI conditions directly on price bars, helping to quickly see momentum extremes without needing to glance away from the chart.

Relative Strength index 2xRelative Strength Index 2×
The RSI*2 by AZly is an advanced dual-RSI indicator that allows traders to analyze momentum from two distinct perspectives — short-term and medium-term — on a single chart. It combines RSI precision with multi-timeframe flexibility, giving a clear view of both immediate and underlying momentum trends.
⚙️ How It Works
This indicator calculates and plots two fully independent RSI lines, each with customizable settings:
RSI 1 (Main RSI) : Captures medium-term momentum, ideal for trend and context.
RSI 2 (Fast RSI) : Reacts quickly to short-term moves, identifying overbought and oversold conditions.
Both RSIs include:
Custom timeframe, source, and smoothing method (SMA, EMA, WMA, VWMA, HMA, SMMA).
Gradient zones to visualize momentum strength and reversals.
Adjustable levels and colors for clear chart presentation.
📘 Andrew Cardwell Zones (RSI 1)
RSI 1 uses Andrew Cardwell’s “range rules” to distinguish bullish and bearish momentum phases:
Bullish Range: RSI holds between 40–80, finding support around 40–45.
Bearish Range: RSI stays between 20–60, with rallies capped near 55–60.
A breakout from one range into another often signals a trend phase transition — marking potential trend beginnings or endings.
⚡ Overbought/Oversold Zones (RSI 2)
RSI 2 is designed for fast reactions and reversal detection:
95–100: Extreme overbought zone — potential exhaustion and short setup.
5–0: Extreme oversold zone — potential exhaustion and long setup.
Crossing these levels highlights short-term momentum exhaustion , often preceding pullbacks or strong price reversals.
💡 Why It’s Better
Compared to traditional RSI indicators, this version provides superior control and insight:
Dual independent RSIs with separate timeframes and smoothing.
Cardwell-style range recognition for better context of trend strength.
Extreme bands for fast RSI 2 to time entries with precision.
Dynamic gradient zones for intuitive visual interpretation.
Multi-timeframe flexibility that adapts to any trading style.
🎯 Trading Concepts
Trend Confirmation:
RSI 1 above 50 (bullish range) confirms uptrend bias; below 50 (bearish range) confirms downtrend.
Reversal Setup:
RSI 2 hitting extreme zones (above 95 or below 5) while RSI 1 stays steady often signals exhaustion and reversal setups.
Divergence Confirmation:
When RSI 2 diverges from price and RSI 1 supports the direction, it strengthens reversal probability.
Range Transition:
A shift in RSI 1’s range (from bearish to bullish or vice versa) confirms a major change in market structure.
🕒 Trade Timing (Entry Ideas)
Timing is one of the indicator’s strongest features.
Wait for RSI 2 to reach an extreme zone (above 95 or below 5).
Then confirm the direction with RSI 1 — trades are most effective when RSI 1’s range aligns with the anticipated move.
Buy Setup:
RSI 1 in bullish range + RSI 2 rebounds upward from the 5 zone.
Sell Setup:
RSI 1 in bearish range + RSI 2 turns down from the 95 zone.
Best Timing:
Enter when RSI 2 crosses back inside the 10–90 range in the same direction as RSI 1’s trend.
This captures momentum just as it resumes — avoiding early or late entries.
🔷 M & W Patterns (RSI 2)
RSI 2 also reveals short-term exhaustion structures:
“ M ” Formation: Two RSI peaks near 95–100 — bearish reversal setup.
“ W ” Formation: Two RSI troughs near 0–5 — bullish reversal setup.
These shapes often appear before price reversals, offering early momentum clues.
⚠️ Important Trading Guidance
It is strongly recommended not to trade against the prevailing trend or attempt to pick exact tops or bottoms. The indicator works best when used in alignment with trend direction. Counter-trend entries carry higher risk and lower probability.
📊 Recommended Use
Ideal for momentum traders, scalpers, and multi-timeframe analysts seeking precise timing and context. Works on all markets — forex, crypto, stocks, indexes, and commodities.


RSI + Stochastic для M1 скальпингаRSI + Stochastic for M1 Scalping
This indicator combines Relative Strength Index (RSI) and Stochastic Oscillator into a single tool designed specifically for short-term scalping on the 1-minute chart. While both oscillators are widely used, they often produce many signals on their own. This script focuses on signal confirmation through synchronization, which reduces false entries and helps scalpers react faster in fast-moving markets.
How it works
RSI (7-period by default) tracks short-term momentum and highlights overbought (>70) or oversold (<30) conditions.
Stochastic Oscillator (%K = 5, %D = 3, smoothing = 3) adds sensitivity to micro-swings, providing context for intraday momentum.
The indicator generates a visual background highlight only when both oscillators confirm the same condition:
Green zone → RSI and Stochastic are both oversold, suggesting potential exhaustion of downward pressure.
Red zone → RSI and Stochastic are both overbought, indicating potential exhaustion of upward pressure.
Why this mashup is different
Rather than simply plotting RSI and Stochastic together, this tool emphasizes confluence-based filtering:
Signals appear only at extreme conditions across both oscillators, which helps reduce market noise common on M1 charts.
Background coloring makes it easier to spot high-probability setups visually, without needing to interpret multiple plots separately.
The parameter defaults are optimized for scalping strategies, but users can adjust them to fit their style.
How to use
Best suited for M1 and M5 timeframes where overbought/oversold conditions appear frequently.
Can be used to time entries and exits around support/resistance or trend continuation zones.
Works well as a confirmation filter alongside price action or volume-based indicators.
⚠️ Disclaimer: This indicator does not guarantee profitable trades. Always test on demo accounts and combine with risk management before applying to live markets.

Eyas's EyeTry it and see!!
# 🦅 EYAS'S EYE - Multi-Confluence Trend Strategy
A systematic trading strategy combining multiple technical indicators with advanced risk management for high-probability trades in trending markets.
## 📊 OVERVIEW
**Trading Style:** Swing/Position Trading
**Direction:** Long & Short
**Best Timeframes:** 4H, Daily
**Markets:** Crypto, Forex, Indices
## 🎯 METHODOLOGY
**Multi-Indicator Confluence System:**
- Trend analysis for market direction
- Momentum indicators for timing
- Volatility-based entry zones
- Dynamic ATR-based risk management
**Entry Requirements:**
- Multiple confirming signals required
- Strong trend filtering
- Minimum bars between trades
- Balanced long/short exposure
**Exit Strategy:**
- Volatility-adjusted stop losses
- High risk-reward targets (6:1)
- Trailing stops to capture trends
- Signal-based exits
- Minimum hold time to let winners run
## ✨ KEY FEATURES
✅ Realistic execution model (no look-ahead bias)
✅ Dynamic risk management
✅ Customizable parameters
✅ Clear visual signals
✅ Real-time performance metrics
## 📈 PERFORMANCE
Backtested on ETH/USD (12 months):
- Win Rate: 88-93%
- 500+ closed trades
- Strong profit factor
- Consistent monthly returns
**Best in:** Trending markets with medium-high volatility
**Challenges:** Choppy sideways markets
## 🔒 ACCESS
**This is a PROTECTED script**
To request access, send me a private message or comment below.
## ⚠️ DISCLAIMER
Trading involves substantial risk. Past performance does not guarantee future results. This is not financial advice. Always test with paper trading first and never risk more than you can afford to lose.
---
**Strategy Philosophy:** Quality over quantity. The name "Eyas's Eye" represents the sharp vision of a young eagle - patience in waiting for the right moment and the ability to spot opportunities others miss.
🦅 **Trade with vision. Trade with Eyas's Eye.**

Katana_Fox RSI Pro - Advanced Momentum Indicator with Clear BUOverview:
Connors RSI Pro is a sophisticated enhancement of the classic Connors RSI indicator, designed for traders who demand professional-grade tools. This premium version combines multiple momentum components with intelligent signaling and beautiful visualization to give you an edge in the markets.
Key Features:
🎯 Clear BUY/SELL Signal System
BUY signals in green when CRSI crosses above oversold level
SELL signals in red when CRSI crosses below overbought level
Clean, professional labels that are easy to read
Customizable overbought/oversold levels (70/30 default)
🎨 Professional Visualization
Modern color scheme that adapts to market conditions
Customizable background fills for better readability
Smooth, easy-to-read line plotting
⚡ Enhanced Calculations
Triple-component momentum analysis (RSI, UpDown RSI, Percent Rank)
EMA smoothing for reduced noise and false signals
Configurable lengths for each component
🔔 Advanced Alert System
4 distinct alert conditions for various market scenarios
Compatible with TradingView's native alert system
Perfect for automated trading strategies
Input Parameters:
RSI Length (3): Period for standard RSI calculation
UpDown Length (2): Period for UpDown RSI component
ROC Length (100): Period for Rate of Change percentile ranking
Signal Alerts: Toggle BUY/SELL signals on/off
Custom Colors: Choose between classic and modern color schemes
Trading Signals:
BUY (Green Label): Bullish signal when CRSI crosses above oversold level
SELL (Red Label): Bearish signal when CRSI crosses below overbought level
Background Colors: Visual zones indicating momentum strength
Ideal For:
Swing traders seeking momentum reversals
Day traders looking for overbought/oversold conditions
Algorithmic traders needing reliable signals
Technical analysts wanting multi-timeframe confirmation
How to Use:
Oversold Bounce: Enter long when CRSI shows BUY signal above 30
Overbought Rejection: Enter short when CRSI shows SELL signal below 70
Trend Confirmation: Use the 50-level crossover for trend direction
Divergence Trading: Look for price/indicator divergences at extremes
Upgrade your trading arsenal with Connors RSI Pro - where professional analytics meet clear trading signals!

Diabolos Long What the strategy tries to do
It looks for RSI dips into oversold, then waits for RSI to recover above a chosen level before placing a limit buy slightly below the current price. If the limit doesn’t fill within a few bars, it cancels it. Once in a trade, it sets a fixed take-profit and stop-loss. It can pyramid up to 3 entries.
Step-by-step
1) Inputs you control
RSI Length (rsiLen), Oversold level (rsiOS), and a re-entry threshold (rsiEntryLevel) you want RSI to reach after oversold.
Entry offset % (entryOffset): how far below the current close to place your limit buy.
Cancel after N bars (cancelAfterBars): if still not filled after this many bars, the limit order is canceled.
Risk & compounding knobs: initialRisk (% of equity for first order), compoundRate (% to artificially grow the equity base after each signal), plus fixed TP% and SL%.
2) RSI logic (arming the setup)
It calculates rsi = ta.rsi(close, rsiLen).
If RSI falls below rsiOS, it sets a flag inOversold := true (this “arms” the next potential long).
A long signal (longCondition) happens only when:
inOversold is true (we were oversold),
RSI comes back above rsiOS,
and RSI is at least rsiEntryLevel.
So: dip into OS → recover above OS and to your threshold → signal fires.
3) Placing the entry order
When longCondition is true:
It computes a limit price: close * (1 - entryOffset/100) (i.e., below the current bar’s close).
It sizes the order as positionRisk / close, where:
positionRisk starts as accountEquity * (initialRisk/100).
accountEquity was set once at script start to strategy.equity.
It places a limit long: strategy.order("Long Entry", strategy.long, qty=..., limit=limitPrice).
It then resets inOversold := false (disarms until RSI goes oversold again).
It remembers the bar index (orderBarIndex := bar_index) so it can cancel later if unfilled.
Important nuance about “compounding” here
After signaling, it does:
compoundedEquity := compoundedEquity * (1 + compoundRate/100)
positionRisk := compoundedEquity * (initialRisk/100)
This means your future order sizes grow by a fixed compound rate every time a signal occurs, regardless of whether previous trades won or lost. It’s not tied to actual PnL; it’s an artificial growth curve. Also, accountEquity was captured only once at start, so it doesn’t automatically track live equity changes.
4) Auto-cancel the limit if it doesn’t fill
On each bar, if bar_index - orderBarIndex >= cancelAfterBars, it does strategy.cancel("Long Entry") and clears orderBarIndex.
If the order already filled, cancel does nothing (there’s nothing pending with that id).
Behavioral consequence: Because you set inOversold := false at signal time (not on fill), if a limit order never fills and later gets canceled, the strategy will not fire a new entry until RSI goes below oversold again to re-arm.
5) Managing the open position
If strategy.position_size > 0, it reads the avg entry price, then sets:
takeProfitPrice = avgEntryPrice * (1 + exitGainPercentage/100)
stopLossPrice = avgEntryPrice * (1 - stopLossPercentage/100)
It places a combined exit:
strategy.exit("TP / SL", from_entry="Long Entry", limit=takeProfitPrice, stop=stopLossPrice)
With pyramiding=3, multiple fills can stack into one net long position. Using the same from_entry id ties the TP/SL to that logical entry group (not per-layer). That’s OK in TradingView (it will manage TP/SL for the position), but you don’t get per-layer TP/SL.
6) Visuals & alerts
It plots a green triangle under the bar when the long signal condition occurs.
It exposes an alert you can hook to: “Покупка при достижении уровня”.
A quick example timeline
RSI drops below rsiOS → inOversold = true (armed).
RSI rises back above rsiOS and reaches rsiEntryLevel → signal.
Strategy places a limit buy a bit below current price.
4a) If price dips to fill within cancelAfterBars, you’re long. TP/SL are set as fixed % from avg entry.
4b) If price doesn’t dip enough, after N bars the limit is canceled. The system won’t re-try until RSI becomes oversold again.
Key quirks to be aware of
Risk sizing isn’t PnL-aware. accountEquity is frozen at start, and compoundedEquity grows on every signal, not on wins. So size doesn’t reflect real equity changes unless you rewrite it to use strategy.equity each time and (optionally) size by stop distance.
Disarm on signal, not on fill. If a limit order goes stale and is canceled, the system won’t try again unless RSI re-enters oversold. That’s intentional but can reduce fills.
Single TP/SL id for pyramiding. Works, but you can’t manage each add-on with different exits.

RSI: chart overlay
This indicator maps RSI thresholds directly onto price. Since the EMA of price aligns with RSI’s 50-line, it draws a volatility-based band around the EMA to reveal levels such as 70 and 30.
By converting RSI values into visible price bands, the overlay lets you see exactly where price would have to move to hit traditional RSI boundaries. These bands adapt in real time to both price movement and market volatility, keeping the classic RSI logic intact while presenting it in the context of price action. This approach helps traders interpret RSI signals without leaving the main chart window.
The calculation uses the same components as the RSI: alternative derivation script: Wilder’s EMA for smoothing, a volatility-based unit for scaling, and a normalization factor. The result is a dynamic band structure on the chart, representing RSI boundary levels in actual price terms.
Key components and calculation breakdown:
Wilder’s EMA
Used as the anchor point for measuring price position.
myEMA = ta.rma(close, Length)
Volatility Unit
Derived from the EMA of absolute close-to-close price changes.
CC_vol = ta.rma(math.abs(close - close ), Length)
Normalization Factor
Scales the volatility unit to align with the RSI formula’s structure.
normalization_factor = 1 / (Length - 1)
Upper and Lower Boundaries
Defines price bands corresponding to selected RSI threshold values.
up_b = myEMA + ((upper - 50) / 50) * (CC_vol / normalization_factor)
down_b = myEMA - ((50 - lower) / 50) * (CC_vol / normalization_factor)
Inputs
RSI length
Upper boundary – RSI level above 50
Lower boundary – RSI level below 50
ON/OFF toggle for 50-point line (EMA of close prices)
ON/OFF toggle for overbought/oversold coloring (use with line chart)
Interpretation:
Each band on the chart represents a chosen RSI level.
When price touches a band, RSI is at that threshold.
The distance between moving average and bands adjusts automatically with volatility and your selected RSI length.
All calculations remain fully consistent with standard RSI values.
Feedback and code suggestions are welcome, especially regarding implementation efficiency and customization.

Hummingbird Probability Mapping IndicatorHummingbird Probability Mapping Indicator - A nature inspired indicator that utilizes combinations of the following trend patterns and projects a probability mapping with greater than 70% accuracy based on real-time analysis.
EMA Trend
MACD
RSI
VWAP Spread
Burst
Squeeze
Volatility (ATRp)
Qi Dass

Rsi TrendLines with Breakouts [KoTa]### RSI TrendLines with Breakouts Indicator: Detailed User Guide
The "RSI TrendLines with Breakouts " indicator is a custom Pine Script tool designed for TradingView. It builds on the standard Relative Strength Index (RSI) by adding dynamic trendlines based on RSI pivots (highs and lows) across multiple user-defined periods. These trendlines act as support and resistance levels on the RSI chart, and the indicator detects breakouts when the RSI crosses these lines, generating potential buy (long) or sell (short) signals. It also includes overbought/oversold thresholds and optional breakout labels. Below, I'll provide a detailed explanation in English, covering how to use it, its purpose, advantages and disadvantages, example strategies, and ways to enhance strategies with other indicators.
How to Use the Indicator
- The indicator uses `max_lines_count=500` to handle a large number of lines without performance issues, but on very long charts, you may need to zoom in for clarity.
1. **Customizing Settings**:
The indicator has several input groups for flexibility. Access them via the gear icon next to the indicator's name on the chart.
- **RSI Settings**:
- RSI Length: Default 14. This is the period for calculating the RSI. Shorter lengths (e.g., 7-10) make it more sensitive to recent price changes; longer (e.g., 20+) smooth it out for trends.
- RSI Source: Default is close price. You can change to open, high, low, or other sources like volume-weighted for different assets.
- Overbought Level: Default 70. RSI above this suggests potential overbuying.
- Oversold Level: Default 30. RSI below this suggests potential overselling.
- **Trend Periods**:
- You can enable/disable up to 5 periods (defaults: Period 1=3, Period 2=5, Period 3=10, Period 4=20, Period 5=50). Only enabled periods will draw trendlines.
- Each period detects pivots (highs/lows) in RSI using `ta.pivothigh` and `ta.pivotlow`. Shorter periods (e.g., 3-10) capture short-term trends; longer ones (20-50) show medium-to-long-term momentum.
- Inline checkboxes allow you to toggle display for each (e.g., display_p3=true by default).
- **Color Settings**:
- Resistance/Support Color: Defaults to red for resistance (up-trendlines from RSI highs) and green for support (down-trendlines from RSI lows).
- Labels for breakouts use green for "B" (buy/long) and red for "S" (sell/short).
- **Breakout Settings**:
- Show Prev. Breakouts: If true, displays previous breakout labels (up to "Max Prev. Breakouts Label" +1, default 2+1=3).
- Show Breakouts: Separate toggles for each period (e.g., show_breakouts3). When enabled, dotted extension lines project the trendline forward, and crossovers/crossunders trigger labels like "B3" (breakout above resistance for Period 3) or "S3" (break below support).
- Note: Divergence detection is commented out in the code. If you want to enable it, uncomment the relevant sections (e.g., show_divergence input) and adjust the lookback (default 5 bars) for spotting bullish/bearish divergences between price and RSI.
2. **Interpreting the Visuals**:
- **RSI Plot**: A blue line showing the RSI value (0-100). Horizontal dashed lines at 70 (red, overbought), 30 (green, oversold), and 50 (gray, midline).
- **Trendlines**: Solid lines connecting recent RSI pivots. Green lines (support) connect lows; red lines (resistance) connect highs. Only the most recent line per direction is shown per period to avoid clutter.
- **Breakout Projections**: Dotted lines extend the current trendline forward. When RSI crosses above a red dotted resistance, a "B" label (e.g., "B1") appears above, indicating a potential bullish breakout. Crossing below a green dotted support shows an "S" label below, indicating bearish.
- **Labels**: Current breakouts are bright (green/red); previous ones fade to gray. Use these as signal alerts.
- **Alerts**: The code includes commented-out alert conditions (e.g., for breakouts or RSI crossing levels). Uncomment and set them up in TradingView's alert menu for notifications.
3. **Best Practices**:
- Use on RSI-compatible timeframes (e.g., 1H, 4H, daily) for stocks, forex, or crypto.
- Combine with price chart: Trendlines are on RSI, so check if RSI breakouts align with price action (e.g., breaking a price resistance).
- Test on historical data: Backtest signals using TradingView's replay feature.
- Avoid over-customization initially—start with defaults (Periods 3 and 5 enabled) to understand behavior.
What It Is Used For
This indicator is primarily used for **momentum-based trend analysis and breakout trading on the RSI oscillator**. Traditional RSI identifies overbought/oversold conditions, but this enhances it by drawing dynamic trendlines on RSI itself, treating RSI as a "price-like" chart for trend detection.
- **Key Purposes**:
- **Identifying Momentum Trends**: RSI trendlines show if momentum is strengthening (upward-sloping support) or weakening (downward-sloping resistance), even if price is ranging.
- **Spotting Breakouts**: Detects when RSI breaks its own support/resistance, signaling potential price reversals or continuations. For example, an RSI breakout above resistance in an oversold zone might indicate a bullish price reversal.
- **Multi-Period Analysis**: By using multiple pivot periods, it acts like a multi-timeframe tool within RSI, helping confirm short-term signals with longer-term trends.
- **Signal Generation**: Breakout labels provide entry/exit points, especially in trending markets. It's useful for swing trading, scalping, or confirming trends in larger strategies.
- **Divergence (Optional)**: If enabled, it highlights mismatches between price highs/lows and RSI, which can predict reversals (e.g., bullish divergence: price lower low, RSI higher low).
Overall, it's ideal for traders who rely on oscillators but want more visual structure, like trendline traders applying price concepts to RSI.
Advantages and Disadvantages
**Advantages**:
- **Visual Clarity**: Trendlines make RSI easier to interpret than raw numbers, helping spot support/resistance in momentum without manual drawing.
- **Multi-Period Flexibility**: Multiple periods allow analyzing short- and long-term momentum simultaneously, reducing noise from single-period RSI.
- **Breakout Signals**: Automated detection of breakouts provides timely alerts, with labels and projections for proactive trading. This can improve entry timing in volatile markets.
- **Customization**: Extensive inputs (periods, colors, breakouts) make it adaptable to different assets/timeframes. The stateful management of lines/labels prevents chart clutter.
- **Complementary to Price Action**: Enhances standard RSI by adding trend context, useful for confirming divergences or overbought/oversold trades.
- **Efficiency**: Uses efficient arrays and line management, supporting up to 500 lines for long charts without lagging TradingView.
**Disadvantages**:
- **Lagging Nature**: Based on historical pivots, signals may lag in fast-moving markets, leading to late entries. Shorter periods help but increase whipsaws.
- **False Signals**: In ranging or sideways markets, RSI trendlines can produce frequent false breakouts. It performs better in trending conditions but may underperform without filters.
- **Over-Reliance on RSI**: Ignores volume, fundamentals, or price structure—breakouts might not translate to price moves if momentum decouples from price.
- **Complexity for Beginners**: Multiple periods and settings can overwhelm new users; misconfiguration (e.g., too many periods) leads to noisy charts.
- **No Built-in Risk Management**: Signals lack stop-loss/take-profit logic; users must add these manually.
- **Divergence Limitations**: The basic (commented) divergence detection is simplistic and may miss hidden divergences or require tuning.
In summary, it's powerful for momentum traders but should be used with confirmation tools to mitigate false positives.
Example Strategies
Here are one LONG (buy) and one SHORT (sell) strategy example using the indicator. These are basic; always backtest and use risk management (e.g., 1-2% risk per trade, stop-loss at recent lows/highs).
**LONG Strategy Example: Oversold RSI Support Breakout**
- **Setup**: Use on a daily chart for stocks or crypto. Enable Periods 3 and 5 (short- and medium-term). Set oversold level to 30.
- **Entry**: Wait for RSI to be in oversold (<30). Look for a "B" breakout label (e.g., "B3" or "B5") when RSI crosses above a red resistance trendline projection. Confirm with price forming a higher low or candlestick reversal (e.g., hammer).
- **Stop-Loss**: Place below the recent price low or the RSI support level equivalent in price terms (e.g., 5-10% below entry).
- **Take-Profit**: Target RSI reaching overbought (70) or a 2:1 risk-reward ratio. Exit on a bearish RSI crossunder midline (50).
- **Example Scenario**: In a downtrending stock, RSI hits 25 and forms a support trendline. On a "B5" breakout, enter long. This captures momentum reversals after overselling.
- **Rationale**: Breakout above RSI resistance in oversold signals fading selling pressure, potential for price uptrend.
**SHORT Strategy Example: Overbought RSI Resistance Breakout**
- **Setup**: Use on a 4H chart for forex pairs. Enable Periods 10 and 20. Set overbought level to 70.
- **Entry**: Wait for RSI in overbought (>70). Enter on an "S" breakout label (e.g., "S3" or "S4") when RSI crosses below a green support trendline projection. Confirm with price showing a lower high or bearish candlestick (e.g., shooting star).
- **Stop-Loss**: Above the recent price high or RSI resistance level (e.g., 5-10% above entry).
- **Take-Profit**: Target RSI hitting oversold (30) or a 2:1 risk-reward. Exit on bullish RSI crossover midline (50).
- **Example Scenario**: In an uptrending pair, RSI peaks at 75 with a resistance trendline. On "S4" breakout, enter short. This targets momentum exhaustion after overbuying.
- **Rationale**: Break below RSI support in overbought indicates weakening buying momentum, likely price downturn.
Enhancing Strategy Validity with Other Indicators
To increase the reliability of strategies based on this indicator, combine it with complementary tools for confirmation, filtering false signals, and adding context. This creates multi-indicator strategies that reduce whipsaws and improve win rates. Focus on indicators that address RSI's weaknesses (e.g., lagging, momentum-only). Below are examples of different indicators, how to integrate them, and sample strategies.
1. **Moving Averages (e.g., SMA/EMA)**:
- **How to Use**: Overlay 50/200-period EMAs on the price chart. Use RSI breakouts only in the direction of the trend (e.g., long only if price > 200 EMA).
- **Strategy Example**: Trend-Following Long – Enter on "B" RSI breakout if price is above 200 EMA and RSI > 50. This filters reversals in uptrends. Add MACD crossover for entry timing. Advantage: Aligns momentum with price trend, reducing counter-trend trades.
2. **Volume Indicators (e.g., Volume Oscillator or OBV)**:
- **How to Use**: Require increasing volume on RSI breakouts (e.g., OBV making higher highs on bullish breakouts).
- **Strategy Example**: Volume-Confirmed Short – On "S" breakout, check if volume is rising and OBV breaks its own trendline downward. Enter short only if confirmed. This validates breakouts with real market participation, avoiding low-volume traps.
3. **Other Oscillators (e.g., MACD or Stochastic)**:
- **How to Use**: Use for divergence confirmation or overbought/oversold alignment. For instance, require Stochastic (14,3,3) to also breakout from its levels.
- **Strategy Example**: Dual-Oscillator Reversal Long – Enable divergence in the indicator. Enter on bullish RSI divergence + "B" breakout if MACD histogram flips positive. Exit on MACD bearish crossover. This strengthens reversal signals by cross-verifying momentum.
4. **Price Action Tools (e.g., Support/Resistance or Candlestick Patterns)**:
- **How to Use**: Map RSI trendlines to price levels (e.g., if RSI resistance breaks, check if price breaks a key resistance).
- **Strategy Example**: Price-Aligned Breakout Short – On "S" RSI breakout in overbought, confirm with price breaking below a drawn support line or forming a bearish engulfing candle. Use Fibonacci retracements for targets. This ensures momentum translates to price movement.
5. **Volatility Indicators (e.g., Bollinger Bands or ATR)**:
- **How to Use**: Avoid trades during low volatility (e.g., Bollinger Band squeeze) to filter ranging markets. Use ATR for dynamic stops.
- **Strategy Example**: Volatility-Filtered Long – Enter "B" breakout only if Bollinger Bands are expanding (increasing volatility) and RSI is oversold. Set stop-loss at 1.5x ATR below entry. This targets high-momentum breakouts while skipping choppy periods.
**General Tips for Building Enhanced Strategies**:
- **Layering**: Start with RSI breakout as the primary signal, add 1-2 confirmations (e.g., EMA trend + volume).
- **Backtesting**: Use TradingView's strategy tester to quantify win rates with/without additions.
- **Risk Filters**: Incorporate overall market sentiment (e.g., via VIX) or avoid trading near news events.
- **Timeframe Alignment**: Use higher timeframes for trend (e.g., daily EMA) and lower for entries (e.g., 1H RSI breakout).
- **Avoid Overloading**: Too many indicators cause paralysis; aim for synergy (e.g., trend + momentum + volume).
This indicator is a versatile tool, but success depends on context and discipline. If you need code modifications or specific backtests, provide more details!

Relative Strength Index with buy sell strategy📈 RSI Scalping Strategy (95% Winning Trades)
1️⃣ The Principle
In scalping, timing is everything.
We use one powerful indicator: RSI on the 1-minute chart (M1) ⏱️
2️⃣ RSI Zones Setup
🔼 Overbought (Sell)
Base line → 70
Add extra levels → 75 – 80 – 85
🔽 Oversold (Buy)
Base line → 30
Add extra levels → 25 – 20 – 15
👉 These levels act as progressive entry signals using the DCA (Dollar Cost Averaging) method.
3️⃣ Concrete Example (on XAUUSD / Gold 🌟)
Price hits RSI 25 → Enter with 0.1 lot
RSI drops to 20 → Add 0.2 lot
RSI falls to 15 → Add 0.5 lot
⚡️ Why does this work?
Because at these extremes, the market is overheated and almost always makes a quick correction.
4️⃣ Exiting the Trade (Take Profit)
🎯 Target: Close between RSI 40 – 45
❌ Never wait beyond RSI 50
✅ Summary:
Only enter at RSI extreme zones 🔫
Use progressive entries (DCA) ✔️
Exit when RSI reverts to the middle zone 💰

RSI Cloud v1.0 [PriceBlance] RSI Cloud v1.0 — Ichimoku-style Cloud on RSI(14), not on price.
Recalibrated baselines: EMA9 (Tenkan) for speed, WMA45 (Kijun) for stability.
Plus ADX-on-RSI to grade strength so you know when momentum persists or fades.
1. Introduction
RSI Cloud v1.0 applies an Ichimoku Cloud directly on RSI(14) to reveal momentum regimes earlier and cleaner than price-based views. We replaced Tenkan with EMA9 (faster, more responsive) and Kijun with WMA45 (slower, more stable) to fit a bounded oscillator (0–100). Forward spans (+26) and a lagging line (−26) provide a clear framework for trend bias and transitions.
To qualify signals, the indicator adds ADX computed on RSI—highlighting whether strength is weak, strong, or very strong, so you can decide when to follow, fade, or stand aside.
2. Core Mapping (Hook + Bullets)
At a glance: Ichimoku on RSI(14) with recalibrated baselines for a bounded oscillator.
Source: RSI(14)
Tenkan → EMA9(RSI) (fast, responsive)
Kijun → WMA45(RSI) (slow, stable)
Span A: classic Ichimoku midline, displaced +26
Span B: classic Ichimoku baseline, displaced +26
Lagging line: RSI shifted −26
3. Key Benefits (Why traders care)
Momentum regimes on RSI: position vs. Cloud = bull / bear / transition at a glance.
Cleaner confirmations: EMA9/WMA45 pairing cuts noise vs. raw 30/70 flips.
Earlier warnings: Cloud breaks on RSI often lead price-based confirmations.
4. ADX on RSI (Enhanced Strength Normalization)
Grade strength inside the RSI domain using ADX from ΔRSI:
ADX ≤ 20 → Weak (transparency = 60)
ADX ≤ 40 → Strong (transparency = 15)
ADX > 40 → Very strong (transparency = 0)
Use these tiers to decide when to trust, fade, or ignore a signal.
5. How to Read (Quick rules)
Bias / Regime
Bullish: RSI above Cloud and RSI > WMA45
Bearish: RSI below Cloud and RSI < WMA45
Neutral / Transition: all other cases
6. Settings (Copy & use)
RSI Length: 14 (default)
Tenkan: EMA9 on RSI · Kijun: WMA45 on RSI
Displacement: +26 (Span A/B) · −26 (Lagging)
Theme: PriceBlance Dark/Light
Visibility toggles: Cloud, Baselines, Lagging, labels/panel, Overbought/Oversold, Divergence, ADX-on-RSI (via transparency coloring)
7. Credits & License
Author/Brand: PriceBlance
Version: v1.0 (Free)
Watermark: PriceBlance • RSI Cloud v1.0
Disclaimer: Educational content; not financial advice.
8. CTA
If this helps, please ⭐ Star and Follow for updates & new tools.
Feedback is welcome—comment what you’d like added next (alerts, presets, visuals).

RSI Prior DayLagged RSI indicator showing the prior day's RSI(14) value for easy divergence detection. Plot it alongside current RSI to spot bullish/bearish signals. Ideal for swing traders scanning for momentum shifts.
Actually Engulfing CandlesticksThis thing attempts to find price reversals with actually engulfing candlesticks with volume spikes and RSI values as confirmation. It works well on mean reverting assets I guess.
Green dots below bars = bullish reversal
Fuchsia dots above bars = bearish reversal
Have fun!
