Mayfair Fx Scalper✅ Mayfair FX Scalper — By EastWave Capital
The Mayfair FX Scalper is a precision-focused, closed-source indicator designed for short-term intraday trading, particularly scalping on lower timeframes such as 1-minute, 3-minute, and 5-minute charts. This tool is developed by EastWave Capital and is based on a combination of Relative Strength Index (RSI) extremes and specific candlestick structure patterns to detect potential exhaustion and reversal points in the market.
🔍 How It Works:
The algorithm operates by evaluating three core elements:
RSI Extremes:
RSI is calculated using default settings.
Buy signals are considered only when the RSI on the previous candle is below 22 (oversold), and the current candle is bullish, while the previous one was bearish.
Sell signals are considered when the RSI on the previous candle is above 78 (overbought), and the current candle is bearish, while the previous one was bullish.
Candle Confirmation Logic:
The system waits for candle confirmation (e.g., shift in bullish/bearish structure) rather than triggering signals based on RSI alone.
This avoids false triggers in strong trends and filters weak entries.
SL/TP Estimation (Visual):
While not automatically placing orders, the indicator can optionally display lines or small labels showing a Stop Loss at the previous swing high/low (±0.5) and TP levels at 1R, 2R, and 3R based on that stop.
These visual aids help traders plan risk/reward and exits manually.
📈 How to Use:
Timeframes: Best suited for 1M, 3M, and 5M charts
Markets: Works well on Gold (XAU/USD), Forex majors, Indices, and Crypto
Session: Performs best during high volatility sessions (London & NY)
Use Case:
Wait for a signal label to appear after a clear momentum move.
Confirm price action and trend context.
Use provided visual SL/TP labels or apply your manual RR planning.
Combine with structure breaks, FVG zones, or liquidity sweeps for confluence.
⚠️ Important Notes:
This indicator does not repaint.
No automatic trades are executed. Signals are visual.
Not intended for use in isolation; best when combined with proper trade management and confirmation tools.
Past performance does not guarantee future results. Always manage risk appropriately
Индекс относительной силы (RSI)

RSI de Loquy H4 (HMA + ALMA + Régression)📌 Indicator Name: RSI de Loquy H4 (HMA + ALMA + Regression)
🧠 Description:
This custom indicator is designed for H4 (4-hour) timeframes and combines advanced smoothing techniques to refine RSI analysis:
✅ HMA (Hull Moving Average) is applied to the price before computing the RSI. This helps reduce noise and respond faster to price action compared to traditional moving averages.
✅ The resulting RSI is recalibrated to a symmetrical range from -100 to +100, making trend bias more visually intuitive.
✅ A second smoothing using ALMA (Arnaud Legoux Moving Average) is applied to the recalibrated RSI for enhanced signal clarity.
✅ A linear regression line is plotted on the recalibrated RSI to help detect directional momentum and trend shifts.
📈 Visual Features:
Cyan line: RSI mapped from -100 to +100
Orange line: ALMA smoothed RSI
White line: Linear regression of RSI
Reference zones:
+70: Potential oversold (buy watch)
0: Neutral line
–70: Potential overbought (sell watch)
⚙️ Optimized for H4 timeframe, but adaptable for other timeframes with parameter tuning.

RSI de Loquy H4 (2 ALMA + Régression) Loquy RSI H4 (2 ALMA + Regression)
An advanced RSI indicator optimized for 4-hour trading.
Combines multiple smoothing techniques to better filter signals and detect trend reversals more reliably:
🔧 Components:
Recalibrated RSI: based on an ALMA-smoothed price, centered around 0 and scaled to oscillate between -100 and +100.
ALMA on recalibrated RSI: dynamic smoothing to reduce false signals.
Linear regression: highlights the momentum direction.
Custom overbought/oversold zones: ±60 levels tailored for swing trading.
📈 How to use:
🔼 Bullish signal:
RSI crosses above its ALMA, regression turns positive, and RSI exits oversold zone (-60).
🔽 Bearish signal:
RSI crosses below its ALMA, regression turns negative, and RSI exits overbought zone (+60).
✅ Benefits:
More readable and symmetric than a classic RSI.
Reduced noise thanks to ALMA smoothing.
Ideal for swing and trend-following strategies on the H4 timeframe.
Works well on Forex, crypto, indices, and more.

RSI-CCI Momentum ScreenerRSI-CCI Momentum Screener;
How to Use:
Apply this script to 1H or 4H timeframe
Works well for NSE stocks, crypto, or forex
Look for a green label “BUY” that shows when the screener conditions are met

FFI WEALTHFFI Wealth: Monthly RSI-Based Entry/Exit Tool
This indicator visualizes monthly RSI levels on any chart timeframe by coloring candles and marking entry/exit signals. It uses RSI (14) calculated on the monthly timeframe to reflect long-term momentum:
🔹 Candle Coloring Based on Monthly RSI:
Dark Red: RSI ≤ 20
Light Red: RSI 21–40
Yellow: RSI 41–59 (neutral)
Light Green: RSI 60–80
Dark Green: RSI > 80
🔹 Buy Signal: When monthly RSI crosses above 50
🔹 Sell Signal: When monthly RSI crosses below 50
Entry and exit levels are shown with labels and dotted horizontal lines on the chart. These signals can help traders align with broader trend momentum while trading lower timeframes.
⚠️ Disclaimer:
This tool is for educational and informational purposes only. It does not guarantee profits or trading success. Always use risk management and do your own analysis before trading. for any doubt contact 8007280721

BERLIN-MAX 1V.5BERLIN-MAX 1V.5 is a comprehensive trading indicator designed for TradingView that combines multiple advanced strategies and tools. It integrates EMA crossover signals, UT Bot logic with ATR-based trailing stops, customizable stop-loss and target multipliers per timeframe, Hull Moving Averages with color-coded trends, linear regression channels for support and resistance, and a multi-timeframe RSI and volume signal table. This script aims to provide clear entry and exit signals for scalping and swing trading, enhancing decision-making across different market conditions.

RSI Slope RibbonThe RSI Slope Ribbon is an advanced momentum indicator designed to visually highlight shifts in market momentum by comparing the slopes of two RSI calculations: a fast RSI and a slow RSI. Unlike standard RSI indicators that track price strength, this script focuses on the rate of change (slope) of these RSI values, offering a dynamic way to identify evolving market trends earlier.
Key Features:
Dual RSI Periods: Calculates both a short-term (fast) and a long-term (slow) RSI, allowing users to see momentum shifts across different timeframes.
Slope Calculation with SWMA Smoothing: Instead of raw RSI values, the indicator derives the slope of each RSI (current minus previous value) and smooths these slopes using a Symmetrically Weighted Moving Average to reduce noise and volatility spikes.
Oscillator Normalization: Slopes are normalized over a configurable lookback window, making comparisons intuitive and visually consistent regardless of market conditions.
Ribbon Visualization: A colored ribbon fills the area between the normalized fast and slow RSI slopes:
Green when short-term momentum exceeds long-term momentum (suggesting bullish conditions).
Red when short-term momentum lags behind long-term momentum (indicating bearish conditions).
Critical Levels: Horizontal lines marking overbought (80), oversold (20), and neutral (50) zones aid traders in judging the strength and extremes of momentum shifts.
Usage and Interpretation:
The crossover of the fast slope above the slow slope signals a potential bullish momentum shift.
Conversely, a fast slope crossing below the slow slope may indicate bearish momentum onset.
The normalized scale lets traders quickly assess whether momentum changes occur near critical overbought or oversold thresholds.
Adjustable input parameters (RSI lengths, smoothing period, normalization window, and price type) enable customization suited for various assets and trading styles.

RSI Multi TFThis script, created by Srinivas, is a customizable Multi-Timeframe RSI (Relative Strength Index) indicator.
📊 It displays RSI values from:
The current chart timeframe
Two additional user-selected timeframes (e.g., Daily, 15-minute, Weekly, etc.)
🔍 Features:
Visual comparison of RSI across 3 timeframes
User inputs for RSI period, upper/lower bounds, and timeframes
Optional background highlights when all RSIs are simultaneously overbought or oversold
🎯 Ideal for traders who want:
Multi-timeframe confirmation of RSI signals
Better context for overbought/oversold conditions
Improved decision-making with cross-timeframe momentum analysis
ℹ️ RSI values are plotted in different colors for clarity, and threshold bands (default 60/40) are shown with optional shading.

RSI with Divergence and Custom Bullish/Bearish RangesRSI indicator with bullish and bearish shaded ranges accounting for:
- tendency of RSI to peak lower than usual and drop lower than usual in bearish trends
- tendency of RSI to peak higher than usual and bottom out higher than usual in bullish trends

Advanced Supertrend StrategyA comprehensive Pine Script v5 strategy featuring an enhanced Supertrend indicator with multiple technical filters, risk management, and advanced signal confirmation for automated trading on TradingView.
## Features
- **Enhanced Supertrend**: Configurable ATR-based trend following with improved accuracy
- **RSI Filter**: Optional RSI-based signal filtering to avoid overbought/oversold conditions
- **Moving Average Filter**: Trend confirmation using SMA/EMA/WMA with customizable periods
- **Risk Management**: Built-in stop-loss and take-profit based on ATR multiples
- **Trend Strength Analysis**: Filters weak signals by requiring minimum trend duration
- **Breakout Confirmation**: Optional price breakout validation for stronger signals
- **Visual Interface**: Comprehensive chart plotting with multiple indicator overlays
- **Advanced Alerts**: Multiple alert conditions with detailed signal information
- **Backtesting**: Full strategy backtesting with commission and realistic execution

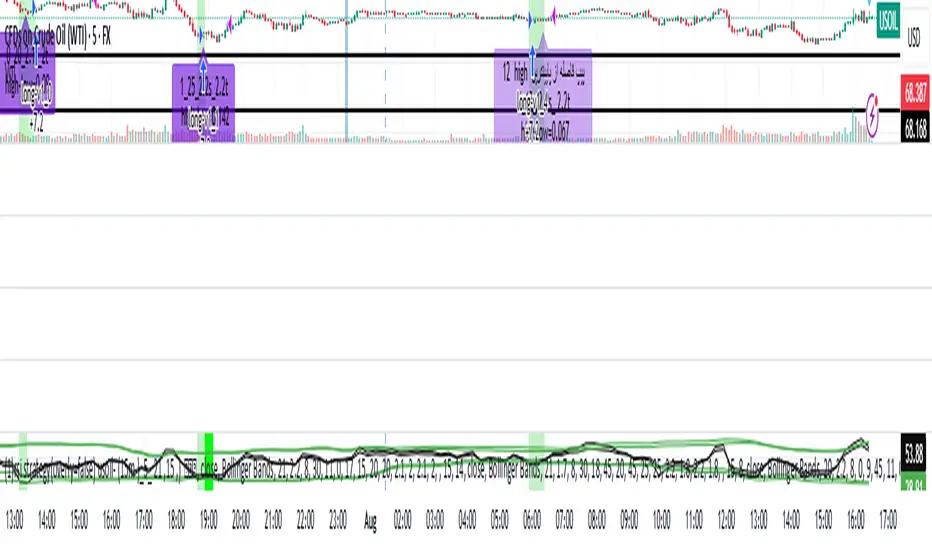
rsi indicator strategyRSIBB Strategy Based on Oversold, Overrbuy Bolinger Band Band. In usoil . Time Indicators is set and the timing is in 5 minutes
An example of Long. When the green marker appears, our entry point is High High If the price fails to reject our High High, our entry will change to the next candlestick. This process will continue until we enter the position.
A marker appears in purple when the green marker appears to us, in which information appears:
The first digit related to the strategist code
The second digit is that we have a few pips to be sure of the candlestick of our entry point
The third digit is our SL that is a coefficient of overall size of yogurt (HIGH - LOW)
Charmin is the digit of our tp that is a coefficient of overall size of yogurt (HIGH - LOW)
In 6 sets
استراتژی RSIBB بر اساس اشباع فروش، اشباع خرید، باند بولینگر. در این روش، اندیکاتورهای زمانی تنظیم شده و زمانبندی ۵ دقیقه است.
مثالی از موقعیت خرید. وقتی نشانگر سبز ظاهر میشود، نقطه ورود ما High است. اگر قیمت نتواند High ما را رد کند، ورود ما به کندل بعدی تغییر میکند. این فرآیند تا زمانی که وارد موقعیت شویم ادامه خواهد داشت.
وقتی نشانگر سبز برای ما ظاهر میشود، یک نشانگر به رنگ بنفش ظاهر میشود که در آن اطلاعات زیر ظاهر میشود:
رقم اول مربوط به کد استراتژیست است.
رقم دوم این است که ما چند پیپ برای اطمینان از کندل نقطه ورود خود داریم.
رقم سوم SL ما است که ضریبی از اندازه کلی ماست (HIGH - LOW) است.
چارمین رقم tp ما است که ضریبی از اندازه کلی ماست (HIGH - LOW) است.
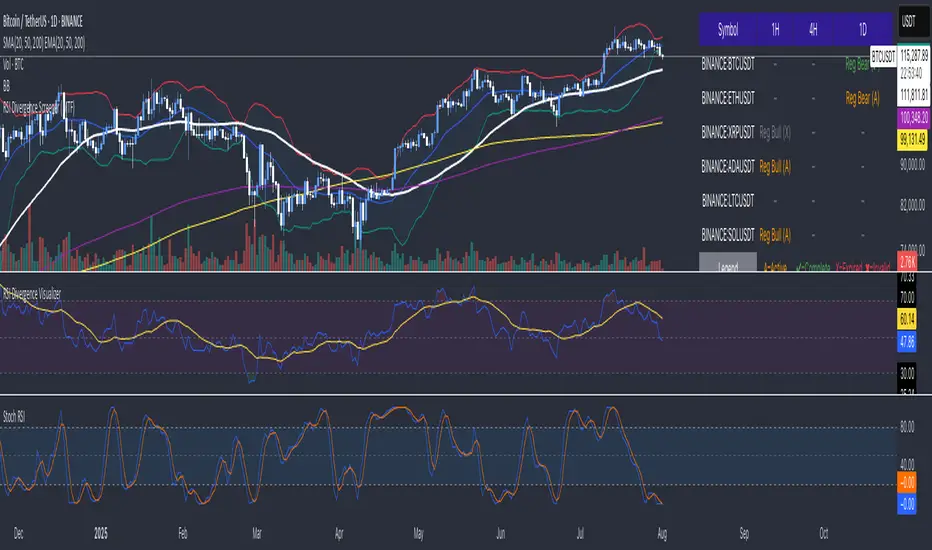
RSI Divergence Visualizer
This indicator is a powerful tool for spotting potential trend reversals by automatically identifying and visualizing RSI divergences. It plots both regular bullish and bearish divergences directly on the chart and in the RSI pane, drawing clear lines to connect the relevant pivot points on both the price and the oscillator.
The visualizer also includes several features to enhance your analysis:
RSI and SMA: The standard RSI line is plotted along with an RSI SMA (Simple Moving Average) to help you gauge the overall trend and momentum.
Color-Coded Zones: Clear color-coded zones for overbought (red), oversold (green), and neutral (purple) conditions are displayed, making it easy to see when the RSI is reaching extremes.
Customization: You can adjust the RSI Length, Smoothing Length, and Pivot Lookback sensitivity to fine-tune the indicator to your specific trading strategy and timeframe.
Future Features
Expanded Divergence Types: The indicator will be enhanced to detect Hidden Bullish and Hidden Bearish divergences, which signal trend continuation. This will provide a more comprehensive view of potential trading opportunities.
Advanced Confirmation Logic: We will introduce new options to confirm a divergence, giving you greater control:
RSI Level Confirmation: The ability to specify any RSI level (e.g., 30 or 70) for confirmation, rather than being limited to the midpoint of 50.
Price Action Confirmation: A divergence will be marked as complete when the price breaks out above the previous pivot high for a bullish divergence or breaks down below the previous pivot low for a bearish divergence. This is a powerful signal that the trend has reversed.

RSI Divergence Screener (MTF)
This powerful screener identifies RSI divergences across multiple symbols and timeframes, presenting the results in a clean, easy-to-read table. It screens for both regular bullish and bearish divergences, allowing you to quickly spot potential trend reversals.
The screener tracks the status of each divergence, categorizing it as:
Active (A): A divergence has formed and is still developing.
Complete (✔): The divergence has been confirmed (optionally, by the RSI crossing the 50 midpoint).
Expired (X): The divergence has persisted for too long without confirmation.
Invalidated (✖): A new high or low has been made, nullifying the divergence.
With customizable settings for RSI length, divergence sensitivity, and the ability to select up to six symbols and three timeframes, this tool is ideal for traders who want to monitor multiple markets efficiently.
Future Features
Expanded Divergence Types: The indicator will be enhanced to detect Hidden Bullish and Hidden Bearish divergences, which signal trend continuation. This will provide a more comprehensive view of potential trading opportunities.
Advanced Completion Flags: Users will have greater control over how a divergence is confirmed. New options will include:
RSI Level Confirmation: The ability to specify any RSI level (e.g., 30 or 70) for completion, rather than being limited to the midpoint of 50.
Breakout/Breakdown Confirmation: A divergence will be marked as complete when the price breaks out above the previous pivot high for a bullish divergence, or breaks down below the previous pivot low for a bearish divergence. This is a powerful signal that the trend has reversed.
VIX Filter/RSI/EMA Bias/Cum-TICK w/ Exhaustion Zone DashboardThis all-in-one dashboard gives intraday traders a real-time visual read of market conditions, combining volatility regime, trend bias, momentum exhaustion, and internal strength — all in a fully customizable overlay that won’t clutter your chart.
📉 VIX Market Regime Detector
Identifies "Weak", "Normal", "Volatile", or "Danger" market states based on customizable VIX ranges and symbol (e.g., VXN or VIX).
📊 RSI Momentum Readout
Displays real-time RSI from any selected timeframe or symbol, with adjustable length, OB/OS thresholds, and color-coded exhaustion alerts.
📈 EMA Trend Bias Scanner
Compares fast and slow EMAs to define bullish or bearish bias, using your preferred timeframe, symbol, and EMA lengths — ideal for multi-timeframe setups.
🧠 Cumulative TICK Pressure & Exhaustion Engine
Analyzes internal market strength using cumulative TICK data to classify conditions as:
-Strong / Mild Bullish or Bearish Pressure
-Choppy / No Edge
-⚠️ Exhaustion Zones — when raw TICK values hit extreme highs/lows, a separate highlight box appears in the dashboard, warning of potential turning points
All logic is customizable, including TICK symbol, timeframes, thresholds, and lookback periods.
Scalpers and day traders who want fast, visual insight into market internals, exhaustion, and trend bias.

ZigZag Based RSIDescription
ZigZag Trend RSI (ZZ-RSI) is an advanced momentum indicator that combines ZigZag-based trend detection with a trend-adjusted RSI to deliver smarter overbought and oversold signals. Unlike traditional RSI that reacts purely to price movement, this indicator adapts its sensitivity based on the prevailing trend structure identified via the ZigZag pattern.
By dynamically adjusting RSI thresholds according to market direction, ZZ-RSI helps filter out false signals and aligns RSI readings with broader trend context—crucial for trend-following strategies, counter-trend entries, and volatility-based timing.
Core Components
ZigZag Pattern Recognition:
Identifies significant swing highs and lows based on price deviation (%) and pivot sensitivity (length). The most recent pivot determines the prevailing trend direction:
🟢 Bullish: last swing is a higher high
🔴 Bearish: last swing is a lower low
⚪ Neutral: no recent significant movement
Trend-Weighted RSI:
Modifies traditional RSI input by emphasizing price changes in the direction of the trend:
In bull trends, upside moves are magnified.
In bear trends, downside moves are emphasized.
Dynamic RSI Zones:
Overbought and Oversold thresholds adapt to the trend:
In uptrends: higher OB and slightly raised OS → tolerate stronger rallies
In downtrends: lower OS and slightly reduced OB → accommodate stronger sell-offs
In neutral: default OB/OS values apply
How to Use
✅ Entries (Reversal or Mean Reversion Traders):
Look for oversold signals (green triangle) in downtrends or neutrals to catch potential reversals.
Look for overbought signals (red triangle) in uptrends or neutrals to fade momentum.
Confirm with price action or volume for higher conviction.
📈 Trend Continuation (Momentum or Trend-Followers):
Use the trend direction label (Bullish / Bearish / Neutral) to align your trades with the broader move.
Combine with moving averages or price structure for entry timing.
Avoid counter-trend signals unless confirmed by divergence or exhaustion.
🧠 Signal Interpretation Table (top right of chart):
Trend: Indicates the current market direction.
RSI: Real-time trend-adjusted RSI value.
Signal: OB/OS/Neutral classification.
Customization Options
ZigZag Length / Deviation %:
Adjust pivot sensitivity and filter out minor noise.
RSI Length:
Controls how fast RSI responds to trend-adjusted price.
Color Settings:
Personalize visual cues for trend direction and OB/OS backgrounds.
Alerts Included
📢 Overbought/oversold conditions
🔄 Trend reversals (bullish or bearish shift)
These alerts are ideal for automated strategies, mobile notifications, or algorithmic workflows.
Ideal For
Traders seeking smarter RSI signals filtered by market structure
Trend-followers and swing traders looking for reliable reversals
Those frustrated with false OB/OS signals in volatile or trending markets
Best Practices
Use in confluence with price structure, trendlines, or S/R levels.
For intraday: consider lowering ZigZag Length and RSI Length.
For higher timeframes: use higher deviation % and smoother RSI to reduce noise.

RSI and MACD Divergence IndicatorThe RSI and MACD Divergence Indicator is a custom Pine Script v6 indicator designed for TradingView that identifies and visualizes divergences between price movements and two technical indicators: the Relative Strength Index (RSI) and the Moving Average Convergence Divergence (MACD). Here's a brief explanation of its functionality:
Divergence Detection: The indicator detects both regular and hidden divergences for RSI, MACD (MACD Line), and Histogram. Regular bullish divergences occur when price makes a lower low but the indicator makes a higher low (suggesting a potential reversal upward), while regular bearish divergences occur when price makes a higher high but the indicator makes a lower high (suggesting a potential reversal downward). Hidden divergences indicate continuation patterns (e.g., higher low in price with a lower low in the indicator for bullish continuation).
Customizable Inputs:
Pivot Bars: Sets the number of bars used to confirm pivot highs and lows (default: 5).
RSI and MACD Parameters: Allows adjustment of RSI length (default: 14) and MACD settings (fast: 12, slow: 26, signal: 9).
Toggle Options: Enables/disables detection of regular and hidden divergences for RSI, MACD, and Histogram individually.
Confirmation: Option to wait for pivot confirmation (default: true), delaying divergence display until the pivot is fully formed.
Show Only Last Divergence: Toggles between showing only the most recent divergence (default: true) or all detected divergences (false), with previous lines and labels cleared when true.
Minimum Divergences: Sets the minimum number of divergence types required at a pivot to display (default: 1, max: 6).
Maximum Pivot Points: Limits the number of historical pivot points to check (default: 10).
Maximum Bars to Check: Restricts analysis to the last specified number of bars (default: 500).
Visualization:
Draws lines connecting the price pivot points where divergences are detected, with customizable colors, widths, and styles (solid, dashed, dotted) for RSI and MACD.
Displays a single label per pivot with vertically stacked text listing all detected divergence types (e.g., "RSI Bull Div MACD Bull Div"), using semi-transparent backgrounds (green for bullish, red for bearish) and white text.

Advanced Trend Panel v3.1This is a comprehensive dashboard indicator designed to give traders a multi-faceted view of the market at a single glance. It combines key indicators across multiple timeframes, calculates trend duration, and presents all information in a clean, color-coded table. This tool is perfect for confirming trade ideas, identifying trend alignment, and understanding the underlying market dynamics.
#### Key Features:
* **All-in-One Dashboard:** A convenient on-chart table summarizes the state of multiple key indicators, saving you screen space and time.
* **Multi-Timeframe (MTF) Forecast:** Analyzes the long-term trend on a higher timeframe (e.g., Daily) to provide context for the current chart's trend.
* **Trend Analysis:** Uses dual sets of EMAs (long-term and short-term) to define the primary and immediate trend directions.
* **Trend Duration:** A unique feature that calculates how long the current short-term and long-term trends have been active, helping you gauge trend maturity.
* **Core Indicators Included:**
* **ADX:** Measures trend strength to differentiate between strong trends and weak or sideways markets.
* **RSI:** Identifies overbought and oversold conditions.
* **Point of Control (POC):** Shows the price level with the highest traded volume over a lookback period, acting as a key level of support/resistance.
* **Volume:** Compares current volume to its moving average to spot unusual activity.
* **Customizable Alerts:** Set up alerts for trend changes (long-term or short-term), RSI crossing into overbought/oversold zones, or shifts in ADX trend strength.
#### How to Use:
1. Apply the indicator to your chart.
2. In the settings, configure the timeframes, indicator lengths, and display options to match your trading style.
3. Use the table to quickly assess if the long-term trend, short-term trend, and momentum are aligned.
4. Enable alerts to be notified of key changes in market conditions without having to watch the chart constantly.
**Disclaimer:** This script is for educational purposes only and should not be considered financial advice. All trading involves risk. Past performance is not indicative of future results. Please backtest and use this tool as part of a comprehensive trading plan with proper risk management.
Feedback is always welcome! If you find this indicator useful, please leave a like.

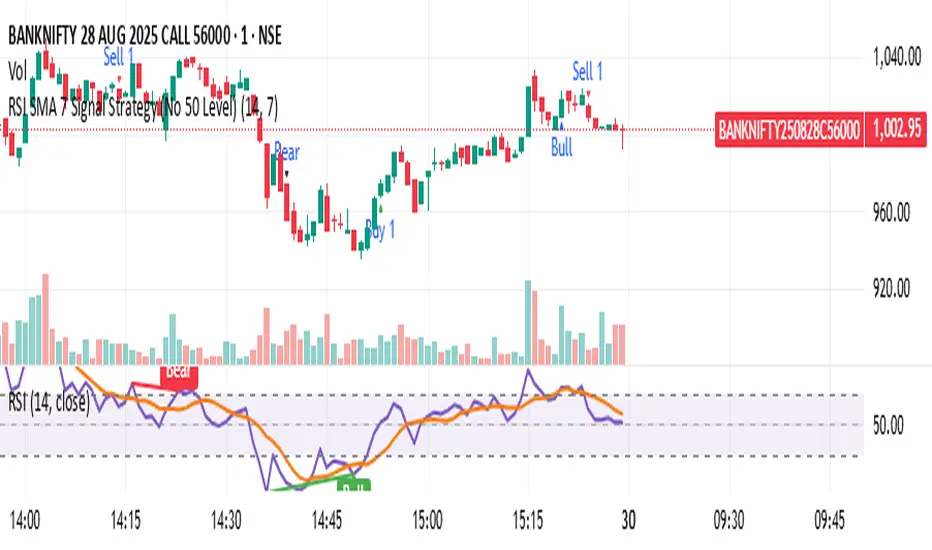
RSI SMA 7 Signal Strategy (No 50 Level)Script uses SMA 7 Perio and 14 Period RSI
If SMA crosses 40 RSI level from below consider it a buy zone or buy signal, if SMA crosses from below 60 RSI level, then super bullish, IF SMA crosses 60 RSI level from above its a profit taking time and Sell zone, if SMA crosses 40 level from above then super bearish sell signal.
逆勢布林+RSI策略 for SOL可以直接套用到 SOLUSDT, SOLPERP, 或其他 SOL 合約。
在策略回測介面中選擇 5min 或 15min 看策略表現。
若要調整停利%或 RSI 數值,改變 rsi < 25 與 (shortEntryPrice - close) / shortEntryPrice >= 0.035 即可。
This can be directly applied to SOLUSDT, SOLPERP, or other SOL futures.
In the strategy backtesting interface, select 5-minute or 15-minute periods to view strategy performance.
To adjust the take-profit percentage or RSI value, set RSI < 25 and (shortEntryPrice - close) / shortEntryPrice >= 0.035.

FFI-Trend Rider ProFFI-Trend Rider Pro is a trend-following strategy designed to help traders make more structured and disciplined entries.
It uses a crossover between the 11 EMA and 21 SMA to detect potential trend shifts, while avoiding premature entries by checking how far the price is from the moving averages. If the price is extended, it waits for a pullback — just like professional traders do.
The indicator also includes:
Auto stoploss based on 21 SMA
Visual background colors based on RSI to help gauge trend strength
A built-in trade info table showing current trade type, entry price, stoploss, and trailing SL
Strategy-enabled functionality for easy backtesting
🔍 Ideal For:
Intraday & Swing Traders
Traders who want fewer, high-quality trades
Anyone looking to reduce emotional decision-making
⚠️ Disclaimer:
This script is for educational purposes only and does not constitute financial advice. Always do your own analysis before making any trading decisions. Past performance is not indicative of future results.

RSI Zones - Directional Entry Strict RSI Zones – Directional Entry Tool (Modified RSI)
This is a simple modification of the standard RSI indicator. I’ve added two custom horizontal lines at the 60–65 and 35–40 zones to help spot momentum shifts and potential reversal points.
60–65 zone: When RSI returns here from above 65, it often signals weakening bullish momentum — useful for spotting short opportunities.
35–40 zone: When RSI returns here from below 35, it can indicate momentum loss on the downside — good for potential long setups.
This version helps traders filter out weak signals and avoid chasing extreme moves.
It works best when combined with price action, structure, or divergence.
Only 2 lines were added to the default RSI for better zone awareness. Everything else remains unchanged.

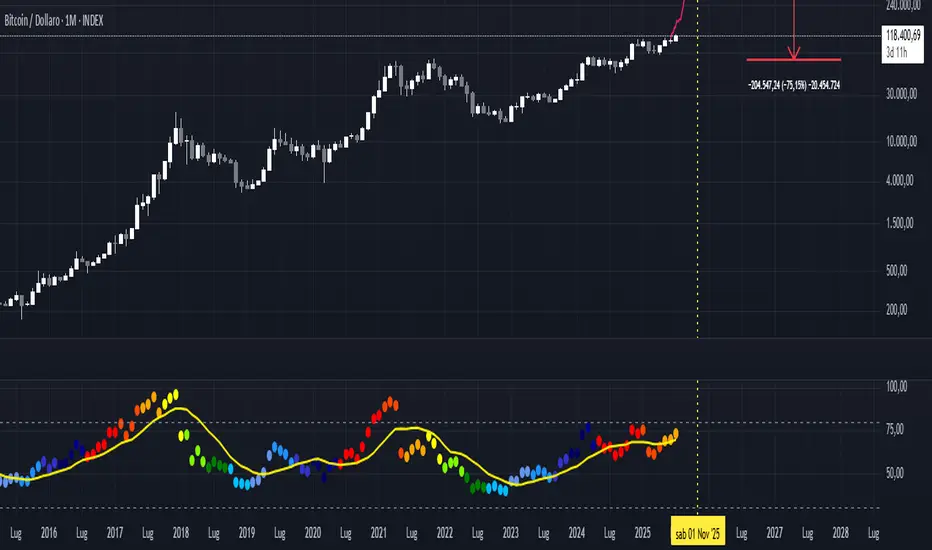
RSI Halving Heatmap by GUELFO
📈 **RSI Halving Heatmap Indicator**
This custom RSI indicator colors the RSI line based on the number of months remaining until the next Bitcoin halving. The closer we get to the halving, the warmer the color—ranging from deep blue (far from halving) to bright red (near halving).
✅ Includes:
- Customizable RSI length and source
- 12-color gradient scale for halving proximity
- Optional SMA overlay on RSI for trend smoothing
Ideal for visualizing market momentum in the context of Bitcoin’s halving cycle.
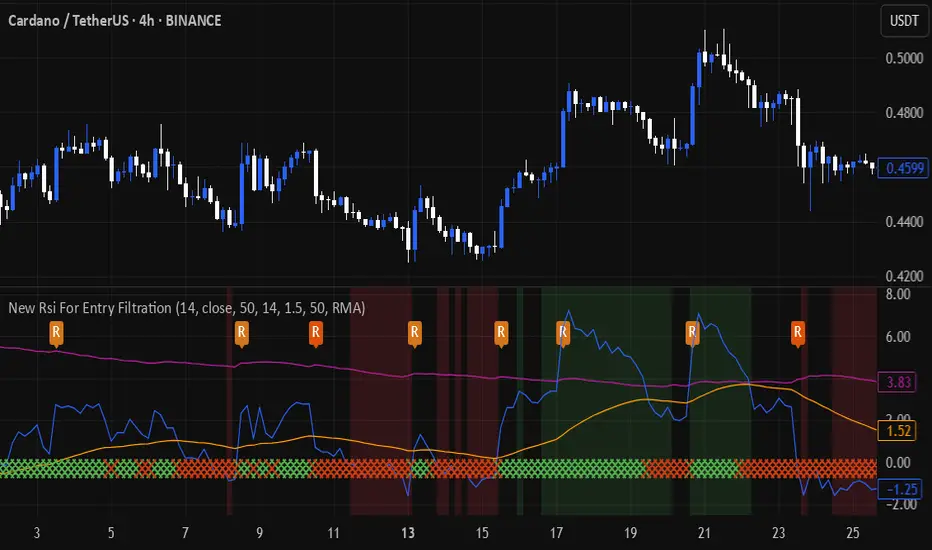
New Rsi For Entry FiltrationThis indicator, which is based on the RSI indicator, is written to prevent you from entering the wrong trade. Its operation is very simple. Enter a long trade when both the main area and the lower ribbon are green. Also, for a short trade, both the main area and the lower ribbon are red. The purple line also shows the stop loss level based on ATR. It is not advisable to enter the trade at the points indicated by R because the candlestick length is long.