RSI HunterConcept and Methodology This indicator is an advanced technical tool that "reverse engineers" J. Welles Wilder’s standard Relative Strength Index (RSI).
While a standard RSI takes price data and outputs an oscillator value (0-100), this script performs the inverse operation. It calculates exactly what Price the current candle must reach to generate a specific RSI value (e.g., RSI 74 or RSI 26). By projecting these price levels onto the chart, traders can visualize Overbought and Oversold zones in real-time, turning the RSI from a lagging confirmation tool into a leading price-target system.
Key Features
1. Multi-Timeframe (MTF) Projection The indicator allows you to map RSI levels from a higher timeframe onto your current chart. For example, you can view the 3-Hour RSI "Overbought" price levels while trading on a 5-minute chart. This creates distinct "stepped" support and resistance lines that remain valid for the duration of the higher timeframe's candle.
2. Dual Zone Logic The script projects two distinct bands of resistance and support:
Inner Zone (Early Warning): Defaults to RSI 69 / 31. This represents the initial threshold of over-extension.
Outer Zone (Extreme): Defaults to RSI 74 / 26. This represents statistical extremes where mean reversion probabilities are higher.
Zone Shading: The area between the Inner and Outer lines is shaded (Red for Resistance, Green for Support) to visually identify the "Reversal Zone."
3. Smart Wick & Rejection Filter (New) This version introduces a robust filtration system designed to reduce false signals during strong trending moves (often referred to as "falling knives").
How it works: The signal logic is Intra-bar Aware. It continuously asks two questions:
Did the price touch the zone? (Did the High/Low breach the Inner line?)
Did the price reject? (Did the candle Close back inside the neutral channel?)
The Result: Signals are generated only when the price tests the level but closes safely back inside the range. This captures both long-tail wick rejections (single bar) and trend reversals, while suppressing signals when the candle closes deep inside the Overbought/Oversold zones.
How to Interpret
Stepped Lines: These are the dynamic resistance (Red) and support (Green) levels based on the selected Timeframe's RSI.
Large Arrows (Deep Red / Lime Green): Triggered when price touches the Outer (Extreme) band and rejects/closes back below the Inner band.
Small Arrows (Standard Red / Green): Triggered when price touches the Inner (Early) band and rejects/closes back, but did not reach the Outer extreme.
Settings & Defaults
RSI Length: 23
Timeframe: 3 Hours (180 minutes)
Targets: 74/26 (Outer) and 69/31 (Inner)
Filter: "Wait for Confirmed Exit" is ON by default.
Disclaimer This tool is for informational and educational purposes only. RSI projections are mathematical calculations based on historical price averages and do not guarantee future market movements. Always use proper risk management.
Индекс относительной силы (RSI)

Stochastic BTC OptimizedEnhanced Stochastic for Bitcoin (BTC) – Optimized for Daily Timeframe
This enhanced Stochastic oscillator is specifically fine-tuned for BTC/USD on the 1D timeframe, leveraging historical data from Bitstamp (2011–2025) to minimize false signals and maximize reliability in Bitcoin's volatile swings.
Unlike the classic Stochastic (14, 3, 3), this version uses optimized parameters:
- K Period = 21 – smoother reaction, better suited for BTC’s macro cycles
- D Period = 3, Smooth K = 3 – reduces noise while preserving responsiveness
- Overbought = 85, Oversold = 15 – accounts for BTC’s tendency to trend strongly within extreme zones without immediate reversal
✅ Smart Signal Logic:
Buy/sell signals appear only when %K crosses %D inside the oversold (≤15) or overbought (≥85) zones, and only the first signal is shown to avoid whipsaws.
Visual Enhancements:
- Thick lines when %K/%D are in overbought/oversold zones
- Green/red background highlights on valid signals
- Optional up/down arrows for clear entry visualization
- Customizable colors, line widths, and transparency
🔒 No alerts included – clean, focused on price action and momentum.
💡 Pro Tip: For even higher accuracy, use this indicator in combination with a long-term trend filter (e.g., EMA 200). The oscillator excels in ranging or retracement phases but should not be used alone in strong parabolic moves.
Based on Mozilla Public License v2.0 – feel free to use, modify, and share. Perfect for swing traders and long-term Bitcoin analysts seeking high-probability reversal zones.
перевод на русский
Улучшенный Stochastic для Bitcoin (BTC) — оптимизирован для дневного таймфрейма
Этот улучшенный осциллятор Stochastic специально настроен под BTC/USD на дневном графике, с учётом исторических данных Bitstamp (2011–2025), чтобы минимизировать ложные сигналы и повысить надёжность в условиях высокой волатильности биткоина.
В отличие от классического Stochastic (14, 3, 3), эта версия использует оптимизированные параметры:
- Период K = 21 — более плавная реакция, лучше соответствует макроциклам BTC
- Период D = 3, Сглаживание K = 3 — снижает шум, сохраняя отзывчивость
- Уровень перекупленности = 85, перепроданности = 15 — учитывает склонность BTC к сильным трендам в экстремальных зонах без немедленного разворота
✅ Интеллектуальная логика сигналов:
Покупка/продажа отображается только при пересечении %K и %D внутри зоны перепроданности (≤15) или перекупленности (≥85), и только первый сигнал фиксируется, чтобы избежать «хлыстов».
Улучшенная визуализация:
- Жирные линии, когда %K/%D находятся в экстремальных зонах
- Зелёный/красный фон при появлении сигналов
- Опциональные стрелки для чёткого отображения точек входа
- Настройка цветов, толщины линий и прозрачности
🔒 Без алертов — чистый инструмент, сфокусированный на цене и импульсе.
💡 Совет профессионала: для ещё большей точности используйте этот индикатор вместе с трендовым фильтром (например, EMA 200). Осциллятор лучше всего работает в фазах консолидации или отката, но не стоит применять его в одиночку во время сильных параболических движений.
На основе Mozilla Public License v2.0 — свободно используйте, модифицируйте и делитесь. Идеален для свинг-трейдеров и аналитиков Bitcoin, ищущих зоны с высокой вероятностью разворота.

Triple 9 Bias filter Triple 9 Bias – Precision Multi-Timeframe Directional Filter
Technical Overview
The Triple 9 Bias is a precision multi-timeframe directional filter built exclusively for 5-minute (and lower) trading.
It stacks three EMA-9 trend directions (4H + 1H + 15m) as Primary confluence and uses only the 4H RSI-14 as Secondary confirmation.
Integrity Check: Zero repaint · Zero lookahead · Works identically on any chart timeframe.
The Trading Rule (Simple)
Long Trades: Only trade longs when all three EMA-9s are UP + 4H RSI > 50
Short Trades: Only trade shorts when all three EMA-9s are DOWN + 4H RSI < 50
Otherwise — stand aside.
Display Components
A. Plotted Higher-Timeframe EMAs (No Repainting)
All values are pulled from closed higher-timeframe bars.
4H EMA 9 (Red step-line)
1H EMA 9 (Purple step-line)
15m EMA 9 (Orange step-line)
B. Locked Dashboard (Bottom-Right)
Clean table split into Primary and Secondary sections for instant bias reading.
Colour Logic:
🟢 Lime = UP / BUY
🔴 Red = DOWN / SELL
Background Logic:
Full Green: Only when all three EMA-9s are UP
Full Red: Only when all three EMA-9s are DOWN
Gray: Otherwise = no trade
Indicator Breakdown
3.1. Primary Confluence – EMA 9 Slope
4H EMA 9 direction (compared 10 bars back)
1H EMA 9 direction (compared 6 bars back)
15m EMA 9 direction (compared 6 bars back)
3.2. Secondary Confluence
4H RSI-14 vs 50 level (BUY if >50, SELL if <50)
High-Probability Signal: When Primary = all three “UP” and Secondary = “BUY” → highest-probability bullish bias (and vice-versa for bearish).

SMC Trend Reversal by Pooja🌟 SMC Trend Reversal by Pooja — CHoCH + BOS + RSI Confirmation
🔥 Smart Money Concepts • Trend Reversal Detection • Multi-Asset Optimized
The SMC Trend Reversal by Pooja is a powerful market-structure indicator designed for traders who follow Smart Money Concepts (SMC) and want to identify trend reversals, BOS, and CHoCH with high clarity.
It blends pivot-based structure breaks, RSI confirmation, and an optional session filter, giving traders a clean and reliable view of market shifts across Crypto, Forex, Indices, and Equity Derivatives.
✨ 🔰 Why SMC Matters in Crypto & Forex?
Both Crypto and Forex markets:
Trade 24/7 / 5 days with high volatility
React strongly to liquidity zones, market structure shifts, and smart money footprints
Often reverse sharply after liquidity grabs
Follow clean CHoCH → BOS → Trend progression sequences
This is why CHoCH (Change of Character) and BOS (Break of Structure) are crucial tools used by professional SMC traders to catch early trend reversals.
This indicator automates that process for you.
No clutter. No repaints. No noise.
Just pure SMC structure.
🚀 Key Features
🟣 CHoCH Detection (Change of Character)
Detects when the market shifts direction
A CHoCH appears when the trend flips from down → up or up → down
Highlights the earliest sign of a trend reversal
Draws a clean CHoCH line across structure
Works beautifully in volatile markets like Crypto & Forex
🔵 BOS Detection (Break of Structure)
Identifies structural continuation in the same direction
Helps confirm the new trend after CHoCH
Clear BOS lines to visualize progression of market flow
Ideal for trend-following and breakout traders
🧠 RSI-Based Confirmation (Optional)
To avoid fake CHoCH signals, the indicator uses RSI filtering:
RSI > Upper Level → Show “B” Buy Label
RSI < Lower Level → Show “S” Sell Label
This improves accuracy especially in:
Fast crypto markets (BTC, ETH, SOL etc.)
Liquidity-driven assets (Forex, Indices)
⏱️ Session Block (Asia/Kolkata Compatible)
Avoid signals in the first few minutes of market open or in volatile windows.
Block signals in a selected time range
Perfect for Indian market opening volatility (09:00–09:25)
🎯 Clean, Minimal, Easy-to-Read Visuals
✔ Horizontal structural lines
✔ Color-coded CHoCH and BOS
✔ Buy (B) / Sell (S) labels only when meaningful
✔ No unnecessary clutter
✔ Suitable for both beginners and advanced SMC traders
📢 Built-In Alerts
Receive notifications for:
🔔 Bullish CHoCH
🔔 Bearish CHoCH
🔔 Bullish BOS
🔔 Bearish BOS
Perfect for mobile, desktop, and webhook automation.
📈 How It Helps Your Trading
✔ Catch early trend reversals with confidence
✔ Avoid false signals with RSI filtering
✔ Trade like Smart Money (Institutional concepts)
✔ Works on all timeframes — scalping to swing
✔ Specially powerful on Crypto & Forex due to their structure-driven nature
✔ Cleaner charts → Better decisions → Higher probability trades
🧩 Who Should Use This Indicator?
✔ SMC / ICT style traders
✔ Breakout and trend-following traders
✔ Reversal traders
✔ Crypto & Forex scalpers
✔ Option buyers looking for early trend shifts
✔ Intraday NIFTY / BANKNIFTY traders
⚠️ Disclaimer
This indicator is for educational purposes and market analysis only.
It does not guarantee profits. Always practice risk management and test your settings before using it live.

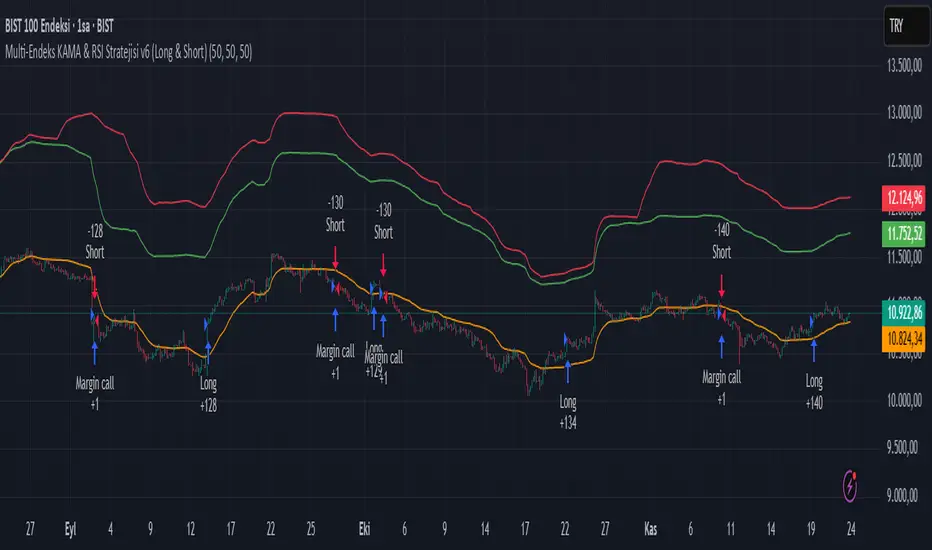
Multi-Endeks KAMA & RSI Stratejisi v6 (Long & Short)Multi-Index KAMA & RSI Strategy v6 (Long & Short)
This is a hybrid trading strategy that combines two powerful technical analysis tools—the Kaufman's Adaptive Moving Average (KAMA) for trend following and the Relative Strength Index (RSI) for measuring momentum and identifying overbought/oversold conditions.
The term "Multi-Index" suggests that the decision-making process might incorporate data or conditions from several different market indices or timeframes, rather than just the single asset being traded.
🧭 Core Components
1. KAMA (Kaufman's Adaptive Moving Average)
KAMA is an adaptive moving average developed by quantitative financial theorist Perry J. Kaufman.
Adaptivity: Unlike standard moving averages, KAMA automatically adjusts its smoothing factor (speed) based on market volatility.
Mechanism:
Trending Markets (Low Noise): When prices move clearly in one direction (low volatility), KAMA speeds up, hugging the price closely and providing fast signals.
Sideways Markets (High Noise): When prices are choppy (high volatility/noise), KAMA slows down, smoothing out price fluctuations to reduce the risk of whipsaws (false signals).
Role in Strategy: To define the main trend direction. The position of the price relative to the KAMA line determines the base directional bias (Long or Short).
2. RSI (Relative Strength Index)
RSI is a momentum oscillator developed by J. Welles Wilder Jr. that measures the speed and change of price movements.
Overbought/Oversold: It oscillates between 0 and 100. Conventionally, a reading above 70 suggests overbought conditions (potential sell signal), and a reading below 30 suggests oversold conditions (potential buy signal).
Role in Strategy: Timing and Confirmation. Once the trend is confirmed by KAMA, the RSI acts as a timing filter, often confirming an entry as it moves away from extreme overbought (for Short) or oversold (for Long) levels.
📉 Potential Trading Logic (V6)
This "v6" strategy likely aims to capture more reliable entries by requiring both trend (KAMA) and momentum (RSI) alignment:
1. LONG (Buy) Entry Conditions
Trend Confirmation (KAMA): The asset's price (Closing Price) must be above the KAMA line (confirming an uptrend).
Momentum Confirmation (RSI):
Option A (Reversal): The RSI must cross above the 30 level (exiting oversold) or decisively move above the 50 level.
Option B (Trend-Continuation): In a strong uptrend, the RSI might bounce off the 40-50 zone and turn upwards, confirming trend continuation.
2. SHORT (Sell) Entry Conditions
Trend Confirmation (KAMA): The asset's price (Closing Price) must be below the KAMA line (confirming a downtrend).
Momentum Confirmation (RSI):
Option A (Reversal): The RSI must cross below the 70 level (exiting overbought) or decisively move below the 50 level.
Option B (Trend-Continuation): In a strong downtrend, the RSI might be rejected from the 50-60 zone and turn downwards, confirming continuation.
3. Exit Management
The strategy likely utilizes dynamic risk controls:
Stop-Loss: A dynamic stop placed on the opposite side of the KAMA, or an ATR-based distance to adjust to volatility.
Take-Profit: Conditions such as the RSI reaching extreme levels or the KAMA line being crossed in the reverse direction.
🌟 Implication of the "V6" Version
The "v6" designation implies that the strategy has been refined and iterated upon over time to address weaknesses in prior versions (v1, v2, etc.). These improvements might include:
Filters: Adding stricter RSI or KAMA cross filters to reduce false signals.
Multi-Index Logic: Using the RSI or KAMA of a secondary instrument (e.g., a major index or volatility measure) as a macro filter for the main trade execution.
Optimization: Optimizing the default lookback periods for KAMA and RSI for different asset classes.
[CASH] Crypto And Stocks Helper (MultiPack w. Alerts)ATTENTION! I'm not a good scripter. I have just learned a little basics for this project, stolen code from other public scripts and modified it, and gotten help from AI LLM's.
If you want recognition from stolen code please tell me to give you the credit you deserve.
The script is not completely finished yet and contains alot of errors but my friends and family wants access so I made it public.
_________________________________________________________________________________
CASH has multiple indicators (a true all-in-one multipack), guides and alerts to help you make better trades/investments. It has:
- Bitcoin Bull Market Support Band
- Dollar Volume
- 5 SMA and 5 EMA
- HODL Trend (a.k.a SuperTrend) indicator
- RSI, Volume and Divergence indicators w. alerts
More to come as well, like Backburner and a POC line from Volume Profile.
Everything is fully customizable, appearance and off/on etc.
More information and explainations along with my guides you can find in settings under "Input" and "Style".

Trend Cross Filter by Pooja⭐ Trend Cross Filter by Pooja
Trend Cross Filter by Pooja is a clean and efficient crossover-based entry tool designed to help traders identify momentum shifts with clarity. This indicator combines a fast RSI and a smoothed RSI-MA baseline with optional trend and volatility filters, allowing users to focus on higher-quality crossover signals.
The goal of this tool is to offer structured, easy-to-read entries without clutter or complexity. All signals appear directly on the chart using markers, making it suitable for intraday and short-term decision-making.
⭐ Key Features
🔶 1. RSI–MA Crossover Signals
Generates BUY/SELL signals when RSI crosses above or below its moving average.
Clean visual markers help highlight potential momentum changes.
🔶 2. Trend Strength Filter (Optional)
Uses a custom ADX calculation to allow signals only when trend strength meets the selected threshold.
🔶 3. Volatility Filter (ATR-Based)
An optional ATR/Price filter helps avoid signals during extremely low-volatility or flat periods.
🔶 4. RSI-MA Slope Filter
Allows users to accept only those signals where the slope of the RSI-MA indicates meaningful directional strength.
🔶 5. Minimum Bars Between Signals
Prevents back-to-back signals in noisy or sideways conditions.
🔶 6. Chart-Based Visual Signals
Signals appear directly on the price chart:
BUY markers for upward crossover
SELL markers for downward crossover
Users can choose between triangle or label-style signals.
🔶 7. Alert + Webhook Compatible
Built-in alert conditions for BUY and SELL signals.
Users can connect alerts to webhooks or automation tools if they wish.
🔶 8. Flexible Customization
All filters, thresholds, colors, and label styles can be adjusted easily based on personal preference.
⭐ How to Use
Add the indicator to your chart.
Choose your preferred signal style (Label / Triangle).
Enable or disable the ADX, ATR, or slope filters as needed.
Create TradingView alerts using the built-in BUY and SELL alert conditions if automation or notifications are required.
Combine signals with your own risk management and market analysis.
⭐ Notes
Works across multiple timeframes and different instruments.
Filtering options help reduce noise, but users should test settings based on their trading approach.
⚠️ Disclaimer
This indicator is a technical analysis tool created for educational and chart-analysis purposes.
It does not provide financial advice, does not guarantee profits, and should not be used as the sole basis for trading decisions.
Market conditions vary, and users are fully responsible for their own trades, risk management, and results.
Always test any tool or strategy on historical data or a demo environment before using in live markets.

Day Trading Astra by Pooja📌 Day Trading Astra by Pooja
Day Trading Astra by Pooja is specily designed for F&O Traders, a clean and fast momentum-shift indicator designed to support day traders with clear entry signals and structured filtering.
It uses a refined RSI–MA crossover engine, allowing traders to visualize momentum transitions directly on the price chart with minimal clutter.
✨ Key Features
🔶 1. RSI–MA Crossover Engine
Identifies potential momentum shifts using a fast RSI and smoothed RSI-MA baseline.
🔶 2. Clean BUY/SELL Chart Signals
Markers appear directly on the candle chart—easy to read, no extra panes.
🔶 3. Smart Filtering System (Optional)
To help reduce low-quality signals in uncertain conditions:
ADX trend-strength filter
ATR volatility check
Slope validation
Minimum bars between two signals
🔶 4. Alert + Webhook Ready
Supports TradingView alerts and webhook integration for automation tools.
Each alert includes symbol, direction, price, timestamp, unique ID, and an optional secret key for secure execution.
🔶 5. Multi-Timeframe Flexible
Works across all timeframes; users can apply it according to their day-trading style.
📝 How to Use
Add indicator to chart.
Select your preferred filters or use default settings.
Enable alerts if automated notifications are needed.
Combine with your own risk management and trading framework.
This tool is meant to support analysis, not replace personal judgment.
⚠️ Disclaimer
This script is a technical analysis tool and not financial advice.
Results vary depending on market conditions and user settings.
No indicator can guarantee profits or eliminate risk.
Always test settings before applying them in live markets.
The user is fully responsible for all trading decisions.
⭐ Summary
A clean, fast, and structured momentum-entry tool designed to help day traders identify potential intraday shifts with clarity and alert support.

RSI + 55 EMA + Volume (SL Marked, No Engulfing)This is to help entering in trades by considering 50 EMA and RSI indicators, Volume is used for confirmations

RSI Ensemble Confidence [CHE]RSI Ensemble Confidence — Measures RSI agreement across multiple lengths and price sources
Summary
This indicator does not just show you one RSI — it shows you how strongly dozens of different RSI variants agree with each other right now.
The Confidence line (0–100) is the core idea:
- High Confidence → almost all RSIs see the same thing → clean, reliable situation
- Low Confidence → the RSIs contradict each other → the market is messy, RSI signals are questionable
How it works (exactly as you wanted it described)
1. Multiple RSIs instead of just one
The indicator builds a true ensemble:
- 4 lengths (default 8, 14, 21, 34)
- 6 price sources (Close, Open, High, Low, HL2, OHLC4 – individually switchable)
→ When everything is enabled, up to 24 different RSIs are calculated on every single bar.
These 24 opinions form a real “vote” about the current market state.
2. Mean and dispersion
From all active RSIs it calculates:
- rsiMean → the average opinion of the entire ensemble (orange line)
- rsiStd → how far the individual RSIs deviate from each other
Small rsiStd = they all lie close together → strong agreement
Large rsiStd = they are all over the place → contradiction
3. Confidence (0–100)
The standard deviation is compared to the user parameter “Max expected StdDev” (default 20):
- rsiStd = 0 → Confidence ≈ 100
- rsiStd = maxStd → Confidence ≈ 0
- Everything in between is scaled linearly
If only one RSI is active, Confidence is automatically set to ~80 for practicality.
What you see on the chart
1. Classic reference RSI – blue line (Close, length 14) → your familiar benchmark
2. Ensemble mean – orange line → the true consensus RSI
±1 StdDev band (optional) → shows dispersion directly:
- narrow band = clean, consistent setup
- wide band = the RSIs disagree → caution
3. Confidence line (aqua, 0–100) → your quality meter for any RSI signal
4. StdDev histogram (optional, fuchsia columns) → raw dispersion if you prefer the unscaled value
5. Background coloring
- Greenish ≥ 80 → high agreement
- Orange 60–80 → medium
- Reddish < 40 → strong disagreement
- Transparent below that
6. Two built-in alerts
- High Confidence (crossover 80)
- Low Confidence (crossunder 40)
Why this indicator is practically useful
1. Perfect filter for all RSI strategies
Only trade overbought/oversold, divergences, or failures when Confidence ≥ 70. Skip or reduce size when Confidence < 40.
2. Protection against overinterpretation
You immediately see whether a “beautiful” RSI hook is confirmed by the other 23 variants — or whether it’s just one outlier fooling you.
3. Excellent regime detector
Long periods of high Confidence = clean trends or clear overbought/oversold phases
Constantly low Confidence = choppy, noisy market → RSI becomes almost useless
4. Turns gut feeling into numbers
We all sometimes think “this setup somehow doesn’t feel right”. Now you have the exact number that says why.
Disclaimer
The content provided, including all code and materials, is strictly for educational and informational purposes only. It is not intended as, and should not be interpreted as, financial advice, a recommendation to buy or sell any financial instrument, or an offer of any financial product or service. All strategies, tools, and examples discussed are provided for illustrative purposes to demonstrate coding techniques and the functionality of Pine Script within a trading context.
Any results from strategies or tools provided are hypothetical, and past performance is not indicative of future results. Trading and investing involve high risk, including the potential loss of principal, and may not be suitable for all individuals. Before making any trading decisions, please consult with a qualified financial professional to understand the risks involved.
By using this script, you acknowledge and agree that any trading decisions are made solely at your discretion and risk.
Do not use this indicator on Heikin-Ashi, Renko, Kagi, Point-and-Figure, or Range charts, as these chart types can produce unrealistic results for signal markers and alerts.
Best regards and happy trading
Chervolino

Institution Radar Institution Radar
Institution Radar compares Price RSI with Volume-Delta RSI to show when price moves are real (backed by volume) or fake (moving without volume).
This helps reveal two powerful concepts:
Absorption (Bullish or Bearish)
Absorption happens when a large limit order is sitting in the order book.
Market orders hit it over and over, but the level doesn't break.
This usually means:
Strong players are absorbing the aggressive orders
Price is likely to move in the opposite direction
The next candle often reacts immediately
Can lead to a full reversal or just a short 1–2 candle move
Exhaustion (Bullish or Bearish)
Exhaustion happens when institutions pull their limit orders away.
There is no real volume behind the move, so price drifts up or down easily.
This usually means:
The current move is weak
A slowdown, pullback, or reversal is likely
Often shows up right before a flip in direction
📌 What the Signals Mean
Green signal → next candles often push upward
Red signal → next candles often push downward
These can mark trend reversals or temporary 1–2 candle reactions
🎚️ Sensitivity Setting
You can adjust how strict the signals are:
Lower sensitivity = more signals, more noise
Higher sensitivity = fewer signals, but more accurate and stronger
A higher sensitivity is recommended if you only want the cleanest institutional moments.

Piku Pips📌 Piku Pips — Multi-Confluence Smart Signal System (EMA + Supertrend + Volume Profile + ATR Trailing + SR + RSI Climax Engine)
Piku Pips is a complete multi-confluence trading system designed for scalpers, intraday traders, and swing traders who rely on precision entries and institutional-grade confirmation layers.
This indicator combines trend, momentum, volatility, volume imbalance, structure breaks, smart money pivots, and exhaustion events—into a single unified charting system.
It does NOT repaint, supports alerts, and works across all assets (crypto, forex, indices, stocks).
🔥 What Makes This Indicator Special?
Piku Pips is built on stacked confluences instead of single-indicator signals.
Each signal is only printed when multiple conditions align, significantly increasing accuracy and reducing noise.
It includes:
✔ Trend Identification
Fast & Slow EMA cross
SuperTrend with custom ATR & factor
Parabolic SAR for micro-trend confirmation
ATR-based trailing stop engine (dual version for Buy & Sell)
✔ Momentum Confirmation
RSI Midline model
HH/LL structure detection
Bull/Bear volume imbalance model
✔ Smart Volume Analysis
Bullish vs Bearish VWMA volume
Flat-volume filters
RSI + Volume Spike + MFI exhaustion detection (Climax Module)
✔ Institutional Structure Mapping
Dynamic Support & Resistance
Automatic Zone Strength Ranking
Breakout detection with zone coloring
Pivot-based structure scanning
✔ Exhaustion + Divergence Engine (Climax Module)
RSI / Stochastic RSI hybrid
Macro trend smoothing (EMA/RMA/SMA/WMA selectable)
High-precision RSI divergence detection (HH/LH and LL/HL)
Volume spike detection
Buy Climax (potential top)
Sell Climax (potential bottom)
This module acts like a “smart momentum brain” that identifies major reversals.
🎯 Signal Logic (Simplified)
🔹 Buy Signal (Green Triangle)
Triggered when:
Fast EMA crosses above Slow EMA
Higher High structure forms
RSI > midline or crosses above it
Volume profile is bullish
SuperTrend is bullish (direction < 0)
🔹 Sell Signal (Red Triangle)
Triggered when:
Fast EMA crosses below Slow EMA
Lower Low structure forms
RSI < midline or crosses below it
Volume profile is bearish
SuperTrend is bearish (direction > 0)
🔸 Secondary ATR Signals (Orange & Maroon)
Uses Heikin-Ashi ATR trailing stop
Detects micro-shifts in trend momentum
Works excellent in scalping timeframes
🧠 Support & Resistance Engine
The script builds dynamic SR zones based on:
Pivot clustering
Channel width filtering
Strength scoring
Automated sorting and plotting
Zones:
Red tint = Resistance
Green tint = Support
Gray tint = Neutral / In-Play
Alerts trigger on clean SR breaks.
⚡ Climax Module (Exhaustion System)
This system overlays major exhaustion points:
🔻 Buy Climax
High-volume upward exhaustion → potential top.
🔺 Sell Climax
High-volume downward exhaustion → potential bottom.
🔼 RSI Divergences
Bullish divergence labeled "RSI⬆"
Bearish divergence labeled "RSI⬇"
Combined, these give early insight into possible reversals.
🛠 Inputs Overview
📌 Trend Inputs
Fast EMA Length
Slow EMA Length
SuperTrend ATR + Factor
SAR multipliers
Buy/Sell ATR trailing stop parameters
📌 Momentum Inputs
RSI length / midline
Bull/Bear volume variance filter
HH/LL confirmation
📌 Structure Inputs
Pivot sensitivity
Max SR Zones
Loopback length
Zone strength minimum
📌 Climax Module Inputs
RSI / Stochastic lengths
Smoothing method (EMA, SMA, RMA, WMA)
Macro trend slope settings
Pivot sensitivity for divergence
Volume spike multiplier
MFI thresholds
Bull/Bear RSI levels
📈 How to Use Piku Pips
Best Use-Cases:
Scalping (1m–15m)
Intraday (15m–1H)
Swing trading (4H–1D)
Crypto / Forex / Indices / Stocks
Recommended Approach
Trade in direction of EMA + Supertrend + Macro RSI regime.
Enter when Piku Buy/Sell signal aligns with the trend.
Use SR zones as targets or invalidation levels.
Watch Climax signals for tops & bottoms.
Use divergence signals for early reversals.
🔔 Alerts Included
Buy Signal
Sell Signal
ATR Buy / Sell
Buy Climax
Sell Climax
RSI Divergence (bullish & bearish)
All-Signals alert
⚠️ Disclaimer
This indicator is created for educational purposes only and does not constitute financial advice.
Trading involves risk. Do your own research and backtesting before using any tool in live markets.
Timeframe Fast EMA Slow EMA ATR Period Factor RSI Length Overbought/Oversold
5 Min 9 21 10 2 8 80 / 20
15 Min 10 25 10 2.5 10 75/25
1 Hour 20 50 14 3 12 70/30
4 Hour 21 50 14 3 14 70/30
1 Day 20 100 14 3.5 14 70/30
Please use this settings for accurate results

Weighted RSI DivergenceWeighted RSI Divergence
A powerful divergence engine that grades every RSI divergence by strength, context, and confluence — helping you filter noise and focus only on the highest-probability reversal setups.
This script combines RSI divergences with five confirmation layers to produce confidence-weighted signals, clearer trade decisions, and alert-ready setups for both bullish and bearish reversals.
What This Indicator Detects
Bullish Divergence → Price makes a lower low while RSI makes a higher low
Bearish Divergence → Price makes a higher high while RSI makes a lower high
Confirmation Factors (Each Adds +1 to the Score)
Volume Spike: Above-average volume on the divergence bar
Trend Alignment: Divergence occurs in harmony with higher-timeframe trend dynamics
Key Level Proximity: Price tests significant support or resistance
Momentum Extremes: RSI reaches oversold/overbought thresholds
Candle Reversal Pattern: Engulfing, pin bar, or similar reversal structure
Confidence Scoring
1–2 → Low Confidence (gray)
3 → Medium Confidence (yellow)
4–5 → High Confidence (green/red)
Higher scores = higher-probability setups.
Visual Components
RSI plot with dynamic gradient coloring
Divergence lines mapped to RSI pivots
Signal labels showing confidence + factors
Background highlighting for high-confidence events
Real-time confidence meter for active bar conditions
Optional data table for factor-by-factor breakdown
Alerts Included
High-confidence bullish & bearish divergences
Medium-confidence signals
Any divergence meeting your minimum threshold
Best Practices
Prioritize setups with 4 or 5 confirmations
Use higher timeframes (4H, 1D, 1W) for more reliable signals
Combine with market structure and price action (S/R, HTF trend, liquidity zones)
Counter-trend divergences require stronger scores to validate
Final Notes
This script focuses on clarity, risk reduction, and selective trade timing. The confidence system helps distinguish weak divergences from high-probability reversal conditions — giving traders a structured, repeatable edge.

Market Cipher With DivegencesAnother look into classic ;)
My take on Market Cypher with new money line and DIVERGENCES!!!
Enjoy!

Quadro v6This implement QUADRO strategy.
Finding divergences on corelated RSI and analyzing them in real time.
More description on it will come later...

Wick-RSI-CandleBody_SEZERthis strategy is ideal to recognize peaks for both long and short positions in 1h and 4h periods. for quick response and faster trade, please use 15m period but keep in mind targeting lower profits. otherwise you may lose your profit.

RSI VWAP EMA ON CHART1. Understand the components
VWAP (Volume Weighted Average Price)
Green: price is above VWAP → bullish trend
Red: price is below VWAP → bearish trend
Blue: price exactly at VWAP → neutral
Acts as a dynamic trend line and support/resistance.
4 Moving Averages (MA1–MA4)
Customizable lengths and type (SMA or EMA).
Useful for trend confirmation and dynamic support/resistance.
Typically:
MA1 = fastest (short-term)
MA4 = slowest (long-term)
When price is above multiple MAs → strong bullish trend; below → bearish trend.
RSI Overlay with VWAP Alignment
RSI line normalized to price scale.
Background shading indicates momentum aligned with VWAP trend:
Green shading: RSI > 50 and price above VWAP → bullish momentum
Red shading: RSI < 50 and price below VWAP → bearish momentum
Gray areas: neutral or momentum does not align with VWAP.
2. Basic usage workflow
Trend Confirmation
Look at VWAP color: price above → bullish, below → bearish.
Check RSI + VWAP shading: green confirms bullish momentum, red confirms bearish momentum.
Check MA alignment: shorter MAs above longer MAs = stronger bullish trend; vice versa for bearish.
Entry Signals (Scalping)
Long (Buy) Setup
Price above VWAP (green)
RSI green shading (RSI > 50)
Shorter MAs above longer MAs (trend support)
Short (Sell) Setup
Price below VWAP (red)
RSI red shading (RSI < 50)
Shorter MAs below longer MAs
Exits / Stops
Exit if price closes against VWAP trend (e.g., price drops below VWAP during a bullish trade).
Use nearest MA support/resistance as stop-loss or take-profit zones.
3. Optional adjustments for scalping
RSI length / thresholds
Shorter RSI (7–10) → faster response for scalping.
Standard RSI (14) → smoother, fewer false signals.
MA lengths
Short-term: 20–50
Medium-term: 50–100
Long-term: 100–200
Can tweak for the timeframe you trade (1m, 5m, 15m).
Timeframe
VWAP works best on intraday charts (1m, 5m, 15m).
Use higher timeframe (e.g., 15m or 1h) for trend direction and lower timeframe (1m–5m) for entries.
4. Example Scalping Setup
Bullish setup (buy):
Price above VWAP → VWAP green
RSI > 50 and green shading
Shorter MAs above longer MAs
Enter on small pullback or breakout
Stop: below nearest MA or VWAP
Bearish setup (sell):
Price below VWAP → VWAP red
RSI < 50 and red shading
Shorter MAs below longer MAs
Enter on minor bounce or breakdown
Stop: above nearest MA or VWAP
5. Visual cues summary
Element Interpretation
VWAP Green Price above VWAP → bullish trend
VWAP Red Price below VWAP → bearish trend
RSI Green Shading Bullish momentum aligns with VWAP
RSI Red Shading Bearish momentum aligns with VWAP
MA Alignment Trend strength (short above long = bullish, short below long = bearish)

VWAP + 4 MAs with RSI Overlay & VWAP Alignment1. Understand the components
VWAP (Volume Weighted Average Price)
Green: price is above VWAP → bullish trend
Red: price is below VWAP → bearish trend
Blue: price exactly at VWAP → neutral
Acts as a dynamic trend line and support/resistance.
4 Moving Averages (MA1–MA4)
Customizable lengths and type (SMA or EMA).
Useful for trend confirmation and dynamic support/resistance.
Typically:
MA1 = fastest (short-term)
MA4 = slowest (long-term)
When price is above multiple MAs → strong bullish trend; below → bearish trend.
RSI Overlay with VWAP Alignment
RSI line normalized to price scale.
Background shading indicates momentum aligned with VWAP trend:
Green shading: RSI > 50 and price above VWAP → bullish momentum
Red shading: RSI < 50 and price below VWAP → bearish momentum
Gray areas: neutral or momentum does not align with VWAP.
2. Basic usage workflow
Trend Confirmation
Look at VWAP color: price above → bullish, below → bearish.
Check RSI + VWAP shading: green confirms bullish momentum, red confirms bearish momentum.
Check MA alignment: shorter MAs above longer MAs = stronger bullish trend; vice versa for bearish.
Entry Signals (Scalping)
Long (Buy) Setup
Price above VWAP (green)
RSI green shading (RSI > 50)
Shorter MAs above longer MAs (trend support)
Short (Sell) Setup
Price below VWAP (red)
RSI red shading (RSI < 50)
Shorter MAs below longer MAs
Exits / Stops
Exit if price closes against VWAP trend (e.g., price drops below VWAP during a bullish trade).
Use nearest MA support/resistance as stop-loss or take-profit zones.
3. Optional adjustments for scalping
RSI length / thresholds
Shorter RSI (7–10) → faster response for scalping.
Standard RSI (14) → smoother, fewer false signals.
MA lengths
Short-term: 20–50
Medium-term: 50–100
Long-term: 100–200
Can tweak for the timeframe you trade (1m, 5m, 15m).
Timeframe
VWAP works best on intraday charts (1m, 5m, 15m).
Use higher timeframe (e.g., 15m or 1h) for trend direction and lower timeframe (1m–5m) for entries.
4. Example Scalping Setup
Bullish setup (buy):
Price above VWAP → VWAP green
RSI > 50 and green shading
Shorter MAs above longer MAs
Enter on small pullback or breakout
Stop: below nearest MA or VWAP
Bearish setup (sell):
Price below VWAP → VWAP red
RSI < 50 and red shading
Shorter MAs below longer MAs
Enter on minor bounce or breakdown
Stop: above nearest MA or VWAP
5. Visual cues summary
Element Interpretation
VWAP Green Price above VWAP → bullish trend
VWAP Red Price below VWAP → bearish trend
RSI Green Shading Bullish momentum aligns with VWAP
RSI Red Shading Bearish momentum aligns with VWAP
MA Alignment Trend strength (short above long = bullish, short below long = bearish)

RSI Divergence (Regular + Hidden, @darshakssc)This indicator detects regular and hidden divergence between price and RSI, using confirmed swing highs and swing lows (pivots) on both series. It is designed as a visual analysis tool, not as a signal generator or trading system.
The goal is to highlight moments where price action and RSI momentum move in different directions, which some traders study as potential early warnings of trend exhaustion or trend continuation. All divergence signals are only drawn after a pivot is fully confirmed, helping to avoid repainting.
The script supports four divergence types:
Regular Bullish Divergence
Regular Bearish Divergence
Hidden Bullish Divergence
Hidden Bearish Divergence
Each type is drawn with a different color and labeled clearly on the chart.
Core Concepts Used
1. RSI (Relative Strength Index)
The script uses standard RSI, calculated on a configurable input source (default: close) and length (default: 14).
RSI is treated purely as a momentum oscillator – the script does not enforce oversold/overbought interpretations.
2. Pivots / Swings
The indicator defines swing highs and swing lows using ta.pivothigh() and ta.pivotlow():
A swing high forms when a bar’s high is higher than a specified number of bars to the left and to the right.
A swing low forms when a bar’s low is lower than a specified number of bars to the left and to the right.
The same pivot logic is applied to both price and RSI.
Because pivots require “right side” bars to form, the indicator:
Waits for the full pivot to be confirmed (no forward-looking referencing beyond the rightBars parameter).
Only then considers that pivot for divergence detection.
This helps prevent repainting of divergence signals.
How Divergence Is Detected
The script always uses the two most recent confirmed pivots for both price and RSI. It tracks:
Last two swing lows in price and RSI
Last two swing highs in price and RSI
Their pivot bar indexes and values
A basic minimum distance filter between the pivots (in bars) is also applied to reduce noise.
1. Regular Bullish Divergence
Condition:
Price makes a lower low (LL) between the last two lows
RSI makes a higher low (HL) over the same two pivot lows
The RSI difference between the two lows is greater than or equal to the user-defined minimum (Min RSI Difference)
The two low pivots are separated by at least Min Bars Between Swings
Interpretation:
Some traders view this as bearish momentum weakening while price prints a new low. The script only marks this structure; it does not assume any outcome.
On the chart:
Drawn between the previous and current price swing lows
Labeled: “Regular Bullish”
Color: Green (by default in the script)
2. Regular Bearish Divergence
Condition:
Price makes a higher high (HH) between the last two highs
RSI makes a lower high (LH) over the same two pivot highs
RSI difference exceeds Min RSI Difference
Pivots are separated by at least Min Bars Between Swings
Interpretation:
Some traders see this as bullish momentum weakening while price prints a new high. Again, the indicator simply highlights this divergence.
On the chart:
Drawn between the previous and current price swing highs
Labeled: “Regular Bearish”
Color: Red
3. Hidden Bullish Divergence
Condition:
Price makes a higher low (HL) between the last two lows
RSI makes a lower low (LL) over the same two lows
RSI difference exceeds Min RSI Difference
Pivots meet the minimum distance requirement
Interpretation:
Some traders interpret hidden bullish divergence as a potential trend continuation signal within an existing uptrend. The indicator does not classify trends; it just tags the pattern when price and RSI pivots meet the conditions.
On the chart:
Drawn between the previous and current price swing lows
Labeled: “Hidden Bullish”
Color: Teal
4. Hidden Bearish Divergence
Condition:
Price makes a lower high (LH) between the last two highs
RSI makes a higher high (HH) over those highs
RSI difference exceeds Min RSI Difference
Pivots meet the minimum distance filter
Interpretation:
Some traders associate hidden bearish divergence with potential downtrend continuation, but again, this script only visualizes the structure.
On the chart:
Drawn between the previous and current price swing highs
Labeled: “Hidden Bearish”
Color: Orange
Inputs and Settings
1. RSI Settings
RSI Source – Price source for RSI (default: close).
RSI Length – Period for RSI calculation (default: 14).
These control the responsiveness of the RSI. Shorter lengths may show more frequent divergence; longer lengths smooth the signal.
2. Swing / Pivot Settings
Left Swing Bars (leftBars)
Right Swing Bars (rightBars)
These define how strict the pivot detection is:
Higher values → fewer, more significant swings
Lower values → more swings, more signals
Because the script uses ta.pivothigh / ta.pivotlow, a pivot is only confirmed once rightBars candles have closed after the candidate bar. This is an intentional design to reduce repainting and make pivots stable.
3. Divergence Filters
Min Bars Between Swings (Min Bars Between Swings)
Requires a minimum bar distance between the two pivots used to form divergence.
Helps avoid clutter from pivots that are too close to each other.
Min RSI Difference (Min RSI Difference)
Requires a minimum absolute difference between RSI values at the two pivots.
Filters out very minor changes in RSI that may not be meaningful.
4. Visibility Toggles
Show Regular Divergence
Show Hidden Divergence
You can choose to display:
Both regular and hidden divergence, or
Only regular divergence, or
Only hidden divergence
This is useful if you prefer to focus on one type of structure.
5. Alerts
Enable Alerts
When enabled, the script exposes four alert conditions:
Regular Bullish Divergence Confirmed
Regular Bearish Divergence Confirmed
Hidden Bullish Divergence Confirmed
Hidden Bearish Divergence Confirmed
Each alert fires after the corresponding divergence has been fully confirmed based on the pivot and bar confirmation logic. The script does not issue rapid or intrabar signals; it uses confirmed historical conditions.
You can set these in the TradingView Alerts dialog by choosing this indicator and selecting the desired condition.
Visual Elements
On the main price chart, the indicator:
Draws a line between the two price pivots involved in the divergence.
Adds a small label at the latest pivot, describing the divergence type.
Colors are used to differentiate divergence categories (Green/Red/Teal/Orange).
This makes it easy to visually scan the chart for zones where price and RSI have diverged.
What to Look For (Analytical Use)
This indicator is intended as a visual helper, especially when:
You want to quickly see where price made new highs or lows while RSI did not confirm them in the same way.
You are studying momentum exhaustion, shifts, or continuation using RSI divergence as one of many tools.
You want to compare divergence occurrences across different timeframes or instruments.
Important:
The indicator does not tell you when to enter or exit trades.
It does not rank or validate the “quality” of a divergence.
Divergence can persist or fail; it is not a guarantee of reversal or continuation.
Many traders combine divergence analysis with:
Higher timeframe context
Trend filters (moving averages, structure)
Support/resistance zones or liquidity areas
Volume, structure breaks, or other confirmations
Disclaimer
This script is provided for educational and analytical purposes only.
It does not constitute financial advice, trading advice, or investment recommendations.
No part of this indicator is intended to suggest, encourage, or guarantee any specific trading outcome.
Users are solely responsible for their own decisions and risk management.

Delta Volume RSI1. Introduction
The Delta Volume RSI (Relative Strength Index based on Volume Delta) indicator provides a unique perspective on market momentum by analyzing the average gains and losses of the volume delta —the difference between buying and selling volume—over a specified period. Unlike traditional RSI, which focuses on price changes, this indicator evaluates shifts in market participation intensity, helping traders detect periods of accumulation and distribution through volume action.
2. Key Features
- Volume-Based Calculation: Computes RSI using the average gains and losses of delta volume rather than price changes, offering insights into buying/selling pressure.
- Dynamic Color Coding: Paints the indicator line green when above the 50 level, and red when below, enabling quick visual identification of momentum shifts around neutrality.
- Reference Levels: Clearly displays overbought (70), neutral (50), and oversold (30) lines for context on volume-driven market extremes.
- Customizable Period: Users can set the period for RSI calculation to fit their trading style and timeframe preferences.
3. How to Use
1. Interpret Colors: The indicator line turns green when volume delta momentum is bullish (above 50) and red when bearish (below 50). Overbought and oversold zones (above 70 or below 30) may highlight exhaustion in volume-driven pushes.
2. Adjustment: Modify the RSI period in the settings to tailor responsiveness.
3. Reference Line: Use the dashed gray line at 50 as a core threshold for detecting transitions between buyer and seller dominance.
How It Differs From Standard RSI
The standard RSI uses changes in closing price to calculate market momentum. In contrast, this indicator calculates RSI using the average gains and losses of the delta volume , capturing underlying shifts in buying and selling activity—even when price is flat. This makes the Delta Volume RSI especially useful for identifying divergence between volume flow and price movement, potentially signaling strong accumulation/distribution or market reversals not visible on price-based RSI alone.

RSI PriceThe relative strength index (RSI) is a momentum indicator used in technical analysis. RSI measures the speed and magnitude of a security's recent price changes to detect overbought or oversold conditions in the price of that security. The RSI is displayed as an oscillator (a line graph) on a scale of 0 to 100.
Traditionally, an RSI reading of 70 or above indicates an overbought condition. A reading of 30 or below indicates an oversold condition. In addition to identifying overbought and oversold securities, the RSI can also indicate securities that may be primed for a trend reversal or a corrective pullback in price.

TradingBot - Multi-RSI Histogram & Signal SmootherMulti-RSI Histogram & Signal Smoother
This indicator combines three RSI calculations and transforms their relative differences into a histogram, allowing users to observe shifts in momentum and market character in a structured, visual format. The goal of this tool is to present RSI-based relationships in a way that is easier to interpret compared to individual RSI lines, especially in environments where price moves between trending and ranging behaviour.
--------------------------------------------------------------------------------
How It Works (Objective Explanation)
--------------------------------------------------------------------------------
- The script calculates three RSI values using different lengths.
- It measures their relative differences (RSI3–RSI7, RSI7–RSI14, RSI3–RSI14).
- These three difference values are combined into a single histogram.
- A moving average (EMA) of the histogram is plotted to highlight short-term changes in the aggregated signal.
This approach allows users to view how multiple RSI speeds diverge or converge, which may help them evaluate momentum shifts. The histogram uses a gradient color scale purely for visual clarity.
--------------------------------------------------------------------------------
What the Indicator Shows (Non-Promotional)
--------------------------------------------------------------------------------
- Increasing histogram values simply mean the faster RSIs are rising relatively stronger than the slower RSIs.
- Decreasing histogram values indicate the opposite — fast RSIs weakening relative to slower ones.
- The EMA line smooths the raw histogram to make the changes easier to observe.
This indicator does not predict future price movement. It only reflects the real-time relationship between different RSI settings.
--------------------------------------------------------------------------------
Possible Use Cases (Allowed Under TradingView Rules)
--------------------------------------------------------------------------------
These are general technical-analysis use cases, not financial advice:
1. Identifying momentum compression or expansion
- When the histogram stays near zero, the different RSIs are close together.
- This may occur during consolidation phases.
2. Observing momentum transitions
- A shift from negative to positive values (or vice versa) shows a relative change in RSI behaviour.
- The EMA may help users track such transitions more smoothly.
3. Supporting existing strategies
- This indicator can be used as an additional layer of confirmation in systems that already rely on momentum or RSI-based tools.
- It should not be used as a standalone decision-making tool.
--------------------------------------------------------------------------------
Important Notes (Required for House-Rule Compliance)
--------------------------------------------------------------------------------
- This indicator does not generate buy or sell signals.
- It is not a guarantee of performance and should not be interpreted as financial advice.
- Past performance of any technical method does not ensure future outcomes.
- Users should test this script and adjust parameters based on their own preferences and trading approach.
TDI Advanced Signals with EMA FilterBuy and sell signals based on the TDI also includes the EMA filter, which is optional.
