RSI & Stochastic RSIRSI and Stochastic RSI Same Chart
Turn on StochRSI crossover signals
Customizable values
Поиск скриптов по запросу "stoch"

RSI + STOCH RSI - Marx_CapitalSimple RSI + STOCH RSI indicator in one pane. In addition to the standard 30/70 and 20/80 RSI levels you have three adjustable levels (eg. 0, 50, 100) to indicate STOCH RSI overbought/oversold scenarios.

Range Oascilator + LessDivergences + MACD+StochRSIRange Oscillator + EMA Filter
Calculates a custom oscillator based on the highest high and lowest low over a chosen period.
Generates BUY signals when the oscillator crosses up from the oversold zone and price is above the EMA.
Generates SELL signals when the oscillator crosses down from the overbought zone and price is below the EMA.
MACD (3‑10‑16 EMA Settings)
Uses fast EMA = 3, slow EMA = 10, signal EMA = 16.
Detects bullish and bearish crossovers.
These crossovers only trigger a single unified buy/sell signal if they coincide with Stochastic RSI being in oversold (for buy) or overbought (for sell) zones.
Stochastic RSI
Standard calculation with %K and %D smoothing.
Defines oversold (<20) and overbought (>80) zones.
Used both for divergence detection and as a filter for MACD signals.
Divergence Detection
RSI Divergence: Price makes a lower low but RSI makes a higher low (bullish), or price makes a higher high but RSI makes a lower high (bearish).
MACD Histogram Divergence: Price makes a lower low but MACD histogram makes a higher low (bullish), or price makes a higher high but MACD histogram makes a lower high (bearish).
Stochastic RSI Divergence: Similar logic applied to %K line.
Divergences are flagged only once per pivot to avoid repetitive signals.
Visuals
EMA plotted on chart.
BUY/SELL signals shown as triangles above/below bars.
Divergences shown as labels (e.g., “RSI BullDiv”, “MACD BearDiv”).
Unified MACD+Stoch RSI signals shown in distinct colors (lime for buy, orange for sell).

Relative Strength Index - Divergences, Stoch, Reverse StochThis is aggregation of RSI indicators - RSI, Divergences, Reverse & Stochastic RSI
Thanks to ©JayTradingCharts and ©mohanee for the RSI Divergences code
Thanks to BApig - Motgench, balipour and Wugamlo for the reverse stoch code
Changes:
1. Add option to calc divs based on close or wicks or both (RSI is close based)
2. Add pivots (marking local high/low)
3. Update to Pine v5
4. Cleanup of unused code

RSI + STOCHRSI - combinedRSI + Stoch RSI combined script
Very usable for free accounts with indicator limits.
Use 2 indicators as 1

RSI + Stoch/RSIThis is a combination of 2 of the most used indicators. RSI and stochastic/RSI
Ive coded them both to work together to save space on your chart and work as only ONE indicator.
I specifically only use the D line with my rsi , but you have the option to use the K and D line if you so choose.
RSI is good for momentum
Stochastic is good for short term momentum.
They work very well together and if you are a swing trader or scalper they can help immensely when looking for sniper entry areas after you've done you're initial pattern, level, fibonacci and wave analysis.
I like the way this works and have been using these two indicators for a while so I figured I would share.
Happy new year everyone, God bless!
CCT StochRSI [LazyBear]CCT StochRSI, proposed by Steve Karnish of Cedar Creek Trading, reconfigures classic StochRSI using custom parameters and smoothing.
There are 6 types supported.
Common formula:
(rsi - lowest(rsi, x)) / (highest(rsi, y) - lowest(rsi, z)) * 100
Smoothed formula:
ema(common formula result, len)
Settings (values for x/y/z/len in the above formulae):
Type 1: RSILength=21, x=8, y=13, z=13, len=N/A
Type 2: RSILength=21, x=21, y=21, z=21, len=N/A
Type 3: RSILength=14, x=14, y=14, z=14, len=N/A
Type 4: RSILength=21, x=13, y=8, z=13, len=8
Type 5: RSILength=5, x=5, y=5, z=5, len=3
Type 6: RSILength=13, x=13, y=13, z=13, len=3
Apart from these default types, this also supports user-specified custom type (select "0" for "Type" option).
All 6 types:
CCT StochRSI compared against normal StochRSI:
List of my public indicators: bit.ly
List of my app-store indicators: blog.tradingview.com

Multi-Timeframe Stochastic Alert [tradeviZion]# Multi-Timeframe Stochastic Alert : Complete User Guide
## 1. Introduction
### What is the Multi-Timeframe Stochastic Alert?
The Multi-Timeframe Stochastic Alert is an advanced technical analysis tool that helps traders identify potential trading opportunities by analyzing momentum across multiple timeframes. It combines the power of the stochastic oscillator with multi-timeframe analysis to provide more reliable trading signals.
### Key Features and Benefits
- Simultaneous analysis of 6 different timeframes
- Advanced alert system with customizable conditions
- Real-time visual feedback with color-coded signals
- Comprehensive data table with instant market insights
- Motivational trading messages for psychological support
- Flexible theme support for comfortable viewing
### How it Can Help Your Trading
- Identify stronger trends by confirming momentum across multiple timeframes
- Reduce false signals through multi-timeframe confirmation
- Stay informed of market changes with customizable alerts
- Make more informed decisions with comprehensive market data
- Maintain trading discipline with clear visual signals
## 2. Understanding the Display
### The Stochastic Chart
The main chart displays three key components:
1. ** K-Line (Fast) **: The primary stochastic line (default color: green)
2. ** D-Line (Slow) **: The signal line (default color: red)
3. ** Reference Lines **:
- Overbought Level (80): Upper dashed line
- Middle Line (50): Center dashed line
- Oversold Level (20): Lower dashed line
### The Information Table
The table provides a comprehensive view of stochastic readings across all timeframes. Here's what each column means:
#### Column Explanations:
1. ** Timeframe **
- Shows the time period for each row
- Example: "5" = 5 minutes, "15" = 15 minutes, etc.
2. ** K Value **
- The fast stochastic line value (0-100)
- Higher values indicate stronger upward momentum
- Lower values indicate stronger downward momentum
3. ** D Value **
- The slow stochastic line value (0-100)
- Helps confirm momentum direction
- Crossovers with K-line can signal potential trades
4. ** Status **
- Shows current momentum with symbols:
- ▲ = Increasing (bullish)
- ▼ = Decreasing (bearish)
- Color matches the trend direction
5. ** Trend **
- Shows the current market condition:
- "Overbought" (above 80)
- "Bullish" (above 50)
- "Bearish" (below 50)
- "Oversold" (below 20)
#### Row Explanations:
1. ** Title Row **
- Shows "🎯 Multi-Timeframe Stochastic"
- Indicates the indicator is active
2. ** Header Row **
- Contains column titles
- Dark blue background for easy reading
3. ** Timeframe Rows **
- Six rows showing different timeframe analyses
- Each row updates independently
- Color-coded for easy trend identification
4. **Message Row**
- Shows rotating motivational messages
- Updates every 5 bars
- Helps maintain trading discipline
### Visual Indicators and Colors
- ** Green Background **: Indicates bullish conditions
- ** Red Background **: Indicates bearish conditions
- ** Color Intensity **: Shows strength of the signal
- ** Background Highlights **: Appear when alert conditions are met
## 3. Core Settings Groups
### Stochastic Settings
These settings control the core calculation of the stochastic oscillator.
1. ** Length (Default: 14) **
- What it does: Determines the lookback period for calculations
- Higher values (e.g., 21): More stable, fewer signals
- Lower values (e.g., 8): More sensitive, more signals
- Recommended:
* Day Trading: 8-14
* Swing Trading: 14-21
* Position Trading: 21-30
2. ** Smooth K (Default: 3) **
- What it does: Smooths the main stochastic line
- Higher values: Smoother line, fewer false signals
- Lower values: More responsive, but more noise
- Recommended:
* Day Trading: 2-3
* Swing Trading: 3-5
* Position Trading: 5-7
3. ** Smooth D (Default: 3) **
- What it does: Smooths the signal line
- Works in conjunction with Smooth K
- Usually kept equal to or slightly higher than Smooth K
- Recommended: Keep same as Smooth K for consistency
4. ** Source (Default: Close) **
- What it does: Determines price data for calculations
- Options: Close, Open, High, Low, HL2, HLC3, OHLC4
- Recommended: Stick with Close for most reliable signals
### Timeframe Settings
Controls the multiple timeframes analyzed by the indicator.
1. ** Main Timeframes (TF1-TF6) **
- TF1 (Default: 10): Shortest timeframe for quick signals
- TF2 (Default: 15): Short-term trend confirmation
- TF3 (Default: 30): Medium-term trend analysis
- TF4 (Default: 30): Additional medium-term confirmation
- TF5 (Default: 60): Longer-term trend analysis
- TF6 (Default: 240): Major trend confirmation
Recommended Combinations:
* Scalping: 1, 3, 5, 15, 30, 60
* Day Trading: 5, 15, 30, 60, 240, D
* Swing Trading: 15, 60, 240, D, W, M
2. ** Wait for Bar Close (Default: true) **
- What it does: Controls when calculations update
- True: More reliable but slightly delayed signals
- False: Faster signals but may change before bar closes
- Recommended: Keep True for more reliable signals
### Alert Settings
#### Main Alert Settings
1. ** Enable Alerts (Default: true) **
- Master switch for all alert notifications
- Toggle this off when you don't want any alerts
- Useful during testing or when you want to focus on visual signals only
2. ** Alert Condition (Options) **
- "Above Middle": Bullish momentum alerts only
- "Below Middle": Bearish momentum alerts only
- "Both": Alerts for both directions
- Recommended:
* Trending Markets: Choose direction matching the trend
* Ranging Markets: Use "Both" to catch reversals
* New Traders: Start with "Both" until you develop a specific strategy
3. ** Alert Frequency **
- "Once Per Bar": Immediate alerts during the bar
- "Once Per Bar Close": Alerts only after bar closes
- Recommended:
* Day Trading: "Once Per Bar" for quick reactions
* Swing Trading: "Once Per Bar Close" for confirmed signals
* Beginners: "Once Per Bar Close" to reduce false signals
#### Timeframe Check Settings
1. ** First Check (TF1) **
- Purpose: Confirms basic trend direction
- Alert Triggers When:
* For Bullish: Stochastic is above middle line (50)
* For Bearish: Stochastic is below middle line (50)
* For Both: Triggers in either direction based on position relative to middle line
- Settings:
* Enable/Disable: Turn first check on/off
* Timeframe: Default 5 minutes
- Best Used For:
* Quick trend confirmation
* Entry timing
* Scalping setups
2. ** Second Check (TF2) **
- Purpose: Confirms both position and momentum
- Alert Triggers When:
* For Bullish: Stochastic is above middle line AND both K&D lines are increasing
* For Bearish: Stochastic is below middle line AND both K&D lines are decreasing
* For Both: Triggers based on position and direction matching current condition
- Settings:
* Enable/Disable: Turn second check on/off
* Timeframe: Default 15 minutes
- Best Used For:
* Trend strength confirmation
* Avoiding false breakouts
* Day trading setups
3. ** Third Check (TF3) **
- Purpose: Confirms overall momentum direction
- Alert Triggers When:
* For Bullish: Both K&D lines are increasing (momentum confirmation)
* For Bearish: Both K&D lines are decreasing (momentum confirmation)
* For Both: Triggers based on matching momentum direction
- Settings:
* Enable/Disable: Turn third check on/off
* Timeframe: Default 30 minutes
- Best Used For:
* Major trend confirmation
* Swing trading setups
* Avoiding trades against the main trend
Note: All three conditions must be met simultaneously for the alert to trigger. This multi-timeframe confirmation helps reduce false signals and provides stronger trade setups.
#### Alert Combinations Examples
1. ** Conservative Setup **
- Enable all three checks
- Use "Once Per Bar Close"
- Timeframe Selection Example:
* First Check: 15 minutes
* Second Check: 1 hour (60 minutes)
* Third Check: 4 hours (240 minutes)
- Wider gaps between timeframes reduce noise and false signals
- Best for: Swing trading, beginners
2. ** Aggressive Setup **
- Enable first two checks only
- Use "Once Per Bar"
- Timeframe Selection Example:
* First Check: 5 minutes
* Second Check: 15 minutes
- Closer timeframes for quicker signals
- Best for: Day trading, experienced traders
3. ** Balanced Setup **
- Enable all checks
- Use "Once Per Bar"
- Timeframe Selection Example:
* First Check: 5 minutes
* Second Check: 15 minutes
* Third Check: 1 hour (60 minutes)
- Balanced spacing between timeframes
- Best for: All-around trading
### Visual Settings
#### Alert Visual Settings
1. ** Show Background Color (Default: true) **
- What it does: Highlights chart background when alerts trigger
- Benefits:
* Makes signals more visible
* Helps spot opportunities quickly
* Provides visual confirmation of alerts
- When to disable:
* If using multiple indicators
* When preferring a cleaner chart
* During manual backtesting
2. ** Background Transparency (Default: 90) **
- Range: 0 (solid) to 100 (invisible)
- Recommended Settings:
* Clean Charts: 90-95
* Multiple Indicators: 85-90
* Single Indicator: 80-85
- Tip: Adjust based on your chart's overall visibility
3. ** Background Colors **
- Bullish Background:
* Default: Green
* Indicates upward momentum
* Customizable to match your theme
- Bearish Background:
* Default: Red
* Indicates downward momentum
* Customizable to match your theme
#### Level Settings
1. ** Oversold Level (Default: 20) **
- Traditional Setting: 20
- Adjustable Range: 0-100
- Usage:
* Lower values (e.g., 10): More conservative
* Higher values (e.g., 30): More aggressive
- Trading Applications:
* Potential bullish reversal zone
* Support level in uptrends
* Entry point for long positions
2. ** Overbought Level (Default: 80) **
- Traditional Setting: 80
- Adjustable Range: 0-100
- Usage:
* Lower values (e.g., 70): More aggressive
* Higher values (e.g., 90): More conservative
- Trading Applications:
* Potential bearish reversal zone
* Resistance level in downtrends
* Exit point for long positions
3. ** Middle Line (Default: 50) **
- Purpose: Trend direction separator
- Applications:
* Above 50: Bullish territory
* Below 50: Bearish territory
* Crossing 50: Potential trend change
- Trading Uses:
* Trend confirmation
* Entry/exit trigger
* Risk management level
#### Color Settings
1. ** Bullish Color (Default: Green) **
- Used for:
* K-Line (Main stochastic line)
* Status symbols when trending up
* Trend labels for bullish conditions
- Customization:
* Choose colors that stand out
* Match your trading platform theme
* Consider color blindness accessibility
2. ** Bearish Color (Default: Red) **
- Used for:
* D-Line (Signal line)
* Status symbols when trending down
* Trend labels for bearish conditions
- Customization:
* Choose contrasting colors
* Ensure visibility on your chart
* Consider monitor settings
3. ** Neutral Color (Default: Gray) **
- Used for:
* Middle line (50 level)
- Customization:
* Should be less prominent
* Easy on the eyes
* Good background contrast
### Theme Settings
1. **Color Theme Options**
- Dark Theme (Default):
* Dark background with white text
* Optimized for dark chart backgrounds
* Reduces eye strain in low light
- Light Theme:
* Light background with black text
* Better visibility in bright conditions
- Custom Theme:
* Use your own color preferences
2. ** Available Theme Colors **
- Table Background
- Table Text
- Table Headers
Note: The theme affects only the table display colors. The stochastic lines and alert backgrounds use their own color settings.
### Table Settings
#### Position and Size
1. ** Table Position **
- Options:
* Top Right (Default)
* Middle Right
* Bottom Right
* Top Left
* Middle Left
* Bottom Left
- Considerations:
* Chart space utilization
* Personal preference
* Multiple monitor setups
2. ** Text Sizes **
- Title Size Options:
* Tiny: Minimal space usage
* Small: Compact but readable
* Normal (Default): Standard visibility
* Large: Enhanced readability
* Huge: Maximum visibility
- Data Size Options:
* Recommended: One size smaller than title
* Adjust based on screen resolution
* Consider viewing distance
3. ** Empowering Messages **
- Purpose:
* Maintain trading discipline
* Provide psychological support
* Remind of best practices
- Rotation:
* Changes every 5 bars
* Categories include:
- Market Wisdom
- Strategy & Discipline
- Mindset & Growth
- Technical Mastery
- Market Philosophy
## 4. Setting Up for Different Trading Styles
### Day Trading Setup
1. **Timeframes**
- Primary: 5, 15, 30 minutes
- Secondary: 1H, 4H
- Alert Settings: "Once Per Bar"
2. ** Stochastic Settings **
- Length: 8-14
- Smooth K/D: 2-3
- Alert Condition: Match market trend
3. ** Visual Settings **
- Background: Enabled
- Transparency: 85-90
- Theme: Based on trading hours
### Swing Trading Setup
1. ** Timeframes **
- Primary: 1H, 4H, Daily
- Secondary: Weekly
- Alert Settings: "Once Per Bar Close"
2. ** Stochastic Settings **
- Length: 14-21
- Smooth K/D: 3-5
- Alert Condition: "Both"
3. ** Visual Settings **
- Background: Optional
- Transparency: 90-95
- Theme: Personal preference
### Position Trading Setup
1. ** Timeframes **
- Primary: Daily, Weekly
- Secondary: Monthly
- Alert Settings: "Once Per Bar Close"
2. ** Stochastic Settings **
- Length: 21-30
- Smooth K/D: 5-7
- Alert Condition: "Both"
3. ** Visual Settings **
- Background: Disabled
- Focus on table data
- Theme: High contrast
## 5. Troubleshooting Guide
### Common Issues and Solutions
1. ** Too Many Alerts **
- Cause: Settings too sensitive
- Solutions:
* Increase timeframe intervals
* Use "Once Per Bar Close"
* Enable fewer timeframe checks
* Adjust stochastic length higher
2. ** Missed Signals **
- Cause: Settings too conservative
- Solutions:
* Decrease timeframe intervals
* Use "Once Per Bar"
* Enable more timeframe checks
* Adjust stochastic length lower
3. ** False Signals **
- Cause: Insufficient confirmation
- Solutions:
* Enable all three timeframe checks
* Use larger timeframe gaps
* Wait for bar close
* Confirm with price action
4. ** Visual Clarity Issues **
- Cause: Poor contrast or overlap
- Solutions:
* Adjust transparency
* Change theme settings
* Reposition table
* Modify color scheme
### Best Practices
1. ** Getting Started **
- Start with default settings
- Use "Both" alert condition
- Enable all timeframe checks
- Wait for bar close
- Monitor for a few days
2. ** Fine-Tuning **
- Adjust one setting at a time
- Document changes and results
- Test in different market conditions
- Find your optimal timeframe combination
- Balance sensitivity with reliability
3. ** Risk Management **
- Don't trade against major trends
- Confirm signals with price action
- Use appropriate position sizing
- Set clear stop losses
- Follow your trading plan
4. ** Regular Maintenance **
- Review settings weekly
- Adjust for market conditions
- Update color scheme for visibility
- Clean up chart regularly
- Maintain trading journal
## 6. Tips for Success
1. ** Entry Strategies **
- Wait for all timeframes to align
- Confirm with price action
- Use proper position sizing
- Consider market conditions
2. ** Exit Strategies **
- Trail stops using indicator levels
- Take partial profits at targets
- Honor your stop losses
- Don't fight the trend
3. ** Psychology **
- Stay disciplined with settings
- Don't override system signals
- Keep emotions in check
- Learn from each trade
4. ** Continuous Improvement **
- Record your trades
- Review performance regularly
- Adjust settings gradually
- Stay educated on markets

MTF Stoch RSI + Realtime DivergencesMulti-timeframe Stochastic RSI + Realtime Divergences + Alerts + Pivot lookback periods.
This version of the Stochastic RSI adds the following additional features to the stock UO by Tradingview:
- Optional 3 x Multiple-timeframe overbought and oversold signals, indicating where 3 selected timeframes are all overbought (>80) or all oversold (<20) at the same time, with alert option.
- Optional divergence lines drawn directly onto the oscillator in realtime, with alert options.
- Configurable lookback periods to fine tune the divergences drawn in order to suit different trading styles and timeframes, including the ability to enable automatic adjustment of pivot period per chart timeframe.
- Alternate timeframe feature allows you to configure the oscillator to use data from a different timeframe than the chart it is loaded on.
- Indications where the Stoch RSI is crossing down from above the overbought threshold (<80) and crossing above the oversold threshold (>20) levels on a given user selected timeframe, by printing gold dots on the indicator.
- Also includes standard configurable Stoch RSI options, including k length, d length, RSI length, Stochastic length, and source type (close, hl2, etc)
While this version of the Stochastic RSI has the ability to draw divergences in realtime along with related settings and alerts so you can be notified as divergences occur without spending all day watching the charts, the main purpose of this indicator was to provide the triple multiple-timeframe overbought and oversold confluence signals and alerts, in an attempt to add more confluence, weight and reliability to the single timeframe overbought and oversold states, commonly used for trade entry confluence. It's primary purpose is intended for scalping on lower timeframes, typically between 1-15 minutes. The triple timeframe overbought can often indicate near term reversals to the downside, with the triple timeframe oversold often indicating neartime reversals to the upside. The default timeframes for this confluence are set to check the 1 minute, 5 minute, and 15 minute timeframes, ideal for scalping the < 15 minute charts.
The Stochastic RSI
The popular oscillator has been described as follows:
“The Stochastic RSI is an indicator used in technical analysis that ranges between zero and one (or zero and 100 on some charting platforms) and is created by applying the Stochastic oscillator formula to a set of relative strength index (RSI) values rather than to standard price data. Using RSI values within the Stochastic formula gives traders an idea of whether the current RSI value is overbought or oversold. The Stochastic RSI oscillator was developed to take advantage of both momentum indicators in order to create a more sensitive indicator that is attuned to a specific security's historical performance rather than a generalized analysis of price change.”
How do traders use overbought and oversold levels in their trading?
The oversold level, that is when the Stochastic RSI is above the 80 level is typically interpreted as being 'overbought', and below the 20 level is typically considered 'oversold'. Traders will often use the Stochastic RSI at an overbought level as a confluence for entry into a short position, and the Stochastic RSI at an oversold level as a confluence for an entry into a long position. These levels do not mean that price will necessarily reverse at those levels in a reliable way, however. This is why this version of the Stoch RSI employs the triple timeframe overbought and oversold confluence, in an attempt to add a more confluence and reliability to this usage of the Stoch RSI.
What are divergences?
Divergence is when the price of an asset is moving in the opposite direction of a technical indicator, such as an oscillator, or is moving contrary to other data. Divergence warns that the current price trend may be weakening, and in some cases may lead to the price changing direction.
There are 4 main types of divergence, which are split into 2 categories;
regular divergences and hidden divergences. Regular divergences indicate possible trend reversals, and hidden divergences indicate possible trend continuation.
Regular bullish divergence: An indication of a potential trend reversal, from the current downtrend, to an uptrend.
Regular bearish divergence: An indication of a potential trend reversal, from the current uptrend, to a downtrend.
Hidden bullish divergence: An indication of a potential uptrend continuation.
Hidden bearish divergence: An indication of a potential downtrend continuation.
Setting alerts.
With this indicator you can set alerts to notify you when any/all of the above types of divergences occur, on any chart timeframe you choose, and also when the triple timeframe overbought and oversold confluences occur.
Configurable pivot lookback values.
You can adjust the default pivot lookback values to suit your prefered trading style and timeframe. If you like to trade a shorter time frame, lowering the default lookback values will make the divergences drawn more sensitive to short term price action. By default, this indicator has enabled the automatic adjustment of the pivot periods for 4 configurable timeframes, in a bid to optimise the divergences drawn when the indicator is loaded onto any of the 4 timeframes. These timeframes and the auto adjusted pivot periods on each of them can also be reconfigured within the settings menu.
How do traders use divergences in their trading?
A divergence is considered a leading indicator in technical analysis , meaning it has the ability to indicate a potential price move in the short term future.
Hidden bullish and hidden bearish divergences, which indicate a potential continuation of the current trend are sometimes considered a good place for traders to begin, since trend continuation occurs more frequently than reversals, or trend changes.
When trading regular bullish divergences and regular bearish divergences, which are indications of a trend reversal, the probability of it doing so may increase when these occur at a strong support or resistance level . A common mistake new traders make is to get into a regular divergence trade too early, assuming it will immediately reverse, but these can continue to form for some time before the trend eventually changes, by using forms of support or resistance as an added confluence, such as when price reaches a moving average, the success rate when trading these patterns may increase.
Typically, traders will manually draw lines across the swing highs and swing lows of both the price chart and the oscillator to see whether they appear to present a divergence, this indicator will draw them for you, quickly and clearly, and can notify you when they occur.
Disclaimer: This script includes code from the stock UO by Tradingview as well as the Divergence for Many Indicators v4 by LonesomeTheBlue.

Rsi/W%R/Stoch/Mfi: HTF overlay mini-plotsOverlay mini-plots for various indicators. Shows current timeframe; and option to plot 2x higher timeframes (i.e. 15min and 60min on the 5min chart above).
The idea is to de-clutter chart when you just want real-time snippets for an indicator.
Useful for gauging overbought/oversold, across timeframes, at a glance.
~~Indicators~~
~RSI: Relative strength index
~W%R: Williams percent range
~Stochastic
~MFI: Money flow index
~~Inputs~~
~indicator length (NB default is set to 12, NOT the standard 14)
~choose 2x HTFs, show/hide HTF plots
~choose number of bars to show (current timeframe only; HTF plots show only 6 bars)
~horizontal position: offset (bars); shift plots right or left. Can be negative
~vertical position: top/middle/bottom
~other formatting options (color, line thickness, show/hide labels, 70/30 lines, 80/20 lines)
~~tips~~
~should be relatively easy to add further indicators, so long as they are 0-100 based; by editing lines 9 and 11
~change the vertical compression of the plots by playing around with the numbers (+100, -400, etc) in lines 24 and 25

CC STOCH RSI [Rogulabo]3 indicators in 1.
Included Indicators are:
- Correlation Coefficient
- RSI
- Stochastics
Basic usage of these indicators respectively are:
- CC value of 1 represents a perfect correlation, while a value of -1 represents an inverted correlation.
- RSI values above 70 is commonly overbought, whilst below 30 is oversold.
- Stochastics for describing the momentum and turning points of price swings.
Please recognize that these are simplified explanations.
Reasons for 3 in 1 assembly:
This indicator is intended to be used by students, and followers of Dan Takahashi
(a prominent educator of investing in Japan who is also a user of TradingView) .
Those who wants to use and learn with the same setup as Dan, would greatly benefit from this since,
the complex setting up process which can be a pain for beginners can be skipped with a simple click.
Every stylistic choice of color and placement were made to make it similar to the chart used by Dan.
Simple customizations are available such as:
- Changing color
- Changing the values
- Hide/show controls
Notes:
This is intended to be used alongside “EMA ICHI BB ” for the complete the setup.
Any questions, please refer to:
@rogulabo
==
高橋ダンさんが使用されてるチャートと同様のセットアップの為にご活用ください。
複数のインジケータをグループにしておりますので、無料版を使われてる方は効率よく使っていただけると思います。
また、“EMA ICHI BB ”どいうタイトルのインジケータも同時に公開しておりますので、セットアップを完成させたい方はこちらもご活用ください。
以下のインジケータを含みます。
・相関係数
・ストキャスティクス
・RSI
カスタマイズされたい方はご自由に値を変更ください。
ご質問は @rogulabo までよろしくお願いいたします。

MTF Stoch RSI ScreenerDisplays when multiple timeframes of Stochastic RSI are overbought/oversold. Multiple consecutive timeframes being overbought/oversold can signify a short term top or bottom.
Thanks to Micse in Pinescripters telegram who helped remove a few errors from this.

RSI and Stoch RSI Midline Crossover ArrowsPuts arrows on chart when RSI crosses over 52 and also when Stoch RSI crosses up 52 based on Warsnop strategy.


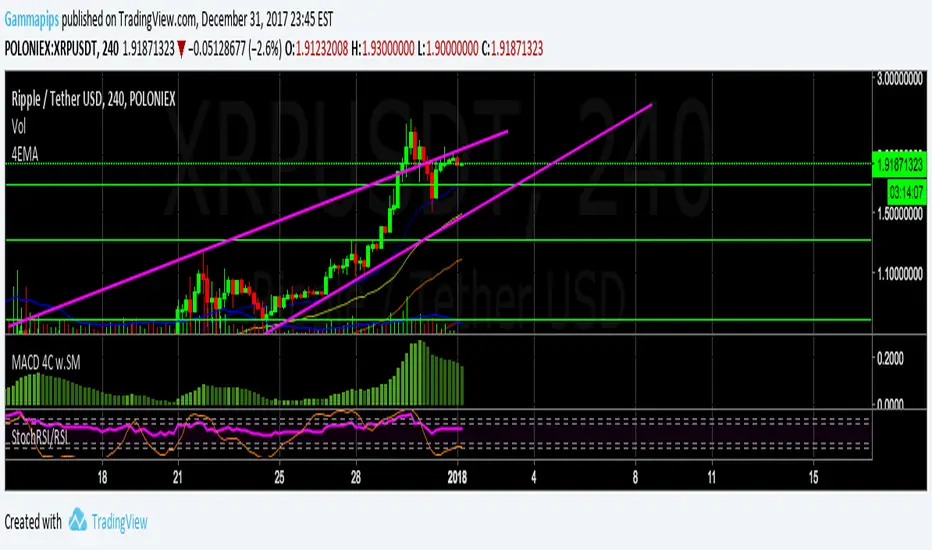
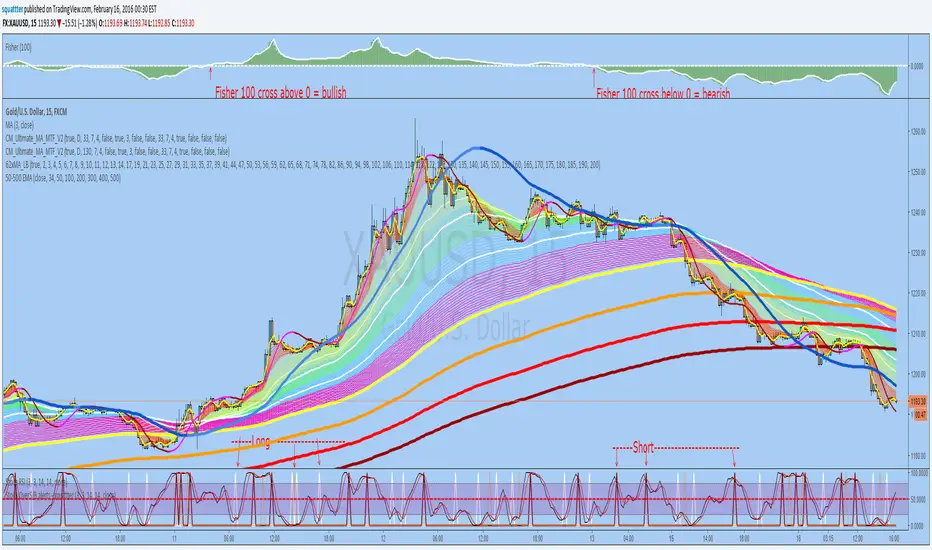
StochRSI overSold/Bought alerts - by squattterDepending on the new trend - Fisher 100 crossing 0;
Set an alert on each Long/Short "crossing down", 0.8 (or anything below 0.99), "on condition"
Multi Stochastic AlertHello Everyone,
I have created a Multi Stochastic Alert based on Scalping Strategy
The Strategy uses below 4 Stochastic indicator:
1. Stochastic (9,3)
2. Stochastic (14,3)
3. Stochastic (40,4)
4. Stochastic (60,10)
Trade entry become active when all of these goes below 20 or above 80, In this indicator you don't need to use all 4, this will show red and green background whenever all of them goes below 20 or above 80.
As shown in picture below, it works better when script is making a channel, Our indicator shows green or red signal, we wait for RSI Divergence and we enter. We book when blue line (9,3) goes above 80, as shown by arrow, and trail rest at breakeven or your own trailing method
Same Situation shown for Short side. We book 50% when Blue line (9,3) Goes below 20 and trail rest at breakeven or your own trailing method
Happy trading, Let me know if any improvements required.

MTF-Colored EMA Difference and Stochastic indicatorThis indicator combines two popular technical analysis tools: the Exponential Moving Average (EMA) and the Stochastic Oscillator, with the added flexibility of analyzing them across multiple time frames. It visually represents the difference between two EMAs and the crossover signals from the Stochastic Oscillator, providing a comprehensive view of the market conditions.
Components:
EMA Difference Histogram :
EMA Calculation : The indicator calculates two EMAs (EMA1 and EMA2) for the selected time frame.
EMA Difference : The difference between EMA1 and EMA2 is plotted as a 4 coloured histogram.
Stochastic Oscillato r:
Calculation : The %K and %D lines of the Stochastic Oscillator are calculated for the selected time frame.
Additional Confirmation via Colors :
Green: %K is above %D, indicating a bullish signal.
Red: %K is below %D, indicating a bearish signal.
Entry and Exit Strategies
Entry Strategy :
Bullish Entry :
Condition 1: The histogram is Dark green (indicating a strong upward trend).
Condition 2: The Stochastic colour is green (%K is above %D).
Bearish Entry :
Condition 1: The histogram is Dark Red (indicating a strong downward trend).
Condition 2: The Stochastic colour is red (%K is below %D).
Exit Strategy:
Bullish Exit:
Condition: The Stochastic colour turns red (%K crosses below %D).
Bearish Exit:
Condition: The Stochastic colour turns green (%K crosses above %D).
Additional Considerations:
Time Frame Selection : The chosen time frame for both the EMA and Stochastic calculations should align with the trader’s strategy (e.g., daily for swing trading, hourly for intraday trading).
Risk Management : Implement stop-loss orders to manage risk effectively. The stop-loss can be placed below the recent swing low for long positions and above the recent swing high for short positions.
Confirmation : Consider using this indicator in conjunction with other technical analysis tools to confirm signals and reduce the likelihood of false entries and exits.

[KVA]K Stochastic IndicatorOriginal Stochastic Oscillator Formula:
%K=(C−Lowest Low)/(Highest High−Lowest Low)×100
Lowest Low refers to the lowest low of the past n periods.
Highest High refers to the highest high of the past n periods.
K Stochastic Indicator Formula:
%K=(Source−Lowest Source)/(Highest Source−Lowest Source)×100
Lowest Source refers to the lowest value of the chosen source over the past length periods.
Highest Source refers to the highest value of the chosen source over the past length periods.
Key Difference :
The original formula calculates %K using the absolute highest high and lowest low of the price over the past n periods.
The K Stochastic formula calculates %K using the highest and lowest values of a chosen source (which could be the close, open, high, or low) over the specified length periods.
So, if _src is set to something other than the high for the Highest Source or something other than the low for the Lowest Source, the K Stochastic will yield different results compared to the original formula which strictly uses the highest high and the lowest low of the price.
Impact on Traders :
Flexibility in Price Source :
By allowing the source (_src) to be customizable, traders can apply the Stochastic calculation to different price points (e.g., open, high, low, close, or even an average of these). This could provide a different perspective on market momentum and potentially offer signals that are more aligned with a trader's specific strategy.
Sensitivity to Price Action :
Changing the source from high/low to potentially less extreme values (like close or open) could result in a less volatile oscillator, smoothing out some of the extreme peaks and troughs and possibly offering a more filtered view of market conditions.
Customization of Periods :
The ability to adjust the length period offers traders the opportunity to fine-tune the sensitivity of the indicator to match their trading horizon. Shorter periods may provide earlier signals, while longer periods could filter out market noise.
Possibility of Applying the Indicator on Other Indicators :
Layered Technical Analysis :
The K Stochastic can be applied to other indicators, not just price. For example, it could be applied to a moving average to analyze its momentum or to indicators like RSI or MACD, offering a meta-analysis that studies the oscillator's behavior of other technical tools.
Creation of Composite Indicator s:
By applying the K Stochastic logic to other indicators, traders could create composite indicators that blend the characteristics of multiple indicators, potentially leading to unique signals that could offer an edge in certain market conditions.
Enhanced Signal Interpretation :
When applied to other indicators, the K Stochastic can help in identifying overbought or oversold conditions within those indicators, offering a different dimension to the interpretation of their output.
Overall Implications :
The KStochastic Indicator's modifications could lead to a more tailored application, giving traders the ability to adapt the tool to their specific trading style and analysis preferences.
By being applicable to other indicators, it broadens the scope of stochastic analysis beyond price action, potentially offering innovative ways to interpret data and make trading decisions.
The changes might also influence the trading signals, either by smoothing the oscillator's output to reduce noise or by altering the sensitivity to generate more or fewer signal
Including the additional %F line, which is unique to the K Stochastic Indicator, further expands the potential impacts and applications for traders:
Impact on Traders with the %F Line:
Triple Smoothing :
The %F line introduces a third level of smoothing, which could help in identifying longer-term trends and filtering out short-term fluctuations. This could be particularly useful for traders looking to avoid whipsaws and focus on more sustained movements.
Potential for Enhanced Confirmation :
The %F line might be used as a confirmation signal. For instance, if all three lines (%K, %D, and %F) are in agreement, a trader might consider this as a stronger signal to buy or sell, as opposed to when only the traditional two lines (%K and %D) are used.
Risk Management:
The additional line could be utilized for more sophisticated risk management strategies, where a trader might decide to scale in or out of positions based on the convergence or divergence of these lines.
Possibility of Applying the Indicator on Other Indicators with the %F Line:
Depth of Analysis :
When applied to other indicators, the %F line can provide an even deeper layer of analysis, perhaps identifying macro trends within the indicator it is applied to, which could go unnoticed with just the traditional two-line approach.
Refined Signal Strength Assessment :
The strength of signals from other indicators could be assessed by the position and direction of the %F line, providing an additional filter to evaluate the robustness of buy or sell signals.
Overall Implications with the %F Line :
The inclusion of the %F line in the K Stochastic Indicator enhances its utility as a tool for trend analysis and signal confirmation. It allows traders to potentially identify and act on more reliable trading opportunities.
This feature can enrich the trader's toolkit by providing a nuanced view of momentum and trend strength, which can be particularly valuable in volatile or choppy markets.
For those applying the K Stochastic to other indicators, the %F line could be integral in creating a multi-tiered analysis strategy, potentially leading to more sophisticated interpretations and decisions.
The presence of the %F line adds a dimension of depth to the analysis possible with the K Stochastic Indicator, making it a versatile tool that could be tailored to a variety of trading styles and objectives. However, as with any indicator, the additional complexity requires careful study and back-testing to ensure its signals are understood and actionable within the context of a comprehensive trading plan.
MTF Fantastic Stochastic (FS+)MTF Fantastic Stochastic (FS+) + Alerts
This chart overlay indicator can signal multiple triple-timeframe Stochastic RSI overbought and oversold confluences directly onto your chart, intended for use as a confluence either for reversal trade entries, or potential trade exits, indicating where price may be probable to reverse.
Features include:
- Primary set of fully configurable triple-timeframe overbought and oversold signals, indicating where 3 selected timeframes are all overbought or all oversold at the same time. Enabled by default.
- Secondary set of fully configurable triple-timeframe overbought and oversold signals, indicating where 3 selected timeframes are all overbought or all oversold at the same time, with alert option. Enabled by default.
- Also includes standard configurable Stoch RSI options, including k length, d length, RSI length, Stochastic length, etc.
- The default primary MTF #1 timeframes are set to 1minute, 5minute and 15minute. These are highly suitable for low timeframe scalpers trading on charts less than 5 minutes, and can often pin point price reversals.
- The default Secondary MTF #2 timeframes are set to 15minute, 30minute and 60minute. These are suitable for both low timeframe scalpers and considerably higher timeframe traders.
- Optional drawing of background colours and/or ribbon seen at bottom of the chart.
- Fully configurable timeframes, as well as overbought and oversold threshold levels for each individual timeframe. Overbought and oversold thresholds are set to the factory 80 and 20 levels respectively for all timeframes by default.
- Alert features for both MTF #1 and MTF #2 triple-timeframe confluences, including options for alerting overbought and oversold individually, as well as an option for alerting either overbought or oversold in a single alert.
Note: THe features listed above are accurate at the time of publishing but maybe updated or added to in future.
The Stochastic RSI
The popular oscillator has been described as follows:
“The Stochastic RSI is an indicator used in technical analysis that ranges between zero and one (or zero and 100 on some charting platforms) and is created by applying the Stochastic oscillator formula to a set of relative strength index ( RSI ) values rather than to standard price data. Using RSI values within the Stochastic formula gives traders an idea of whether the current RSI value is overbought or oversold. The Stochastic RSI oscillator was developed to take advantage of both momentum indicators in order to create a more sensitive indicator that is attuned to a specific security's historical performance rather than a generalized analysis of price change.”
How do traders use overbought and oversold levels in their trading?
The oversold level, that is when the Stochastic RSI is above the 80 level is typically interpreted as being 'overbought', and below the 20 level is typically considered 'oversold'. Traders will often use the Stochastic RSI at an overbought level as a confluence for entry into a short position, and the Stochastic RSI at an oversold level as a confluence for an entry into a long position. These levels do not mean that price will necessarily reverse at those levels in a reliable way, however. This is why this version of the Stoch RSI employs the triple timeframe overbought and oversold confluence, in an attempt to add a more confluence and reliability to this usage of the Stoch RSI.
This indicator was originally built as one of a many features included in the RF+ Divergence Scalping System and has been separated into it's own standalone indicator here for traders who do not want the many other features bundled into the original indicator. A number of features that exist in the original were intensive, and also quite niche. Therefore this lightweight single purpose chart overlay indicator offers this versatile feature of the ever popular Stochastic RSI to a wider audience of traders who may add it to various strategies.

4x Stochastic Combo - %K only4x Stochastic Combo in one indicator.
Default parameters: (9, 3, 3), (14, 3, 3), (40, 4, 4), (60, 10, 10)
Only %K is shown.
Possibility to set alerts "all above 80" or "all below 20".
How to use:
Look for divergence after getting an alert for good quality signals. Connect the stochastic signals with multi-timeframe analysis.

Ehlers Dominant Cycle Stochastic RSIEhlers Enhanced Cycle Stochastic RSI
OVERVIEW
The Ehlers Enhanced Cycle Stochastic RSI is a momentum oscillator that automatically adjusts its lookback periods based on the dominant market cycle. Unlike traditional Stochastic RSI which uses fixed periods, this indicator detects the current cycle length and scales its calculations—making it responsive in fast markets and stable in slow ones.
The indicator combines John Ehlers' digital signal processing research with the classic Stochastic RSI indicator, then adds a confirmation system to ensure cycle measurements are reliable.
THE THEORY
Traditional oscillators use fixed lookback periods (ie, 14-bar RSI). This creates a fundamental problem: markets don't move in fixed cycles. A 14-period RSI might capture the rhythm perfectly during one market phase, then completely miss it when conditions change.
Ehlers' research demonstrated that price data contains measurable cyclical components. If you can detect the dominant cycle length, you can tune your indicators to match it—like tuning a radio to the right frequency.
This indicator takes that concept further by using three independent cycle detection methods and only trusting the measurement when they agree:
Hilbert Transform — A mathematical technique from signal processing that extracts cycle period from the phase relationship between price and its derivative. It is fast but can be noisy.
Autocorrelation Periodogram — Measures how similar the price series is to lagged versions of itself. The lag with highest correlation reveals the dominant cycle. More stable than Hilbert, but slightly slower to adapt.
Goertzel Algorithm (DFT) — A frequency-domain approach that calculates spectral power at each candidate period. Identifies which frequencies contain the most energy.
When all three methods converge on similar period estimates, confidence is high. When they disagree, the market may be in a non-cyclical or in transition.
HOW IT CHANGES THE STOCHASTIC RSI
Standard Stochastic RSI:
1. Calculate RSI with fixed period (14 bars)
2. Apply Stochastic formula over fixed period (14 bars)
3. Smooth with fixed periods
Ehlers Enhanced Cycle Stochastic RSI:
1. Detect dominant cycle using three methods
2. Confirm cycle measurement (methods must agree)
3. Calculate RSI with period scaled to the detected cycle
4. Apply Stochastic formula with cycle-scaled lookback
5. Smooth adaptively
The result: when the market is cycling quickly (say, 15-bar cycles), the indicator uses shorter periods and responds faster. When the market stretches into longer cycles (such as 40-bar cycles), it automatically extends its lookback to avoid whipsaws.
The Period Multipliers let you fine-tune this relationship:
• 1.0 = Use the full detected cycle (smoother, fewer signals)
• 0.5 = Use half the cycle (more responsive, catches turns earlier)
INTERPRETATION
Reading the Oscillator:
• K Line (Blue) — The main signal line. Moves between 0 and 100.
• D Line (Orange) — Smoothed version of K. Use for confirmation.
• Above 80 — Overbought. Momentum stretched to upside.
• Below 20 — Oversold. Momentum stretched to downside.
• Crossovers — K crossing above D suggests bullish momentum shift; K crossing below D suggests bearish.
Spectral Dilation (optional):
When enabled, applies a bandpass filter before cycle detection. This isolates the frequency band of interest and reduces noise. Useful for:
• Very noisy instruments
• Lower timeframes
• When confidence stays persistently low

EQT Stochastic RibbonEQT Stochastic Ribbon is a modified Stochastic Oscillator with ribbon fill visualization.
Features:
- Dynamic color ribbon that changes based on trend direction (Blue for bullish, White for bearish)
- Crossover signals with triangle markers when %K crosses %D
- Customizable colors and signal offset
- Dashed lines at 80/20 levels for overbought/oversold zones
How to use:
- Blue ribbon = Bullish momentum (%K above %D)
- White ribbon = Bearish momentum (%K below %D)
- Triangle up = Buy signal (K crosses above D)
- Triangle down = Sell signal (K crosses below D)
Settings:
- K, D, Smooth - Standard Stochastic parameters
- Signal Offset - Distance of signal arrows from the line
- Bullish/Bearish Colors - Customize ribbon and signal colors

Alt buy signal 1H Entry + 4H Confirm (MACD + Stoch RSI + HMA)This indicator is a multi-timeframe (MTF) analysis tool designed for the ALT trading , capturing entry signals on the 1-hour (1H) timeframe and confirming trends on the 4-hour (4H) timeframe. It combines MACD, Stoch RSI, and Hull Moving Average (HMA) to identify precise buy opportunities, particularly at reversal points after a downtrend or during trend shifts. It visually marks both past and current BUY signals for easy reference.
Key Features:
1H Entry Signal (Early Ping): Triggers on a MACD golden cross (below 0) combined with a Stoch RSI oversold cross (below 20), offering an initial buy opportunity.
4H Trend Confirmation (Entry Ready): Validates the trend with a 4H MACD histogram rising (in negative territory) or a golden cross, plus a Stoch RSI turn-up (above 30).
Past BUY Display: Labels past data points where these conditions were met as "1H BUY" or "FULL BUY," facilitating backtesting.
HMA Filter: Optional HMA(16) to confirm price breakouts, enhancing trend validation.
Purpose: Ideal for short-term scalping and swing trading. Supports a two-step strategy: initial partial entry on 1H signals, followed by additional entry on 4H confirmation.
Usage Instructions
Installation: Add the indicator to an IMX/USDT 1H chart on TradingView.
Signal Interpretation:
lime "1H BUY": 1H conditions met, consider initial entry (stop-loss: 3-5% below recent low).
green "FULL BUY": 1H+4H conditions met, confirm trend for additional entry (take-profit: 10% below recent swing high).
Customization: Adjust TF (1H/4H), MACD/Stoch RSI parameters, and HMA usage via the input settings.
Alert Setup: Enable alerts for "ENTRY READY" (1H+4H) or "EARLY PING" (1H only) conditions.
Advantages
Accuracy: Reduces false signals by combining MACD golden cross below 0 with Stoch RSI oversold conditions.
Dual Confirmation: 1H for quick timing and 4H for trend validation, improving risk management.
Visualization: Past BUY points enable easy backtesting and pattern recognition.
Flexibility: 4H confirmation mode adjustable (histogram rise or golden cross).
Limitations
Timeframe Dependency: Optimized for 1H charts; may not work on other timeframes.
Market Conditions: Potential whipsaws in sideways markets; additional filters (e.g., RSI > 50) recommended.
Manual Management: Stop-loss and take-profit require user discretion.
