RSI MFI MultiTimeframe Oversold/OverboughtHello Traders,
This indicator is designed to easily visualize the overbought/oversold states of RSI and MFI across multiple timeframes.
The indicator is very straightforward.
The deeper the red, the closer it is to 0, and the deeper the green, the closer it is to 100. The intermediate values are rendered in a transparent gray to focus on the key regions.
However, I understand that traders may have an interest in knowing the most recent state of the oscillator, whether it was overbought or oversold.
For this reason, I have included the 'Gradient Color' option in the color settings.
By turning off this option, you can easily see at a glance which region the oscillator was in most recently.
(Gradient Color Option Off)
In addition, I know that many traders are interested in the actual RSI/MFI values across multiple timeframes.
Thus, I have displayed the RSI/MFI values for each timeframe on the far right.
Furthermore, although the name of this indicator is RSI MFI MultiTimeframe Oversold/Overbought, I have also included the Stochastic RSI as an option, as I find it personally useful.
Feel free to use it if you find it helpful.
Поиск скриптов по запросу "stoch"

Possible RSI [Loxx]Possible RSI is a normalized, variety second-pass normalized, Variety RSI with Dynamic Zones and optionl High-Pass IIR digital filtering of source price input. This indicator includes 7 types of RSI.
High-Pass Fitler (optional)
The Ehlers Highpass Filter is a technical analysis tool developed by John F. Ehlers. Based on aerospace analog filters, this filter aims at reducing noise from price data. Ehlers Highpass Filter eliminates wave components with periods longer than a certain value. This reduces lag and makes the oscialltor zero mean. This turns the RSI output into something more similar to Stochasitc RSI where it repsonds to price very quickly.
First Normalization Pass
RSI (Relative Strength Index) is already normalized. Hence, making a normalized RSI seems like a nonsense... if it was not for the "flattening" property of RSI. RSI tends to be flatter and flatter as we increase the calculating period--to the extent that it becomes unusable for levels trading if we increase calculating periods anywhere over the broadly recommended period 8 for RSI. In order to make that (calculating period) have less impact to significant levels usage of RSI trading style in this version a sort of a "raw stochastic" (min/max) normalization is applied.
Second-Pass Variety Normalization Pass
There are three options to choose from:
1. Gaussian (Fisher Transform), this is the default: The Fisher Transform is a function created by John F. Ehlers that converts prices into a Gaussian normal distribution. The normaliztion helps highlights when prices have moved to an extreme, based on recent prices. This may help in spotting turning points in the price of an asset. It also helps show the trend and isolate the price waves within a trend.
2. Softmax: The softmax function, also known as softargmax: or normalized exponential function, converts a vector of K real numbers into a probability distribution of K possible outcomes. It is a generalization of the logistic function to multiple dimensions, and used in multinomial logistic regression. The softmax function is often used as the last activation function of a neural network to normalize the output of a network to a probability distribution over predicted output classes, based on Luce's choice axiom.
3. Regular Normalization (devaitions about the mean): Converts a vector of K real numbers into a probability distribution of K possible outcomes without using log sigmoidal transformation as is done with Softmax. This is basically Softmax without the last step.
Dynamic Zones
As explained in "Stocks & Commodities V15:7 (306-310): Dynamic Zones by Leo Zamansky, Ph .D., and David Stendahl"
Most indicators use a fixed zone for buy and sell signals. Here’ s a concept based on zones that are responsive to past levels of the indicator.
One approach to active investing employs the use of oscillators to exploit tradable market trends. This investing style follows a very simple form of logic: Enter the market only when an oscillator has moved far above or below traditional trading lev- els. However, these oscillator- driven systems lack the ability to evolve with the market because they use fixed buy and sell zones. Traders typically use one set of buy and sell zones for a bull market and substantially different zones for a bear market. And therein lies the problem.
Once traders begin introducing their market opinions into trading equations, by changing the zones, they negate the system’s mechanical nature. The objective is to have a system automatically define its own buy and sell zones and thereby profitably trade in any market — bull or bear. Dynamic zones offer a solution to the problem of fixed buy and sell zones for any oscillator-driven system.
An indicator’s extreme levels can be quantified using statistical methods. These extreme levels are calculated for a certain period and serve as the buy and sell zones for a trading system. The repetition of this statistical process for every value of the indicator creates values that become the dynamic zones. The zones are calculated in such a way that the probability of the indicator value rising above, or falling below, the dynamic zones is equal to a given probability input set by the trader.
To better understand dynamic zones, let's first describe them mathematically and then explain their use. The dynamic zones definition:
Find V such that:
For dynamic zone buy: P{X <= V}=P1
For dynamic zone sell: P{X >= V}=P2
where P1 and P2 are the probabilities set by the trader, X is the value of the indicator for the selected period and V represents the value of the dynamic zone.
The probability input P1 and P2 can be adjusted by the trader to encompass as much or as little data as the trader would like. The smaller the probability, the fewer data values above and below the dynamic zones. This translates into a wider range between the buy and sell zones. If a 10% probability is used for P1 and P2, only those data values that make up the top 10% and bottom 10% for an indicator are used in the construction of the zones. Of the values, 80% will fall between the two extreme levels. Because dynamic zone levels are penetrated so infrequently, when this happens, traders know that the market has truly moved into overbought or oversold territory.
Calculating the Dynamic Zones
The algorithm for the dynamic zones is a series of steps. First, decide the value of the lookback period t. Next, decide the value of the probability Pbuy for buy zone and value of the probability Psell for the sell zone.
For i=1, to the last lookback period, build the distribution f(x) of the price during the lookback period i. Then find the value Vi1 such that the probability of the price less than or equal to Vi1 during the lookback period i is equal to Pbuy. Find the value Vi2 such that the probability of the price greater or equal to Vi2 during the lookback period i is equal to Psell. The sequence of Vi1 for all periods gives the buy zone. The sequence of Vi2 for all periods gives the sell zone.
In the algorithm description, we have: Build the distribution f(x) of the price during the lookback period i. The distribution here is empirical namely, how many times a given value of x appeared during the lookback period. The problem is to find such x that the probability of a price being greater or equal to x will be equal to a probability selected by the user. Probability is the area under the distribution curve. The task is to find such value of x that the area under the distribution curve to the right of x will be equal to the probability selected by the user. That x is the dynamic zone.
7 Types of RSI
See here to understand which RSI types are included:
Included:
Bar coloring
4 signal types
Alerts
Loxx's Expanded Source Types
Loxx's Variety RSI
Loxx's Dynamic Zones

[Old] TL with K/K and CustomizationThe old version of Trap Light before the most recent update. In order to facilitate the table functionality that is currently available for Trap Light, I had to make some values that are used in calculations hard-coded. By request, I'm quickly making this version available.
Trap Light
Description
Trap Light is an indicator that uses the K value of the Stochastic RSI to indicate potential long or short entries. It was designed to operate like a traffic stop light that is displayed near the current candle so that you don't have to look away from the candlesticks while trading.
Kriss/Kross is simply a cross over/under strategy that utilizes the 10 EMA and the 50 EMA .
Signals and Available Alerts:
1. Max Sell (Red Sell Label)
When K is equal to 100.00.
This is the strongest sell signal, remember that you only need to make sure that the trend is reversing before you make an entry, because several of these signals can appear in a row if a strong trend hasn't yet reversed.
2. Sell (Red Sell Label)
When K is equal to or greater than 99.50.
A sell signal.
3. Close to Sell (Red Down Arrow)
When K is equal to or greater than 95.00.
A sell signal may be produced soon.
4. Not Ready (Yellow Circle)
When K is less than 95 and greater than 5.00.
This indicates that neither a sell nor buy signal are close to being produced.
5. Close to Buy (Green Up Arrow)
When K is equal to or less than 5.00.
A buy signal may be produced soon.
6. Buy (Green Buy Label)
When K is equal to or less than 0.50 and greater than 0.00.
A buy signal.
7. Max Buy (Green Buy Label)
When K is equal to 0.00.
Strongest buy signal, remember to make sure that the trend is reversing before making an entry.
8. Kriss (Buy)
A buy signal when the 10 EMA (Blue) crosses above the 50 EMA (Yellow). This is also illustrated by the triggering candle being colored blue.
9. Kross (Sell)
A sell signal when the 10 EMA (Blue) crosses below the 50 EMA (Yellow). This is also illustrated by the triggering candle being colored yellow.
Customization of many different options is available, and the code is open-source for your reference, etc.
Remember to do you own due diligence and feel free to leave a comment with questions, etc.

[blackcat] L1 Vitali Apirine HHs & LLs StochasticsLevel 1
Background
This indicator was originally formulated by Vitali Apirine for TASC - February 2016 Traders Tips.
Function
According to Vitali Apirine, his momentum indicator–based system HHLLS (higher high lower low stochastic) can help to spot emerging trends, define correction periods, and anticipate reversals. As with many indicators, HHLLS signals can also be generated by looking for divergences and crossovers. Because the HHLLS is an oscillator, it can also be used to identify overbought & oversold levels.
Remarks
I changed EMA or SMA into hanning windowing function to reduce lag issue.
colorful area is bearish power.
colorful solid thick line is bull power.
Feedbacks are appreciated.

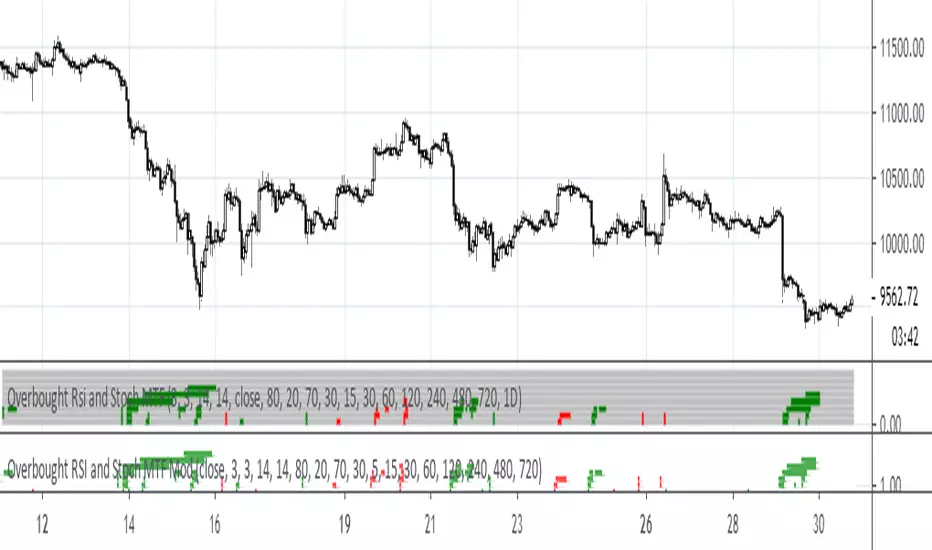
Multi-TimeFrame SignalsI trade binary options on reversals. I use this as a confluence to prove that my analysis is correct. I use this on smaller time frames given the type of trading I do.
I do not use this as an entry trigger, so you should not blindly enter trades based on this solely . You were warned
This indicator (on default settings) will let you know when the 1 minute, 3 minute, and 5 minute timeframes RSI & Stochastics are all in an overbought or oversold state. It shows this by changing the background color on your chart to red (overbought) or green (oversold).
All of these settings are changeable. #winning
I left this as open-source as I figured out how to code this by using other open-source scripts as reference. I am a programmer that uses other languages.
I only published this script as a request from a close friend.

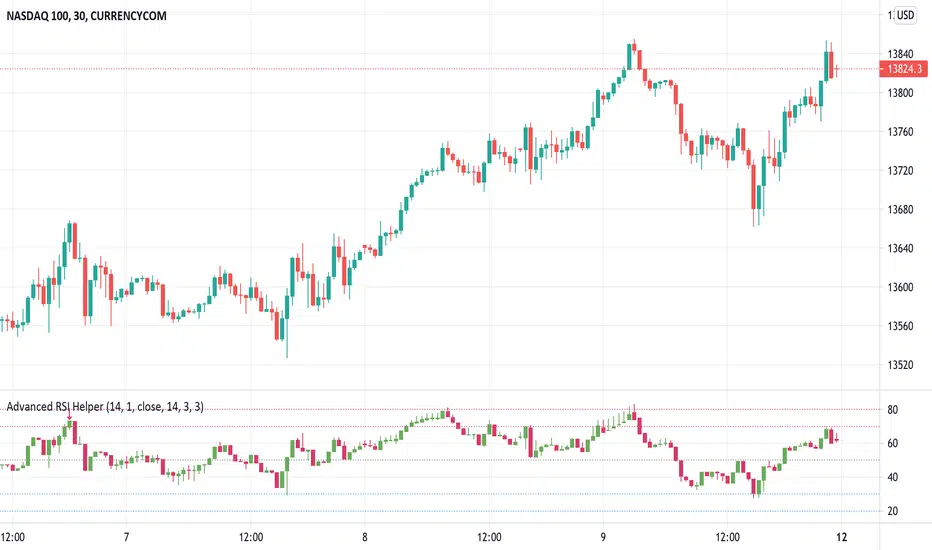
Advanced RSI HelperHere is Advanced RSI Helper. An advanced RSI represented in a candle type chart. It contains a Stochastic and a Pivot Detector (High-Low) and RSI divergences.
It also contains a Filter which you can configure the upper, lower zone to colorize the bars on the chart only when you are overbought or oversold, when you are in range the bars appear "transparent".
You also have the option of placing alerts for divergences or when the rsi exceeds the upper zone 1 / 2 or lower zone 1 / 2.
if you encounter any bugs do not hesitate to let me know in the comment area. The same goes for your suggestions.
Cheers and remember, risk management is the most important!
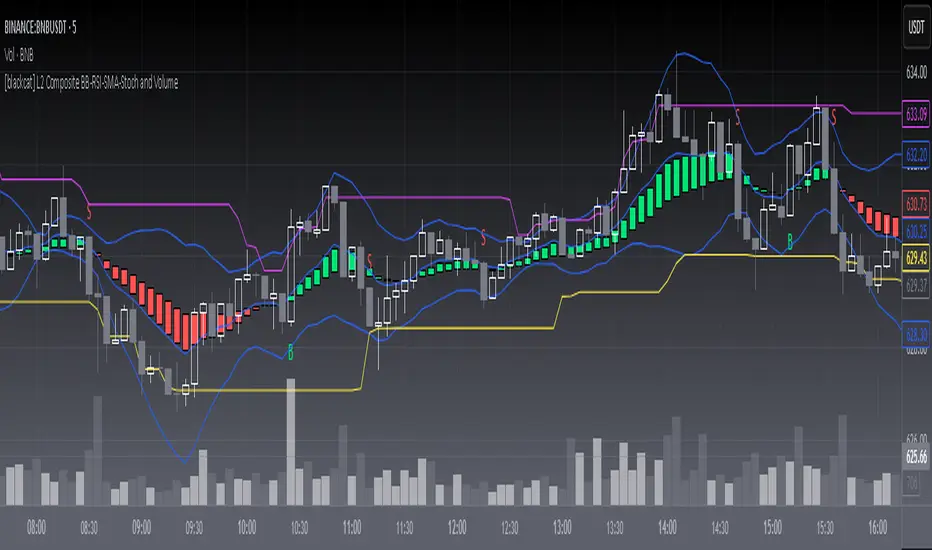
L2 Composite BB-RSI-SMA-Stoch and VolumeLevel: 2
Background
Commonly we cannot use signal indicator to disclose the nature of market. By using multiple indicator resonance, the confidence level of trading is increased. The selection of proper ingredients is important to guarantee a good results.
Function
L2 Composite BB-RSI-SMA-Stoch and Volume script likes a Pizza that you can put your favorite ingredients and condiments. In my menu, there are basic indicators as below:
Bollinger bands are envelopes with a standard deviation above and below a simple moving average of price. Since the spacing of the bands is based on the standard deviation, they adjust to the fluctuations in volatility in the underlying price.
The Relative Strength Index (RSI) developed by J. Welles Wilder is a pulse oscillator that measures the speed and change of price movements. The RSI hovers between zero and 100.
A simple moving average (SMA) is an arithmetic moving average that is calculated by adding up current prices and then dividing by the number of time periods in the calculation average.
A stochastic oscillator is a momentum indicator that compares a certain closing price of a security with a range of its prices over a certain period of time. The sensitivity to market movements can be reduced by adjusting this time period or by taking a moving average of the result.
Volume meters are the ones that make up the volume, usually an underestimated indicator.
Key Signal
Composite signal is simple and difficult to describe the overall function. By simple logic "and", "or", you can filter out the noise and disclose the real market trend.
Pros and Cons
Pros:
1. Higher confidence level for trading due to indicator resonance effect.
2. Incl. long, short, and close, three types of signal.
3. Easy to migrate and adapt to various markets.
Cons:
1. Highly emphasized on long signal, for short signal is a little bit weak.
2. Only use for trading pairs with volume information. Indice is not applicable.
3. Although I tried to use a set of "Golden Parameters", it still need to be tuned along different markets, time frame upon situations.
4. It is complex if you are wondering to introduce new indicator together with them. A lot of efforts may be needed.
Remarks
The opinions of most people in the market may not be correct, but the opinions of most indicators are closer to correct.
Readme
In real life, I am a prolific inventor. I have successfully applied for more than 60 international and regional patents in the past 12 years. But in the past two years or so, I have tried to transfer my creativity to the development of trading strategies. Tradingview is the ideal platform for me. I am selecting and contributing some of the hundreds of scripts to publish in Tradingview community. Welcome everyone to interact with me to discuss these interesting pine scripts.
The scripts posted are categorized into 5 levels according to my efforts or manhours put into these works.
Level 1 : interesting script snippets or distinctive improvement from classic indicators or strategy. Level 1 scripts can usually appear in more complex indicators as a function module or element.
Level 2 : composite indicator/strategy. By selecting or combining several independent or dependent functions or sub indicators in proper way, the composite script exhibits a resonance phenomenon which can filter out noise or fake trading signal to enhance trading confidence level.
Level 3 : comprehensive indicator/strategy. They are simple trading systems based on my strategies. They are commonly containing several or all of entry signal, close signal, stop loss, take profit, re-entry, risk management, and position sizing techniques. Even some interesting fundamental and mass psychological aspects are incorporated.
Level 4 : script snippets or functions that do not disclose source code. Interesting element that can reveal market laws and work as raw material for indicators and strategies. If you find Level 1~2 scripts are helpful, Level 4 is a private version that took me far more efforts to develop.
Level 5 : indicator/strategy that do not disclose source code. private version of Level 3 script with my accumulated script processing skills or a large number of custom functions. I had a private function library built in past two years. Level 5 scripts use many of them to achieve private trading strategy.
CASH TRAP OSILADORESFor Best Results, Collect Minimum of 4 Confirmations. When the Relative Strength Index is above the top line, look for sales. If it is below the bottom line, Find purchases.
If the Stochastic Oscillator is above the upper line, look for sales, If it is below the bottom line, look for purchases. (also applying price action and looking for bounce points)
PARAMETERS
RSI= 4 (70,30)
STOCH= 5/1/1 (80,20)

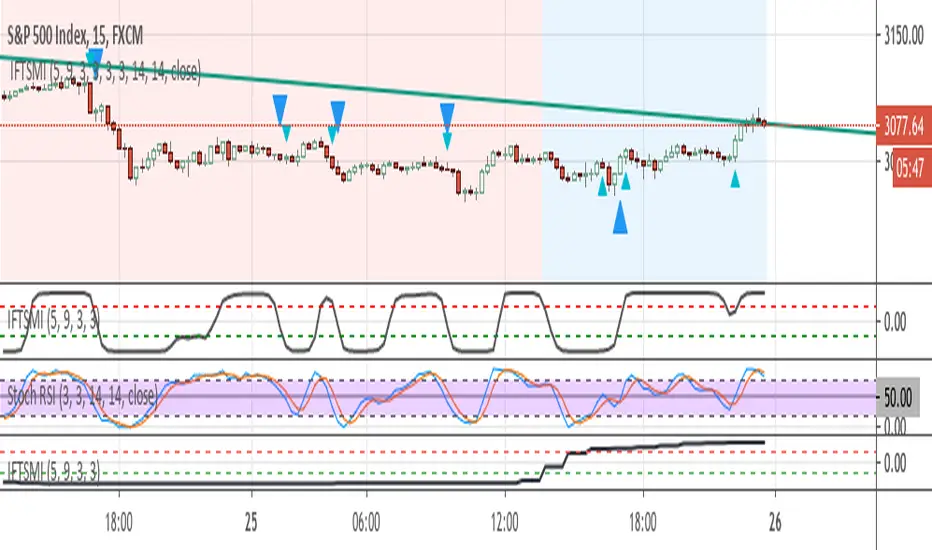
Inverse Fisher Transform of SMI and sto. RSI, MTF confirmedThe system uses 1 hour and 15 min timeframe data. Signals coming from 15 min Inverse Fisher Transform of SMI and stochastic RSI are confirmed by 1 hour Inverse Fisher Transform SMI, according to the following rules:
long cond.: 15 min IFTSMI crosses ABOVE -0.5 or SRSI k-line crosses ABOVE 50 while 1-hour IFTSMI is already ABOVE -0.5
short cond.:15 min IFTSMI crosses BELOW 0.5 or SRSI k-line crosses BELOW 50 while 1-hour IFTSMI is already BELOW 0.5
SMI and Inverse Fisher Transform of SMI codes belong to @kivancozbilgic.
AKMY Multiple StochasticsRefer Sample Chart for description - updated to version 4 and additional script suited with Author's trading setting which original script was inspired from script developed by Manu76

Scoring Development Sample [BigBitsIO]This script shows a sample of how to do confidence weighted scoring indicators and for loops with Pine. This indicator may or may not be found useful, it's intent is to provide a sample on how to create such an indicator and use certain Pine features.
Features:
- Defined points based on the confidence of RSI and Stochastic indicator
- Defined points based on candle color and sma trend direction
- For loops used to calculate bonus points for "extended periods" of confidence.
*** DISCLAIMER: For educational and entertainment purposes only. Nothing in this content should be interpreted as financial advice or a recommendation to buy or sell any sort of security or investment including all types of crypto. DYOR, TYOB. ***

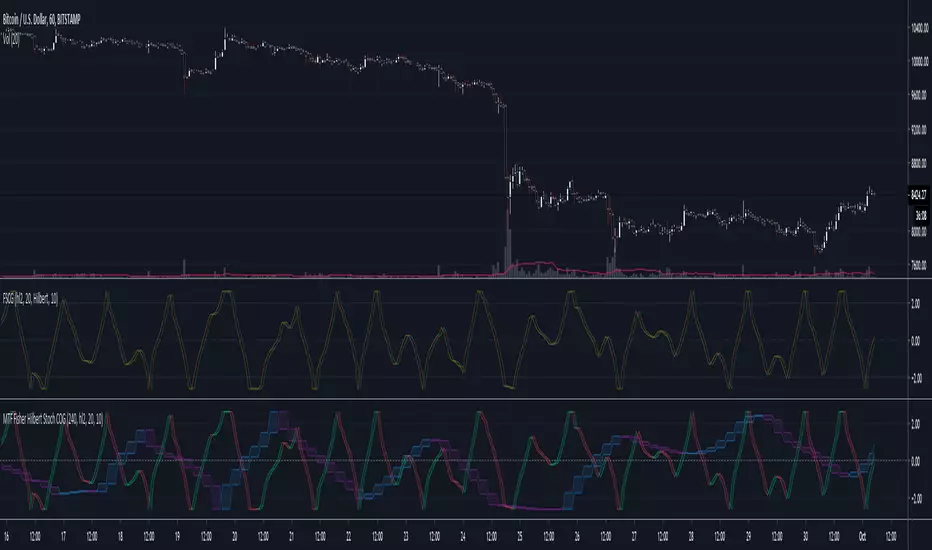
MTF Fisher Hilbert Stoch COGMTF version of dasanc's "Fisher Stochastic Center of Gravity". Only contains the Hilbert variant from the script.
You can find his original script here : link
RSI + StochasticsSuper basic concept.
Take profit when both rsi and stochastic are overbought and vice versa.
Overbought and oversold are not necessarily indications that a market will reverse contrary to what some people teach. Markets can stay overbought much longer than oversold and therefore I find more value from the oversold signals(red signals).
Occasionally these signals will catch the exact top/ bottom but it would be risky to take a trade based on these signals alone. You can see these signals as take profit signals or even signs of a possible reversal.
Given the nature of these two indicators it will not perform well in a strong trend, so always use with confluence. Personally I would only use the oversold signals but I left it in case anybody finds it useful.

Overbought RSI and Stoch MODThis is a modification of the script by Elgrand (). Using plotshape statement appears to produce a more precise outcome.
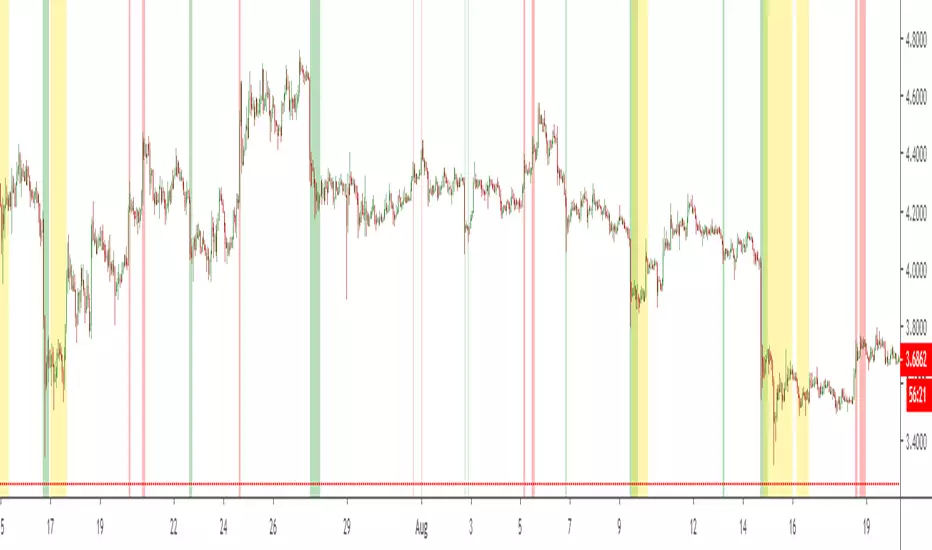
Elgrand - Overbought/sold Rsi + Stochastic zonesVisualize on your chart when price in an oversold or overbought zone. A combination of Rsi and Stochasticrsi is used for higher probability. Wait for an zone to be displayed and then wait for price to exit a zone. Once this happens check candlestick patterns and support/resistance "lines" to find appropiate stoplosses for you entry or exit

Zero Cross Buy/SellThis is an oscillator.
Buy on zero cross from below.
Sell on zero cross from above.
It prevents risky buys when price is too high and too low. It is capable of recognizing long bear runs to prevent you prom buying
Best used with Bollinger Bands.
Based on RSI and Stochastic RSI

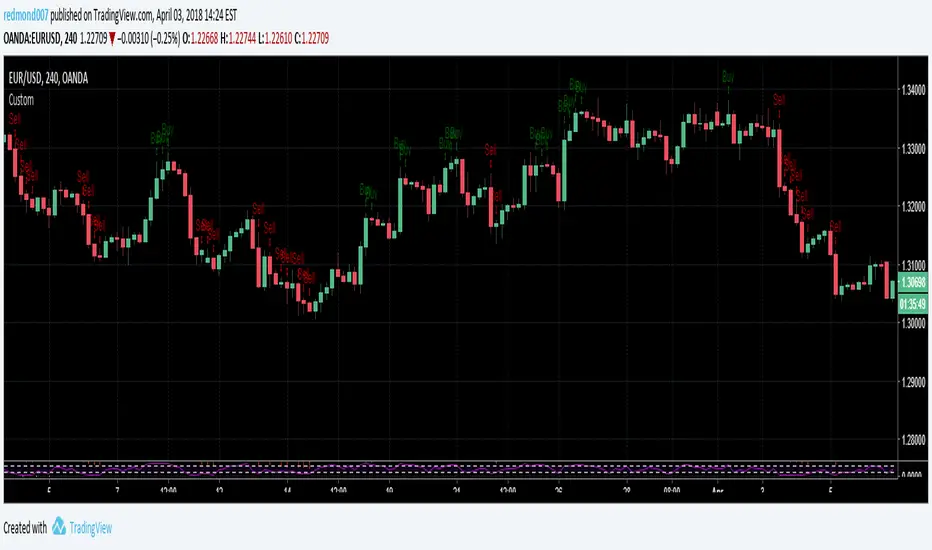
RSI MACD EMA Stoch Custom IndicatorCopyright by RJ 3/2018
Buy when:
RSI period 3 greater than 50, Difference between MACD and MACD signal line is greater than 0 and also greater than that of previous candle,
Stochastic %D line is less than 80 and greater than that of previous candle, Closing price greater than EMA period 100.
Sell when:
RSI period 3 less than 50, Difference between MACD and MACD signal line is less than 0 and also less than that of
previous candle, Stochastic %D line is greater than 20 and less than that of previous candle, Closing price less than EMA
period 100.
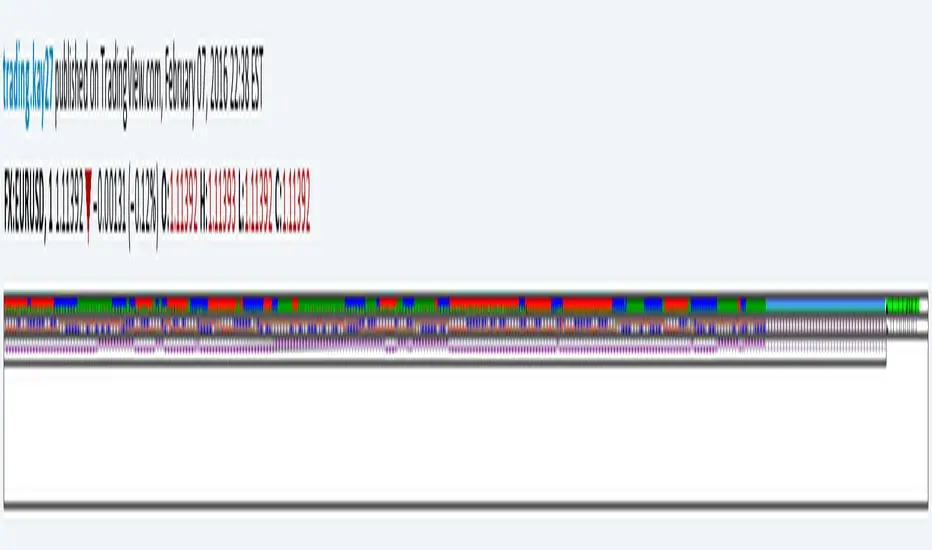
Kay_StochasticRSIThis is a different version of Stochastic RSI. the only difference is the use of variable moving average by Lazybear instead of regular sma for K smoothing.
Its purely an experiment. I am not a professional trader but an enthusiastic programmer trying different indicator combination to see different results.
Criticizing and negative comments will be gracefully accepted. :)
Appreciation will be even more. :)
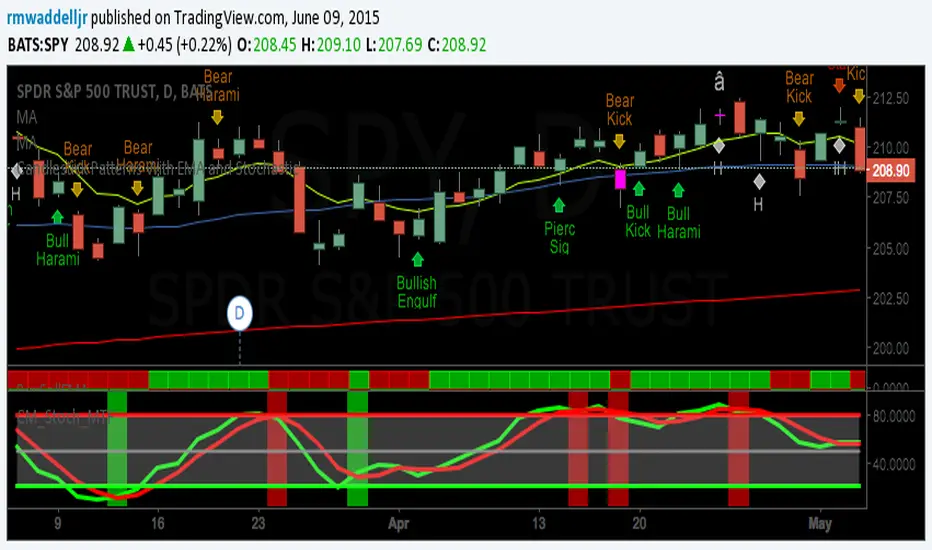
Candlestick Patterns With EMA and StochasticCandlestick patterns identified and color coded according to position above or below 8EMA(TLine).
Special thanks to repo32, DavidR, and Chris Moody for coding ideas.
Bullish candlestick buy signals have a greater probability of success when Stochastics are oversold. Bearish ones have a
greater probability of success when overbought. Stack as many factors in your favor as possible. A candlestick signal by itself is of little value unless you apply additional information with it. Regardless of systems and strategies used, make your second trade first: Know when you're going to exit. Risk management rules. Good luck and good trading.
Multi-Timeframe Stochastic (4x Konfiguracja + Schodki)Skrypt stoch z wielu TF można sobie ustawiać pod siebie.

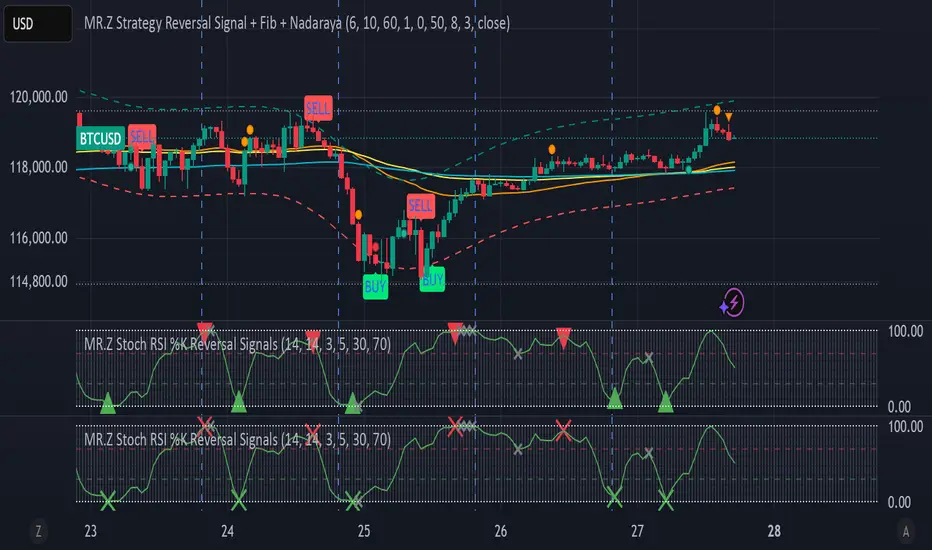
MR.Z Stoch RSI %K Reversal Signals🟢 K Strategy Description
The K Strategy is a momentum-based trading technique using the %K line from the Stochastic Oscillator. It is designed to detect potential reversal points in price trends by identifying extreme conditions of overbought and oversold levels.
✅ Core Logic:
The strategy monitors the %K line (a smoothed form of RSI momentum).
A Buy Signal is triggered when:
The %K line dips to or below a defined lower threshold (commonly 30 or less).
This suggests the asset is oversold and may soon reverse upward.
A Sell Signal is triggered when:
The %K line peaks above an upper threshold (commonly 70 or more).
This suggests the asset is overbought and may reverse downward.
⚙️ Adjustable Parameters:
K Length: The sensitivity of the %K calculation (affects how fast it responds).
Buy Level: Set your oversold trigger (e.g., 20–40).
Sell Level: Set your overbought trigger (e.g., 60–100).
Signal Smoothing (optional): Helps reduce noise and avoid false triggers.
📈 Use Case:
This strategy is effective in ranging markets where prices frequently oscillate. It can also be used with other indicators (like EMA, volume filters, or price action confirmation) to increase accuracy in trending conditions.
Price and Volume Stochastic Divergence [MW]Introduction
This indicator creates signals of interest for entering and exiting long and short positions on equities. It primarily uses up and down trends defined by the change in cumulative volume with some filtering provided by a short period exponential moving average (9 EMA by default).
Settings
Moving Average Period : The moving average over which the cumulative volume delta is calculated. Default: 14
Short Period EMA : The EMA used to represent price action, and is used to generate the EMA Delta line. Default: 27 (3*3*3)
Long Period EMA : The second EMA used to calculate the EMA Delta line. Default: 108 (2*2*3*3*3)
Stochastic K Value : The value used for stochastic curve smoothing. Default: 3
Dot Size : The diameter of the larger indicator. Default: 10
Dot Transparency : The transparency level of the outer ring of the primary BUY/SELL signal. Default: 50 (0 is opaque, 100 is transparent)
Band Distance from 0 to 100 : The upper and lower band distance. Default: 20
Calculations
The cumulative volume delta (CVD) is calculated using candle bodies and wicks. For a red candle, buying volume is calculated by multiplying the volume by the spread percentage of the average of the top and bottom wicks, while Selling Volume is calculated multiplying the volume by the spread percentage of the average of the top and bottom wicks - in addition to the spread percentage of the candle body.
For a green candle, buying volume is calculated by multiplying the volume by the spread percentage of the average of the top and bottom wicks - plus the spread percentage of the candle body - while Selling Volume is calculated using only the spread percentage average of the top and bottom wicks.
Once we have the CVD, we can then perform a stochastic calculation of the CVD value.
stochastic calculation = (current value - lowest value in period) / (highest value in period - lowest value in period)
We’ll do the same stochastic calculation for the short term EMA (27 EMA default) as well as for the difference between the short term and long term EMA.
When the stochastic CVD value is rising from zero and the short term EMA stochastic value equals 100, then it’s a major bullish signal. When the stochastic CVD value is falling from 100 and the short term EMA stochastic value equals 0, then it’s a major bearish signal.
Sometimes, after a bullish or bearish signal, the stochastic CVD will reverse direction triggering a new opposing signal.
How to Interpret
The CVD indicates when there is either more buying than selling or vice versa. A value over 50 for the stochastic CVD curve represents more buying taking place. A value below 50 represents more selling. One might intuitively believe that when there is more buying volume than selling volume that the price would follow suit. This is not always the case.
Most of the time buying volume will precede consistent price movement upwards, and selling volume will precede consistent price movement downwards. When this divergence occurs, the indicator generates a signal. When this divergence begins to fail, and buying or selling volume reverses, then another signal is generated indicating that the buying/selling impulse is headed back into the direction of price action.
These interactions are visually represented on the chart with the coral line that represents CVD, and the yellow line that represents the EMA, or the average price. When the coral line goes up and the yellow line stays down, that’s the BUY signal. When the coral line goes down and the yellow line stays up, that’s the sell signal. When the coral line switches direction, the chart generates another signal showing that volume is moving in a direction that supports the price.
The orange line represents the stochastic representation of the difference between the short EMA (27 by default) and the long EMA (108 by default). EMA differences is a method that can be used to define a trend. When a short term EMA is above a longer term EMA, that may represent a bullish trend. When it is below, that may represent a bearish trend. When all 3 lines are rising or falling in the same direction at the same time, it tends to indicate a movement that has the potential to continue.
Other Usage Notes and Limitations
It's important for traders to be aware of the limitations of any indicator and to use them as part of a broader, well-rounded trading strategy that includes risk management, fundamental analysis, and other tools that can help with reducing false signals, determining trend direction, and providing additional confirmation for a trade decision. Diversifying strategies and not relying solely on one type of indicator or analysis can help mitigate some of these risks.
This indicator can be paired with the MW Volume Impulse indicator if it is desired to see the actual buying and selling cumulative volume deltas. Also, in many cases, the BUY and SELL signals tend to correspond with Keltner Bands (ATR Bands) becoming extended. Lastly, volume weighted average price (VWAP) along with other macro events can impact price and negate signals. To view VWAP lines, you may choose to use the Multi VWAP or Multi VWAP for Gaps indicator to help ensure that the signals you see in this indicator are not being affected by VWAP lines.
