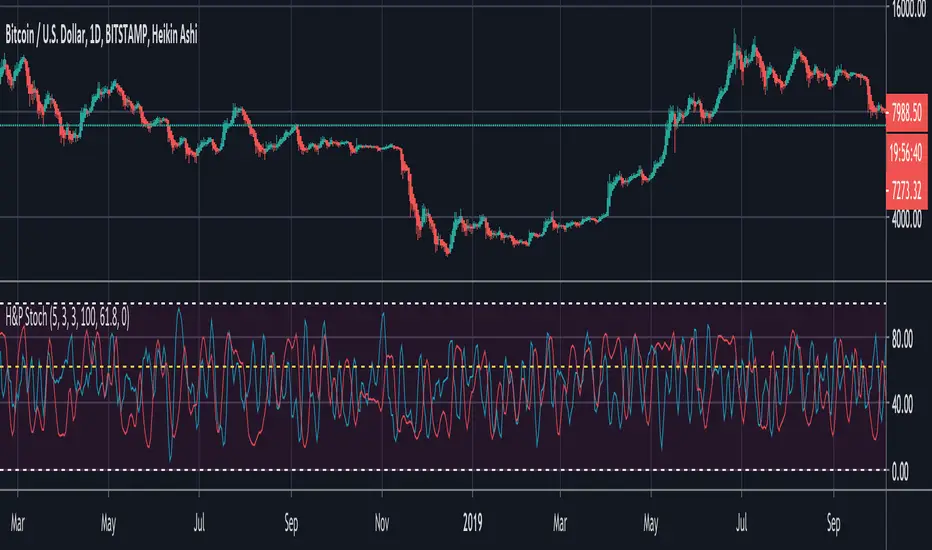
BTC Hash Rate & Price Stochastic IndiciatorFresh off the press, we have a new breed of indicators: Bitcoin's Hash Rate & Price.
As many of you have read, roughly 80% of BTC's price movements can be correlated to its changes in hash rate volume. I decided to make a stochastic indicator that utilizes this principle to track divergence of the price from the hash rate.
Let's break this down...
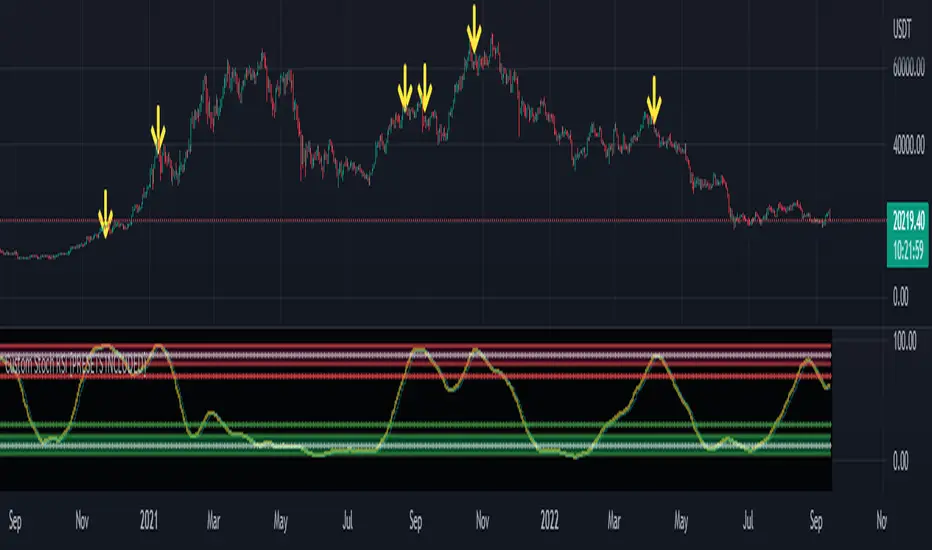
In red is the CLOSE of BTC's Price, which is then smoothed by a SMA, and smoothed again by a WMA.
In aqua is a STOCH of BTC's Hash Rate, which is then smoothed by a SMA, and smoothed again by a WMA.
The reason why I chose to use the CLOSE of the Price versus a STOCH as I did with the Hash Rate, is because the price tends to signal trends via divergence from the Hash Rate, and eventually converge with the Hash Rate at some point.
You will notice that anytime there is a significant divergence of the RED from the AQUA, a trend is closely aligned with it. This indicator does a remarkable job of indicating the beginnings and ends of both bullish and bearish price movements.
Example Strategy:
Enter long when RED (price) crosses over AQUA (hash rate), and close long when RED crosses under AQUA.
The inverse can be done for shorts, just RED diverges downwards from AQUA versus upwards.
Note:
Unlike a normal Stochastic Indicator, the upper and lower bounds do not appear to hold any significance. In other words, the lines do not seem to reverse at 20/80. As a result, I just set them to 0/100 for aesthetics.
DO NOT make trades based off of small divergences, or simply enter into positions based off the price divergences. Though this indicator times the start/end of movements very accurately, it also comes riddled with false breakouts .
Proceed at your own pace, and please, toy around with the inputs values. I experimented with a few combinations, but I'm sure there are better value combinations that yield sharper results with fewer false signals.
EASTER EGG:
Notice the "Golden Line"? Any avid user of TV knows that Fibonacci ratios show up everywhere in markets. With that said, I plotted a horizontal line at 0.618, which is 1/Phi, an important level in Fibonacci retracements.
Final Comments:
First, this is not investment, merely my experimentation and observation of happenings in the analytical world.
Second, please comment questions, improvements, etc. Dialogue opens up room for exploration!
Поиск скриптов по запросу "stoch"
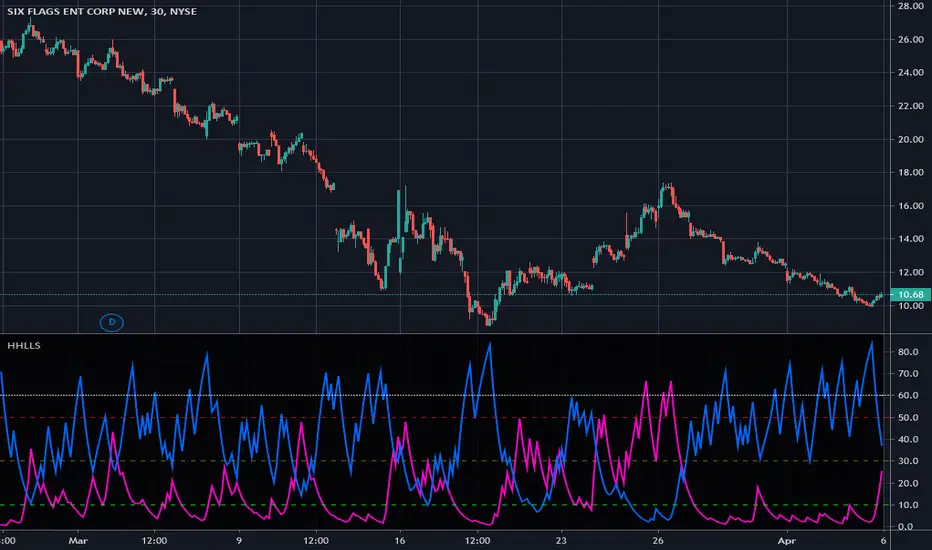
Higher Highs & Lower Lows Stochastics - Vitali ApirineThis is my modified "Higher Highs & Lower Lows Stochastics" employing PSv4.0, originally formulated by Vitali Apirine for TASC - February 2016 Traders Tips. Reading through a TASC magazine of mine, behold, I found a little known indicator that I can't find anywhere on all of Tradingview. That was a tragedy I felt I had to resolve... This indicator is best described as a dual momentum indicator, being helpful with anticipating reversals, spotting emerging trends, and defining correction periods. I felt it worthy of justice to unveil this for all TV members to utilize and also learn from. It's uniqueness is beyond past due for the honor it deserves on Tradingview.
As always, I have included advanced Pine programming techniques that conform to proper "Pine Etiquette". For those of you who are newcomers to Pine Script, this code release may also help you comprehend the "Power of Pine" by employing advanced programming techniques while exhibiting code utilization in a most effective manner. This script's uniqueness displays that we can now override built-in Pine functions. Firstly, you may have noticed that I replaced ema(), sma(), highest(), and lowest(). If you weren't aware of this Pine capability, well, here is a prime example... Now you know! Just heed caution when doing so to ensure your replacement algorithms are 100% sound. Lastly, I also added an additional "Median" line where the companion stochastics seemingly appear to gravitate within a central zone.
NOTICE: You may have observed, there is highest(), lowest(), ema(), and sma() custom functions overwriting Pine built-ins, some of which are audaciously used in ternary. "IF" you are planning to use Pine Script v4.0 functions in ternary, be forewarned, they WILL NOT operate as expected in most scenarios. The reason why I legitimately used them here in ternary is because they are ONLY manually controlled by an input(). If these were dynamically controlled with bar-to-bar dynamic conditional logic, you would most certainly run into serious unexpected programming issues, potentially resulting in hours of frustrations and guaranteed loss of hair. That's my lesson for this release, so never ever forget this when utilizing the full potential of the "Power of Pine". For more information concerning these potential dilemmas, please consult "Execution of Pine functions and historical context inside function blocks" in the "Pine Script v4 User Manual".
Features List Includes:
Dark Background - Easily disabled in indicator Settings->Style for "Light" charts or with Pine commenting
AND much, much more... You have the source!
The comments section below is solely just for commenting and other remarks, ideas, compliments, etc... regarding only this indicator, not others. When available time provides itself, I will consider your inquiries, thoughts, and concepts presented below in the comments section, should you have any questions or comments regarding this indicator. When my indicators achieve more prevalent use by TV members, I may implement more ideas when they present themselves as worthy additions. As always, "Like" it if you simply just like it with a proper thumbs up, and also return to my scripts list occasionally for additional postings. Have a profitable future everyone!
DiNapoli Preferred Stochastic Oscillator [ChuckBanger]In the late 1950s, George Lane developed stochastics, an indicator that measures the relationship between an issue's closing price and its price range over a predetermined period of time. This is Joe DiNapoli version of stochastic oscillator. Use it as you wold use a regular stochastic indicator.
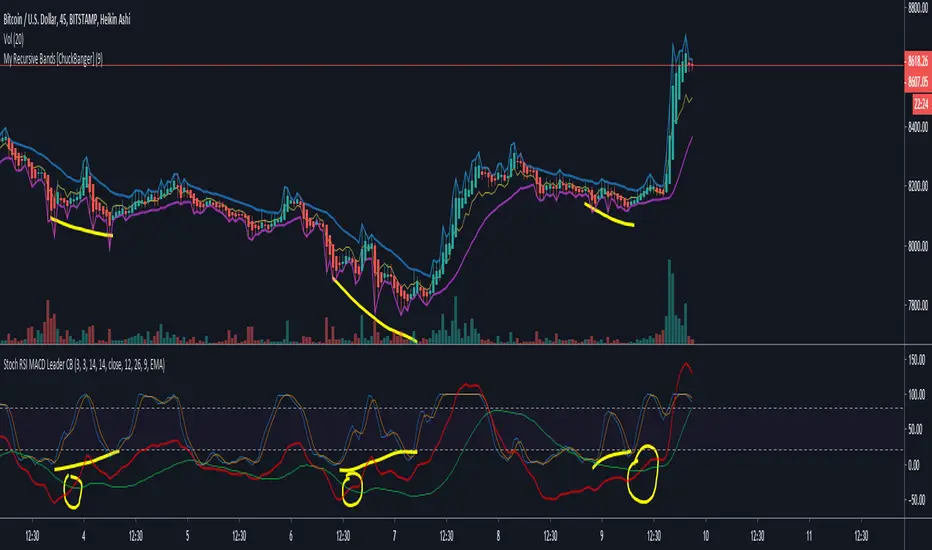
Stochastic RSI and MACD leader [ChuckBanger]Here I have combined Stochastic RSI with my MACD leader.
MACD leader and Stochastic RSI works well together and they are powerful in combination with My Recursive Bands. It is up to you to back test this properly before you use it in real life trades. But in my opinion it is very powerful.
Because of MACD nature it's a little messy when you turn on the MACD's histogram so I commented that out.
MACD Leader:
My Recursive Bands:
Bilateral Stochastic RSI/MFI [AL] @Version=3 Hi, this is a Stochastic RSI/MFI converted from Alex Grover's (www.tradingview.com) idea for the Stochastic calculation.
It also includes the cycle calculation and filtering form Anooj Patel
And the Divergence plots from Just UncleL www.tradingview.com
There are probably a few i have forgotten but thanks to all of the community who share and help us all learn!!

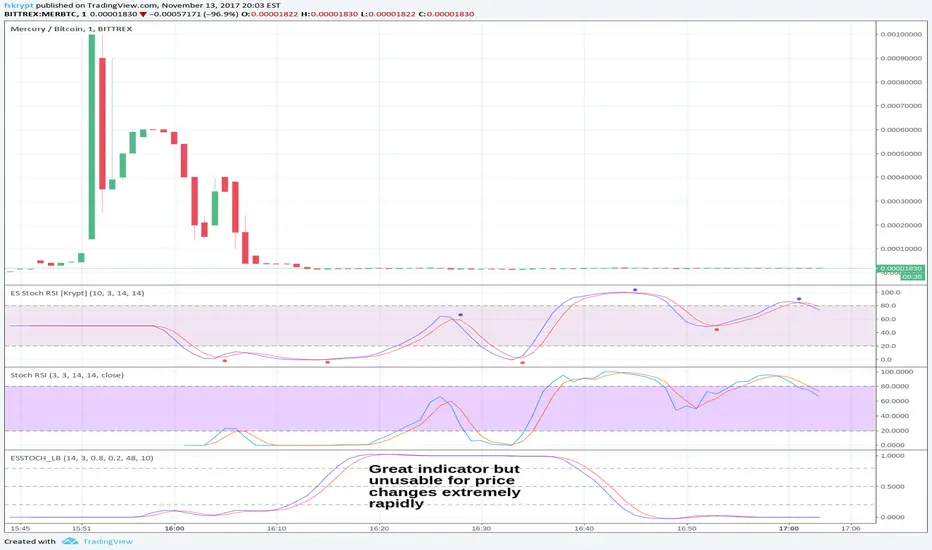
Ehlers-Smoothed Stochastic RSI [Krypt]This script uses a regular Stochastic RSI formula and then runs Ehlers' Super Smoother on top of it. It also provides buy/sell signals on crossovers.
The script is inspired by LazyBear Ehlers-Smoothed Stochastic RSI with Roofing Filter, except I find that the Roofing filter (existing implementation) does not work well near extreme price changes, where a regular formula is preferable. The Ehlers Super Smoother however is excellent and seems to provide earlier signals in most cases than an EMA-EMA smoother. Combined, the super-smoother and regular Stochastic RSI formula provide very good results.
Volume Weighted Stochastic RSIThis indicator calculates the Stochastic RSI, enhanced with optional Volume Weighting (VWStochRSI). It measures the level of a (Volume-Weighted) RSI relative to its high-low range over a set period, providing a sensitive momentum oscillator.
Key Features:
Volume-Weighted Core: The indicator is built on a Relative Strength Index (RSI) that can be optionally volume-weighted (Volume weighted).
Customizable Smoothing: The %K and %D lines are smoothed using a customizable moving average. The MA type (Smooth Method) can be selected (e.g., EMA, SMA, WMA) and will also be volume-weighted if the main Volume weighted option is enabled.
Full Divergence Suite (Class A, B, C): The primary feature is the integrated divergence engine. It automatically detects and plots all three major types of divergences:
Regular (A): Signals potential trend reversals.
Hidden (B): Signals potential trend continuations.
Exaggerated (C): Signals weakness at double tops/bottoms.
Divergence Filtering and Visualization:
Price Tolerance Filter: Divergence detection is enhanced with a percentage-based price tolerance (pivPrcTol) to filter out insignificant market noise.
Persistent Visualization: Divergence markers are plotted for the entire duration of the signal and are visually anchored to the %K line level of the confirming pivot.
Note on Confirmation (Lag): Divergence signals rely on a pivot confirmation method to ensure they do not repaint.
The Start of a- divergence is only detected after the confirming pivot is fully formed (a delay based on Pivot Right Bars).
The End of a divergence is detected either instantly (if the signal is invalidated by price action) or with a delay (when a new, non-divergent pivot is confirmed).
Multi-Timeframe (MTF) Capability:
MTF VWStochRSI Lines: The %K and %D lines can be calculated on a higher timeframe, with standard options to handle gaps (Fill Gaps) and prevent repainting (Wait for...).
Limitation: The Divergence detection engine (pivDiv) is disabled if a timeframe other than the chart's timeframe is selected. Divergences are only calculated on the active chart timeframe.
Integrated Alerts: Includes 20 comprehensive alerts for:
The start and end of all 6 divergence types.
The %K line crossing the %D line.
The %K line crossing the Overbought, Oversold, or 50-level lines.
DISCLAIMER
For Informational/Educational Use Only: This indicator is provided for informational and educational purposes only. It does not constitute financial, investment, or trading advice, nor is it a recommendation to buy or sell any asset.
Use at Your Own Risk: All trading decisions you make based on the information or signals generated by this indicator are made solely at your own risk.
No Guarantee of Performance: Past performance is not an indicator of future results. The author makes no guarantee regarding the accuracy of the signals or future profitability.
No Liability: The author shall not be held liable for any financial losses or damages incurred directly or indirectly from the use of this indicator.
Signals Are Not Recommendations: The alerts and visual signals (e.g., crossovers) generated by this tool are not direct recommendations to buy or sell. They are technical observations for your own analysis and consideration.

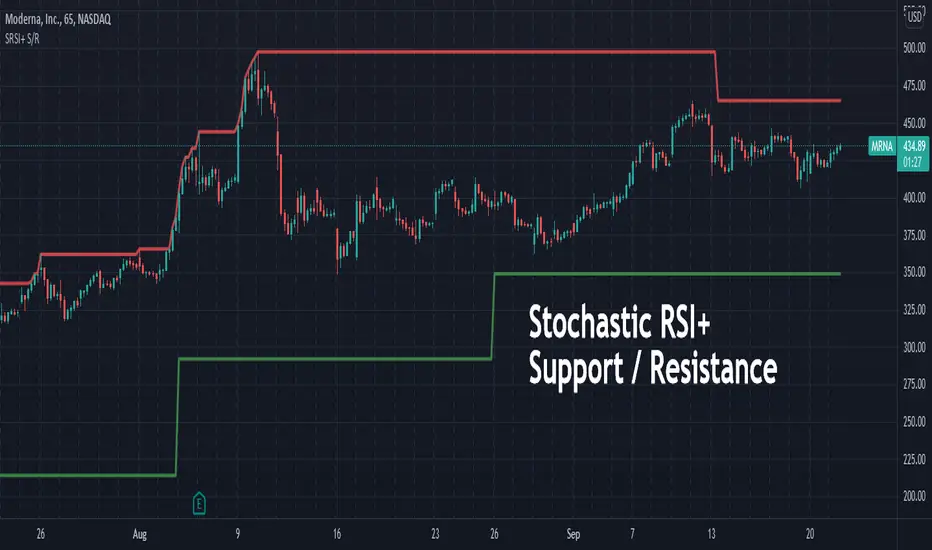
Stochastic RSI+ Support/Resistance (beta)This indicator uses Stochastic RSI+ as a means to determine overbought and oversold conditions which subsequently define recent support and resistance levels.
Three EMA and Stochastic RSI Signals with TP and SL AlertsThis is kind of similar to one of my other scripts but I figured people might be looking for this one in a simple wrapped up package. It takes 3 EMAs, a 50, 14 and an 8 and the trade signals come from crossovers of the Stochastic RSI lines and conditions that marry up with the EMAs lining up in an uptrend or downtrend condition. I used the TP and SL lines from one of my other scripts so you can see where the winners and losers are. Includes alerts so they can be used with webhooks to automate however you wish. I have added signal confirmation with Weiss Wave Volume on side with trend. Stop and TP Levels are configurable in the settings as well as the periods for the ATR used in these calculations.

Stochastic RSI+Applies signal values to significant changes in momentum and can be used in conjunction with other indicators and analysis to improve trade timing.
Both "Signal Up" and "Signal Down" can be used for alerts.
The magnitude of the signal is the difference between K and D.
(See the code for the logic and implementation.)
Signal Up occurs when momentum is within the band and moving upward.
Signal Down occurs when momentum is within the band and moving downward.
Interpretation Note:
The Stochastic RSI is known for false signals, so it should never be used as a pure buy or sell signal. It is useful as a warning or to help with trade timing.
A good example of this is: If you are bullish on a stock, and the signal is negative (signal down), then it may be wise to not buy until the recent change in momentum has dissipated.

Open Interest Stochastic Money Flow IndexThis is the improved version of Stochastic Money Flow Index script that uses Open Interest instead of volume in Future markets.
I think it will make a difference especially in Future and CFD markets.
Since the system will pull data from Quandl, CFTC reports may cause repaint when disclosed.
So if you use it during the weekly time frame (1W), it will definitely not repaint.
You can also use the volume by selecting "Others" from the menu.This option applies to each instrument, you can use it on any financial instrument with or without COT data.
Bitcoin is included in the "Futures" option.
In Futures, you can observe the difference of Open Interest's success by comparing, since it counts exchanges between the two parties singularly, it reacts more firmly to speculative movements.
This script also includes alerts and bar color options, you can use from the menu.
It is also suitable for mutable variables.This script was freed from the integer loads.You can modify it in any adaptive or fractional period.
I hope it will help your analyzes, regards .

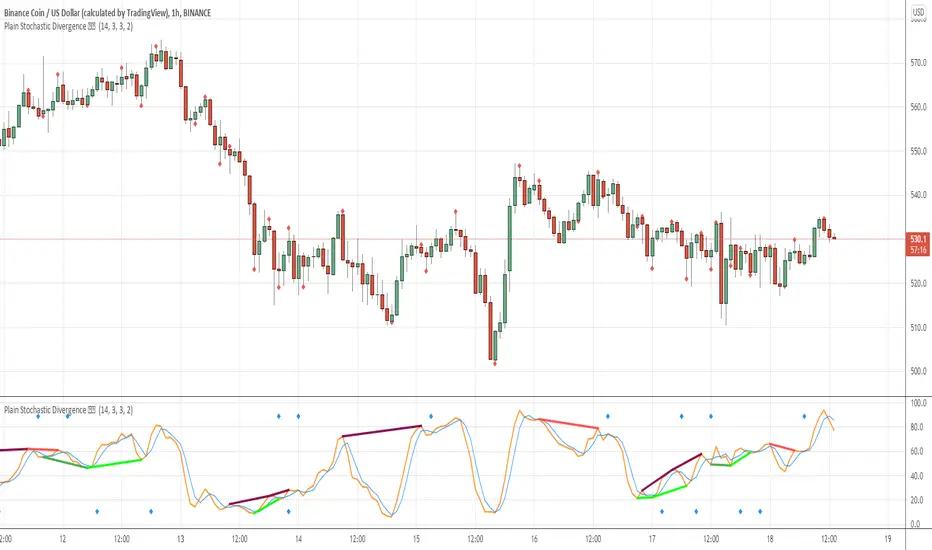
Plain Stochastic Divergence Stochastic Divergence
Plain simple way of calculating divergences
We all have times when we want to see just the divergences and nothning else
This script is minimalised to visualize that
references :
// stochastic // divergence // stoch //
3x Stoch on Given Time-frame v0.13x stochastic oscillators (K only), set the timeframe you want the stoch to be based off.
Smooth and length is hard-coded to give easy view of the time-frame set in the indicator arguments shown on-chart. Edit these in the Pine Editor as needed.
smooth = 6
length1 = 5
length2 = 8
length3 = 14

Stochastic RSI with DivergencesTook my other Log RSI script and plugged in Stochastic RSI to see how divergences play on an oscillator with two lines. Turns out divergences are good at predicting changes in the oscillator but that doesn't mean that the oscillator will always mimic price action.
Log vs. no log is virtually the same.
Credits to
@fskrypt for introducing geometric mean
Divergences by @RicardoSantos (@JustUncleL's edit)


Log-space Stochastic RSISimilar to regular Stochastic RSI except usable even with charts that show dramatic (10x or more) volatility, such as in the beginning of the ZEC-BTC chart in the example attached.

DSS Bressert (Double Smoothed Stochastic)Hi
Let me introduce my DSS Bressert (Double Smoothed Stochastic) script.
Double Smoothed Stochastics (DSS) is designed by William Blaw.
It attempts to combine moving average methods with oscillator principles.

Customisable Stoch RSI [10 PRESETS INCLUDED]Customisable Stochastic by Nicholas Kormanik
A stochastic oscillator is a momentum indicator comparing a particular closing price of a security to a range of its prices over a certain period of time.
The sensitivity of the oscillator to market movements is reducible by adjusting that time period or by taking a moving average of the result.
It is used to generate overbought and oversold trading signals, utilizing a 0–100 bounded range of values.
In this version we have 4 levels
top levels are
95 - extra overbought
80 - semi-extra overbought
70 - standart overbought
bottom levels are
5 - extra oversold
20 - semi-extra oversold
30 - standart oversold
Message by Nicholas Kormanik :
" The formula I've adopted was put on the Silicon Investor web site thread by
'bdog'. Basically, I just leave the Slowing Periods (mp3) to 1, so it
really plays no part in things. However, if somebody presents a good
argument for using other than 1 ... hey, I'm amenable.
Chande, the original inventor, didn't use a moving average on the whole
thing. Chande's result was therefore sort of choppy. I guess along the way
people decided to add the EMA Periods to smooth things out. "
There are 10 presets, try to find your best!
1. 5 -- 5 -- 3
2. 8 -- 8 -- 5
3. 13 -- 13 -- 13
4. 21 -- 15 -- 13
5. 21 -- 21 -- 13
6. 34 -- 34 -- 13
7. 55 -- 55 -- 21
8. 89 -- 13 -- 34
9. 89 -- 89 -- 21
10. 233 -- 233 -- 34
On the chart im using 9th preset and the timeframe is daily on BTCUSD pair.
*DISCLAIMER*
Use this indicator for educational purpose only, i don't recommend you to use it to trade for real money!
Stoch+RSI With Color Combination. Hello Everyone This Indicater Base on (RSI and Stoch) COMBINATION With Color Combination.
You Can also use for
1-Divergence.
2-Overbought.
3-Oversold.
4-Breakout.
5-Support & Resistance Zones.

Stochastic with False bar R2-2 by JustUncleLThis study project is an updated version of the implementation of the "Stochastic False BAR" indicator.
Description:
The standard Stochastic buy/sell indications come from Stochastic crosses about the standard overbought/oversold zones (80/20). This does not always work and you get stuck in the OB/OS zones with a trend continuation. Utilising a second much longer length Stochastic, the "False BAR" (Black) indicates when it is unsafe to take Stochastic cross over trades. Where the false bar does not appear (aqua, no background highlighing), the overbought / oversold conditions of the Stochastic can be considered higher-probability reversal areas and thus trading opportunities.
This Revision:
Added options to enable/disable False Bar lines and Stochastic trends.
Added options to modify upper and lower limits of false bar Stochastic and trading stochastic trend.
Added option to show the trading Stochastic as coloured Ribbon.
Added name titles for all plots
Added Background highlighting for False Bar.

[FGL] Stochastic ATR Trend IndicatorThis indicator:
Detects trend direction using ATR-based dynamic bands around SMA.
Generates buy/sell signals using Stochastic crossover conditions filtered by trend.
Colors candles to show trend direction.
Plots a visual “trend zone” band on the chart.
INPUT PARAMETERS:
Stochastic Length → Period for the stochastic oscillator.
Smooth K and Smooth D → Smoothing parameters for %K and %D lines.
ATR Length → Period used for SMA-based trend detection.
LOGIC FLOW
Determine trend using long ATR-based SMA channel.
Detect momentum change with Stochastic cross.
Confirm both momentum and price align with trend.
Generate buy/sell signal + change candle color.
STRATEGIC INTERPRETATION
Best use: Trend-following momentum entries.
Avoids: Countertrend false signals by filtering with trend value.
Signals:
Buy: In uptrend + bullish stochastic crossover.
Sell: In downtrend + bearish stochastic crossover.

Stochastic and RSI2 entriesStochastic and RSI2 entries, v1.0
This indicator combines Stochastic and RSI to facilitate "RSI2" entry signals. Buy signals will be shown at the bottom.
The default configuration uses non-standard settings for the underlying indicators to tailor it for this type of entry strategy.
This is an entry strategy that tries to find entries close to "the dip".
A combination of Stochastic crossovers, VWAP, daily SMA50 and daily SMA200 are used to verify buy signals.
This indicator is written for bullish signals and aims to find the start of short trends or cheap entries for longer positions.
Like with any strategy, some signals will be false, and the user is advised to do some own research before using the buy signals for actual entries.
Happy trading!

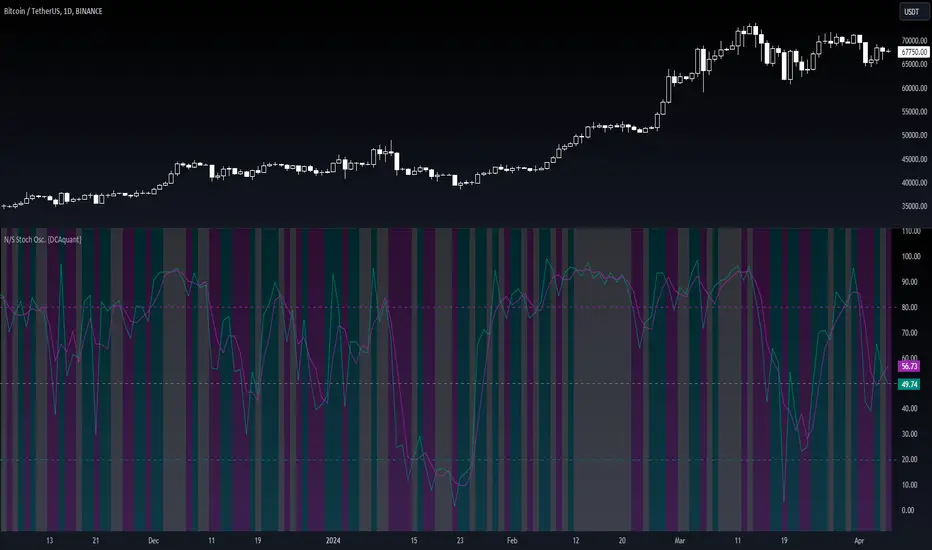
Neutral State Stochastic Oscillator {DCAquant}Neutral State Stochastic Oscillator {DCAquant}
The Neutral State Stochastic Oscillator {DCAquant} is an enhanced version of the classic Stochastic Oscillator. This iteration aims to refine the detection of neutral market states — periods where the market is neither overbought nor oversold — potentially signaling a period of consolidation or equilibrium before the next significant price move.
Key Features:
Advanced Oscillator Analysis: It extends the traditional use of the Stochastic Oscillator by identifying a neutral zone, which may signal a pause in market momentum.
Customizable Sensitivity: Users can adjust parameters such as K and D periods, Smooth K, and neutral zone thresholds to tailor the indicator to their trading style.
Neutral Zone Detection: This tool is especially adept at pinpointing where the %K and %D lines converge within a specific threshold, marking a neutral state.
How it Works:
%K and %D Calculation: The indicator calculates the Stochastic %K and %D lines over user-defined periods, smoothing %K for clearer signals.
Neutral Zone Threshold: A threshold defines how close %K and %D lines should be to each other to qualify as a neutral state, offering a refined perspective on market momentum.
Visual Contrast: The indicator employs a distinct color scheme to distinguish between neutral (gray), bullish (%K>%D in aqua), and bearish (%K<%D in fuchsia) market conditions, directly on the price chart.
Visual Indicators and Interpretation:
Neutral Market Condition: A gray background indicates a neutral state where %K and %D are close, suggesting a balanced market awaiting new forces to define the trend.
Market Extremes: Aqua and fuchsia backgrounds highlight when the market is exiting the neutral zone, potentially signaling the start of an uptrend or downtrend.
Strategic Application:
Consolidation and Breakout Identification: This tool helps in identifying consolidation zones which could lead to potential breakouts or breakdowns, aiding in strategic entry and exit decisions.
Multifaceted Market Analysis: By revealing neutral market states, it serves as a vital component in a comprehensive trading strategy, augmenting the insights provided by other technical indicators.
Customization and Usage:
Flexible for Various Markets: The Neutral State Stochastic Oscillator {DCAquant} is adaptable for a variety of markets, whether you're trading cryptocurrencies, stocks, forex, or commodities.
Confirmatory Tool: It acts as an excellent confirmatory tool when used with price action analysis, other oscillators, or trend indicators, ensuring a well-rounded analytical approach.
Disclaimer and User Guidance:
The Neutral State Stochastic Oscillator {DCAquant} is a sophisticated trading tool designed for informative purposes. Traders are advised to use it in conjunction with a robust risk management strategy and not as a standalone decision-making tool. As with all trading indicators, success cannot be guaranteed, and it is recommended that traders perform their due diligence before executing trades based on signals from this or any other analytical tool.