Waves MultiTimeframe AlfredThe price on the charts moves quite chaotically, but when we look at a given interval (and eliminate the noise created on the lower interval), we can distinguish trend price movements up and down. They are almost never a straight line, but the price reaches higher and higher lows - we have up trend or lower and lower highs when we have a down trend.
There are many theories trying to describe trend movements, and many trend change detectors have been created on their basis.
In last centry we we had few famous researchers of investment theories, one of them was the Japanese journalist and investor Goichi Hosoda, creator of Ichimoku trading theory.
Goichi Hosoda proposed a trend change detector called Kyushu Legs. This detector compares the values of the current price with the price from 9 weeks ago and illustrates them using a candlestick chart. Than on the chart we can distinguishes B, P, Y formations that allow us to determine the trend and notify about trend change moment. This idea was developed further. The set of Kyushu Legs formations (B, P, Y) has been transferred to raw price chart and transformed into a set of rules detecting trend changes on the current price chart. A unique feature this method is the comparison of the parameters of neighboring candles in order to dynamically determine the values beyond which the trend changes. This eliminate the need of predefined threshold values and adjusting it to different price ranges.
Described trend detector is available on TradingView under the name "Waves" and was a starting point of a whole package of "Waves" scripts built around this detector.
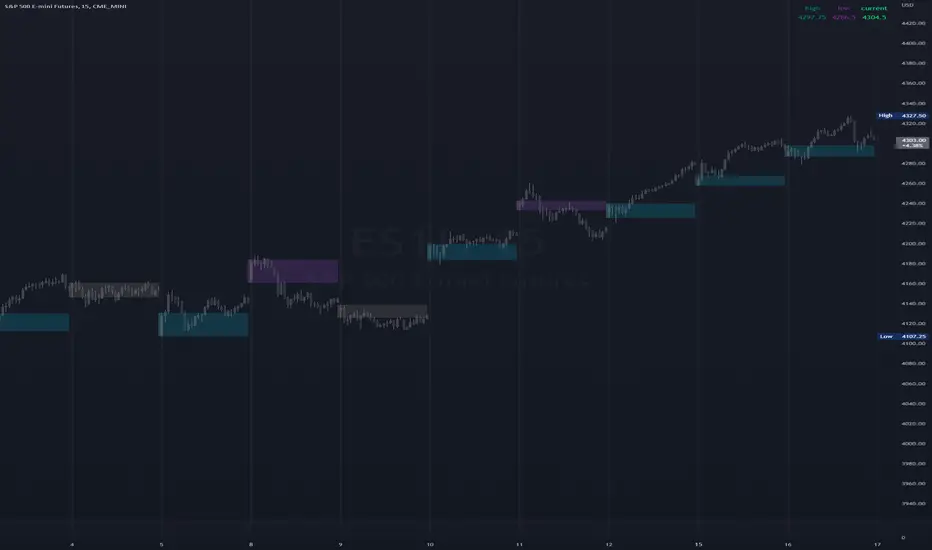
"Waves MultiTimeframe Alfred" is part of the "Waves" package. It is an extension of trend detector with the ability to analyze in parallel candle data taken from higher intervals. Thanks to that this detector detects moments of trend changes on many intervals at once.
In top-right corner it displays a window with basic informations about trend (and potencial trend change moment) at higher intervals, such as:
- Trend direction confirmed on last closed candle
- In real time trend direction with the assumption that candle will be closes at current price level.
- Time to current candle close
- Price change done by the current candle
- Price's distance to the trend change threshold
Trend direction and potencial trend change are shown with a symbols:
↗ - Continuation of up trend
↘ - Continuation of down trend
↺ - Trend change to up trend
↷ - Trend change to down trend
This script supports 2 trend detection rulesets:
- Low - More sensitive trend detection ruleset, detects changes faster and more often than Medium, announcing potential changes in the Medium trend
- Medium - Less sensitive trend detection ruleset detecting trends on the chart.
Remember, until candle is not close price can move and trend indication can change. All trend indicators have a delay and are describing past till now. Future prediction cannot be done by software.
This script can be used alone, but the creator's intention was to use it together with other scripts from the "Waves" package. e.g. It can be used with the "Waves" script which draw trend lines and trend change moments on the current interval and we can use "Waves MultiTimeframe Alfred" as an assistant showing basic trends situation on up to 3 higher intervals.
Script settings:
Timeframe 1,2,3 - Option to pick 3 higher timeframes with text and background color settings.
Timer - Showing count down timer to the end of current bar on that interval
Candles - Showing candle symbol with current price change done on that interval. A separate candle color can be picked for price up and down candles.
Low wave row - Row with low trend symbol and price distance to the current low trend threshold (trend change price).
↗ - Continuation of up trend
↘ - Continuation of down trend
↺ - Trend change to up trend
↷ - Trend change to down trend
Low wave last bar symbol - Symbol of trend confirmed by previous bar. Drawn in the first line before interval symbol:
↗ - up trend
↘ - down trend
Mid wave row - Row with mid trend symbol and price distance to the current mid trend threshold (trend change price).
↗ - Continuation of up trend
↘ - Continuation of down trend
↺ - Trend change to up trend
↷ - Trend change to down trend
Mid wave last bar symbol - Symbol of trend confirmed by previous bar. Drawn in the first line after interval symbol:
↗ - up trend
↘ - down trend
Warnings - Showing explanation messages when interval data are not available.
Signal change - Experimental option to signal trend change with a different color.
Troubleshooting:
In case of any problems, please send error details to the author of the script.
Trendchange

OverbalanceOverbalance script tracks trend moves and biggest corrections in those moves.
Based on last trend extreme value (low or high) it can draw line symbolizing correction equal to
the biggest correction in that trend. It can track up to 20 independent (both up and down) trends on one chart.
Overbalance method works on an assumption that trend continues until we have correction bigger than the biggest existing correction in that trend. Comparing the historically biggest correction with the current one can give a warning signal.
There are markets and instruments for which the size of corrections is repeated, and tracking corrections in the trend can be used to predict the trend change moment. - Just remember that if something happened in the past it is not guaranteed that it will happen again.
This script can be used by ANY user. You DO NOT NEED to have PRO or PREMIUM account to use it.
Script settings:
Trend min change - Filter out price moves smaller than % of current price.
OB up - Showing overbalance in up trends
OB down - Showing overbalance in down trends
Historical with precision - Showing corrections moves that were equal to biggest previous correction in that trend with a given (%) precision.
OB prediction up - Showing overbalance threshold in current up trends
OB prediction down - Showing overbalance threshold in current down trends
OB Exceeded - Showing broken overbalance thresholds
Arrows - Showing overbalance thresholds with an arrows
(with labels) - Showing labels over overbalance threshold arrows
Price line - It draws a line at the price level, under the arrows.
Troubleshooting:
In case of any problems, send error details to the author of the script.

Z-Score(Slope(OBV(LBC)))Summary : Market price is simply a dance of liquidity to the specific market.
tl;dr: "Cash come-in, market moon; Cash go-out, market doom"
In Simple Language : Large changes in the money flow to an asset often mark local price extremia.
Academic paper:
Title: Z-Score(Slope(OBV)): An Efficient Indicator for Identifying Local Extremes in Asset Prices
Abstract: This paper presents a novel trading indicator, Z-Score(Slope(OBV)), that aims to predict local extremes in asset prices by analyzing the patterns of money flow. The indicator is constructed using the Z-score of the slope of the On Balance Volume (OBV).
Hypothesis: The price levels at which the money flows into and out of an asset often mark local extremes. This notion underpins our exploration of the Z-Score(Slope(OBV)) indicator's potential in identifying these critical points.
1. On Balance Volume (OBV): The OBV is a momentum indicator that leverages the volume flow to forecast potential changes in asset prices. It operates on the premise that changes in volume often presage shifts in price. The OBV algorithm adds a period's volume to the cumulative total when the closing price is up and subtracts it when the closing price is down. Therefore, an ascending OBV suggests positive volume pressure, potentially heralding higher prices, while a declining OBV signifies negative volume pressure, possibly indicating lower prices.
2. Slope: In this context, the slope represents the rate of change of the OBV. It is a measure of the rise-over-run for a linear regression line through the OBV data points. By evaluating the slope of the OBV, we can extract valuable insights into the momentum of the volume. A positive slope indicates increasing volume momentum, suggesting growing interest in the asset, while a negative slope implies declining volume momentum, potentially reflecting dwindling interest.
3. Z-Score: The Z-score is a statistical measure that delineates a data point's relationship to the mean of a group of values, expressed in terms of standard deviations from the mean. For instance, a Z-score of 0 reveals that the data point's score aligns with the mean score. Positive Z-scores indicate values higher than the mean, and negative Z-scores represent values lower than the mean. Applying the Z-score to the slope of the OBV allows us to comprehend the degree of deviation of the current OBV slope from its historical mean.
A Z-score of 1 suggests that the OBV's slope is one standard deviation from the mean, which implies that the slope is within the range of values where approximately 68% (not 67%) of all values lie.
A Z-score of 2 implies that the slope is two standard deviations from the mean, thus within the range where roughly 95% of all values lie.
A Z-score of 3 indicates that the slope is three standard deviations from the mean, putting it within the range where about 99.7% of all values lie.
Z-scores of 4 and 5 and beyond are increasingly rare and represent extreme values.
4. The Z-Score(Slope(OBV)) Indicator and Line Break Chart Synergy: The Z-Score(Slope(OBV)) indicator's efficiency is further amplified when visualized using a Line Break chart. This chart type disregards time, concentrating solely on price changes, thus providing a clear visualization of market trends. When combined with the Line Break chart, the Z-Score(Slope(OBV(LBC))) indicator can help traders identify trend shifts more accurately and promptly, reinforcing the hypothesis that price levels where money flows into and out of an asset often mark local extremes.
In summary, the Z-Score(Slope(OBV)) indicator, combining volume, momentum, and statistical analysis, provides a robust tool for traders to predict local extremes in asset prices.
Regarding Implementation:
- This is implemented using Pinescript V5
- Uses inbuilt ta module
- Very effective and simple and efficient computation in 30 lines of code

High & Low Of Custom SessionThis script boxes a custom session and sets the box at the high and low of the session and draws that box to the next session.
Box color is determined by price in relation to the box position. Box color is set at the start of the next session. This allows
user to lookback at multiple box sets to see how each day closed in relation to the session highlighted.
I have written this for backtesting purposes and intend to expand it to use with volume analysis and gradient color to change the box color based on how many times price tests
the box.
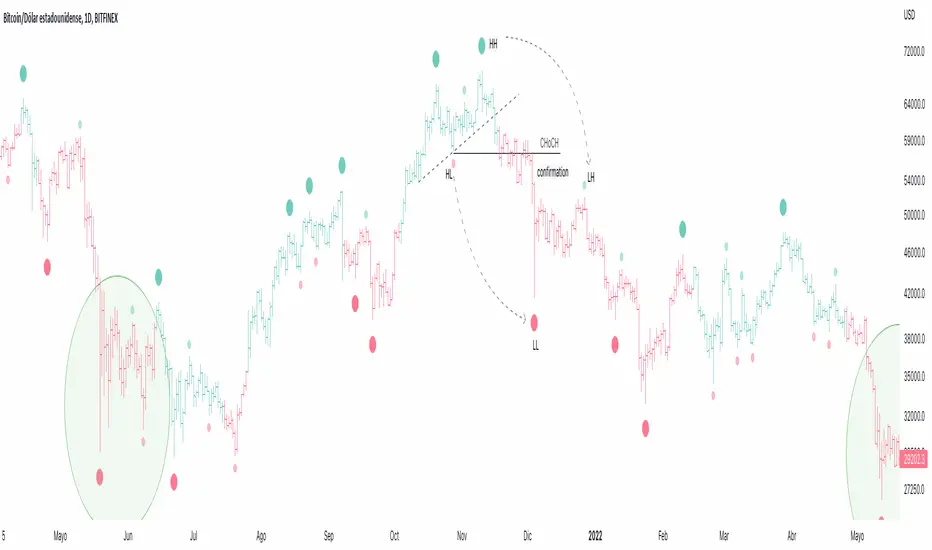
[MattLet] Market Structure BiasThis indicator is based on a zigzag and shows swings and market structure breaks.
It is very useful to analyze trend changes in short, medium and long periods.
Features:
1 - Lower Lows, Lower Highs, Higher Lows and Higher Highs
2 - Colored candles/bars Change of Character
Good luck!
Multiple Trend Overview
-----------------
Hey there!
The indicator is used for both an overall and a short trend assessment. Both superordinate structures and subordinate movements are mapped. With the help of calculations via Ema , MACD and other tools, graphic trends can be visualized.
The green areas always signal an uptrend, while the red areas indicate a downtrend. The red & blue ema enclose the area of the minor trend. Orange & Green signal the overall trend. Ideally, both Ema faces run in the same direction as the multi-color line. Special alerts in the charts show this again directly in the chart. The multiple setting to display the trends from different time frames is innovative!
For all asset classes!
The indicator is designed for the m30 chart. But it can also be used well on other time frames. In addition, the display can be adjusted via the options and set to any time frame. The indicator has various settings and options that can be activated or deactivated separately.
Caution: Past results do not guarantee future profits!
Follow the link below to get access to this indicator or get us a PM to get access.
--------------------------------------------------------------------------------------------------------------
--------------------------------------------------------------------------------------------------------------
-----------------
Willkommen!
Der Indikator dient sowohl für eine übergeordnete als auch eine untergeordnete Trendeinschätzung. Hierbei werden sowohl übergeordnete Strukturen als auch untergeordnete Bewegungen abgebildet. Mit Hilfe von Berechnungen über Ema , MACD und weiteren Hilfsmittel lassen sich grafische Trends visualisieren.
Die grünen Flächen signalisieren immer einen Aufwärtstrend, während die roten Flächen einen Abwärtstrend anzeigen. Der rote & der blaue Ema schließen die Fläche des untergeordneten Trends ein. Orange & Grün signalisieren den übergeordneten Trend. Idealerweise laufen beide Ema Flächen in die gleiche Richtung wie die Multi-Farben Linie. Spezielle Alerts im Charts zeigen dies auch nochmal direkt im Chart. Innovativ ist die multiple Einstellung die Trends aus verschiedenen Timeframes abzubilden!
Für alle Asset Klassen!
Der Indikator ist für den m30 Chart ausgelegt. Lässt sich aber auch auf anderen Timeframes gut nutzen. Zusätzlich kann die Anzeige über die Optionen angepasst werden und auf jede Timeframe eingestellt werden. Der Indikator besitzt verschiedene Einstellungsmöglichkeiten und Zusätze die separat aktiviert oder deaktiviert werden können.
Achtung: Vergangene Ergebnisse garantieren keine zukünftigen Gewinne!
Verwenden Sie den folgenden Link, um Zugriff auf diesen Indikator zu erhalten oder schreibe uns eine PM um Zugriff zu erhalten.

#JJ Trend
-----------------
Hey there!
The indicator is used for a rough trend assessment. Both superordinate structures and subordinate movements are mapped here. With the help of a calculation via Ema and MACD , different timeframes can be displayed in the same chart. This makes the multi-timeframe analysis extremely easy.
On all Asset classes!
The indicator is for the m5 / m15 chart. In addition, the display can be adapted using the options and set to any timeframe.
Caution: Past results do not guarantee future profits!
Follow the link below to get access to this indicator or get us a PM to get access.
--------------------------------------------------------------------------------------------------------------
--------------------------------------------------------------------------------------------------------------
-----------------
Willkommen!
Der Indikator dient für eine grobe Trendeinschätzung. Hierbei werden sowohl übergeordnete Strukturen als auch untergeordnete Bewegungen abgebildet. Mit Hilfe einer Berechnung über Ema und MACD lassen sich verschiedene Timeframes im gleichen Chart abbilden. Das erleichtert die Multi Timeframe Analyse extrem.
Für alle Asset Klassen!
Der Indikator ist für den m5 / m15 Chart ausgelegt. Zusätzlich kann die Anzeige über die Optionen angepasst werden und auf jede Timeframe eingestellt werden.
Achtung: Vergangene Ergebnisse garantieren keine zukünftigen Gewinne!
Verwenden Sie den folgenden Link, um Zugriff auf diesen Indikator zu erhalten oder schreibe uns eine PM um Zugriff zu erhalten.

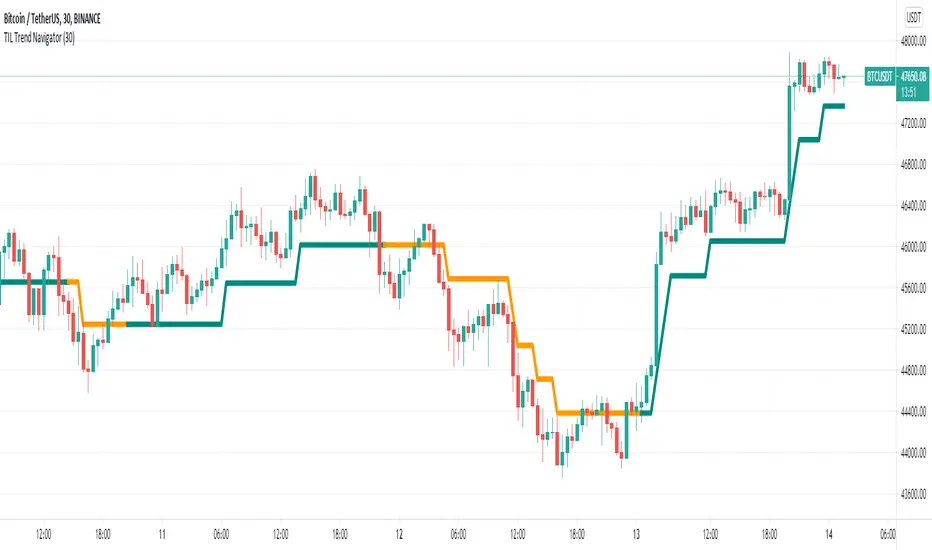
TIL Trend NavigatorTrading Indicator Lab’s Trend Navigator for TradingView is an indicator that can help you reveal the underlying trends in any chart on any timeframe.
Determining Trends
It only takes a minute or two to analyze the indicator with its simple yet insightful methods of representing bullish, bearish and ranging price action across the chart. It forms a single line that runs in 3 directions:
- Upward direction – represents a significant bullish price action
- Horizontal direction – represents ranging price action or consolidation
- Downward direction – represents a significant bearish price action
The indicator borrows the concept of Renko charts where upward and downward price action are shown to move at a single identical angle. This makes the indicator more intuitive and easier to read.
Support and Resistance
That’s not all. The Trend Navigator can also serve as a support or resistance line at any given point in the bar history. This is distinguished with the dual colors of the lines which alternates at each segment:
- Support segment (green) – the segment acts as support where price moves above the line
- Resistance segment (orange) – the segment acts as resistance where price moves below the line
Breakouts occur when the bar crosses above or below the Trend Navigator, at which point, its line changes color to signal the change of its role as a support or resistance level.
Available Alert Conditions
- Cross – triggers when price crosses the Trend Navigator
- Soar – triggers when majority of the bar’s body crosses above the Trend Navigator
- Plummet – triggers when majority of the bar’s body crosses below the Trend Navigator
- Uptrend – triggers when a new uptrend is detected
- Downtrend – triggers when a new downtrend is detected
- Ranging – triggers when a new ranging price action is detected
- Trend Reversal – triggers when either an uptrend or downtrend is detected
Inputs
- Length – sets the number of bars the indicator analyzes at each execution
- Support Segment Color – allows the user to change the color of the support segments. Its default color is green
- Resistance Segment Color – allows the user to change the color of the resistance segments. Its default color is orange

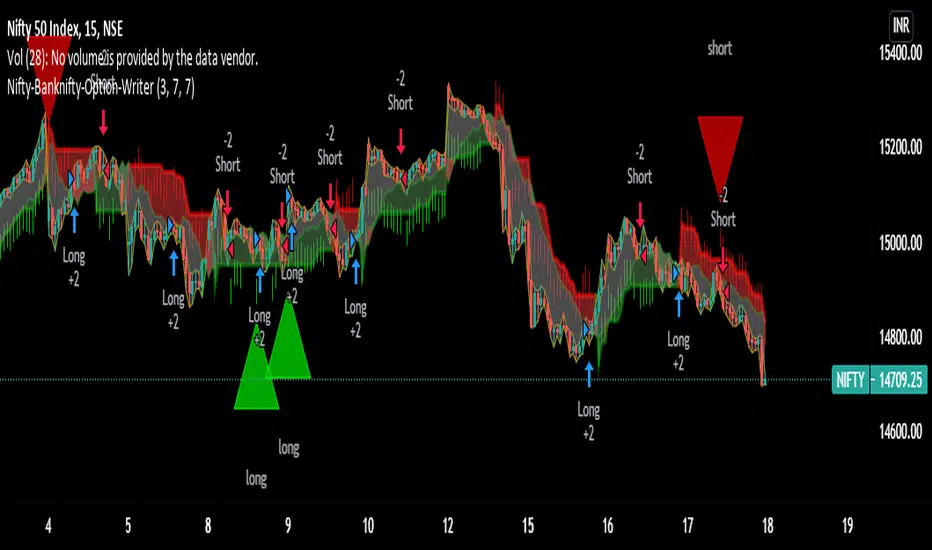
Nifty-Banknifty-Option-WriterNifty-Banknifty-Option-Writer tool is having signals like below
1) Bullish signal for taking long trade
2) Bearish signal for taking short trade
3) Triangle UP signal for trend change Long trade
4) Triangle Down signal for trend change Short trade
5) Big Arrow down signal for closing long trade if u have any short trades
6) Big Arrow UP signal for closing Short trade if i have any long trades
7) This tool is having three zone GREEN, RED and GRAY
8) small red arrow and small green arrow
===========================================================================================
How to use this tool:-
You should take long trade in index call option or sell put option when you will get Bullish signal or Big green Triangle and book the profit when you get any red signal either Its Big red triangle or Bearish signal or big downward red arrow close long trade or small red arrow.
Similarly you can take long trade for Index put option or sell call option for Short trade when you get Bearish signal or Big red triangle and book the profit when you will get close long big green arrow signal or small green arrow or Bullish signal or Big green triangle.
-If candle formation is having above GREEN and GRAY zone then it signifies strength is bullish and remain in Long trade till you are not getting close long trade signal or small red downward arrow signal.
-If candle formation is happening below RED and GRAY zone then it signifies strength is bearish and remain in short trade till you are not getting close short trade signal or small green upward arrow signal.
I have taken combination of ATR, Super trend and RSI to get the trend and trend change of underlying.
this tool i have created for any underlying not specific to Nifty or Banknifty though I have used this name so Indian can take benefit for Index trading.
Still didn't understand then ping me or give me call on my number given in signature i will make zoom call with you so will understand how to use this script.
=============================================================
I have taking consideration of Bullish and Bearish trade for strategy and its giving its optimal result in 1 hr time frame.
I have added commission/slippage for trade so actual result can be displayed in strategy tester.
Ping me or DM me to subscribe this indicator.
I have given all my indicator details below link (Signature URL). You can check indicators and call me on given number or email me on given email to access the scripts and indicators. Telegram link is also given you can ping me there.
--------------------------------------------------------------------------------------------------------------------------------------
Disclaimer : Past performance of the indicator is not giving guarantee for future performance as well, it may change as per market condition.
-------------------------------------------------------------------------------------------------------------------------------------
Goersch TrendENGLISH:
Goersch Trend Indicator for TradingView is a trend indicator that shows the actual trend and the trend strength based on the price movement of the past. The indicator can be used for any underlying and trading timeframe. The special feature is that it is extremely easy to interpret and that it works "out-of-the-box". The calculation automatically adjusts to the displayed timeframe. The interpretation of the Goersch Trned indicator is always the same - whether you are looking at a stock, a currency, an index or a commodity. Regardless of whether you work in the 5-minute chart, hourly, daily or even weekly chart. It is extremely simple to judge whether an underlying is running in a trend, whether this trend strength is currently increasing (stable) or decreasing (when the trend is weakening), or whether the trend is currently changing direction. The indicator shows you the important information at a glance.
The interpretation of the Goersch Trend indicator is very simple. Red bars represent a downward trend, green bars appear during an upward trend. The change from red to green signals a change from a downward to an upward trend and vice versa. The height of the bars represents the trend strength. The trend strength decreases when the bars become shorter. The change from red to green then signals a completed trend change.
For the calculation of the bar height, the fluctuation of a price change index is used as a basis in the Goersch Trend Indicator. The price change index is calculated from the respective candle closing price and the true high or true low of the previous candle, which is added or subtracted accordingly. From this price change index, a long-term moving average is calculated, the difference between this average and the price change index is visualized by means of the red and green bars.
To get access to the script, please PM, or send a message to the email address in the signature.
DEUTSCH:
Beim Goersch Trend Indikator für TradingView handelt es sich um einen Trend-Indikator, der anhand der Preisbewegung der Vergangenheit den Trend sowie die Trendstärke anzeigt. Verwendet werden kann der Indikator für jegliche Basiswerte und Zeiteinheiten. Das Besondere ist, dass er extrem leicht zu interpretieren ist und dass er "out-of-the-box" arbeitet. Die Berechnung passt sich automatisch auf die dargestellte Zeitebene an. So ist eine Interpretation immer gleich – egal ob Sie eine Aktie, eine Währung, einen Index oder einen Rohstoff betrachten. Unabhängig davon, ob Sie im 5-Minuten-Chart, Stunden-, Tages- oder gar Wochen-Chart arbeiten. Dabei ist es äußerst simpel zu beurteilen, ob ein Wert in einem Trend läuft, ob diese Trendstärke gerade zunimmt (also stabil ist) oder abnimmt (der Trend also schwächer wird), oder ob der Trend gerade kippt. Der Indikator zeigt Ihnen die wichtigen Informationen auf einen Blick.
Die Interpretation des Goersch Trend Indikators ist denkbar einfach. Rote Balken stehen für einen Abwärtstrend, grüne Balken erscheinen während eines Aufwärtstrends. Der Wechsel von Rot auf Grün signalisiert einen Wechsel vom Abwärts- in einen Aufwärtstrend und umgekehrt. Die Höhe der Balken repräsentiert die Trendstärke. Dadurch ergibt es sich schon, dass beispielsweise die Trendstärke abnimmt, wenn die Balken kürzer werden. Der Wechsel von Rot auf Grün signalisiert dann einen vollendeten Trendwechsel.
Für die Berechnung der Balkenhöhe wird im Goersch Trend Indikator die Schwankung eines Preisveränderungsindex zugrunde gelegt. Dieser errechnet sich aus dem jeweiligen Kerzen-Schlusskurs und dem True-High bzw. True-Low der vorhergehenden Kerze, das entsprechend hinzugerechnet oder abgezogen wird. Von diesem Preisveränderungsindex wird ein langfristiger gleitender Durchschnitt errechnet, die Differenz dieses Durchschnittes und des Preisveränderungsindex wird mittels der roten und grünen Balken visualisiert.
Um Zugang zum Skript zu erhalten, bitte eine PM, oder eine Nachricht an die Emailadresse in der Signatur.
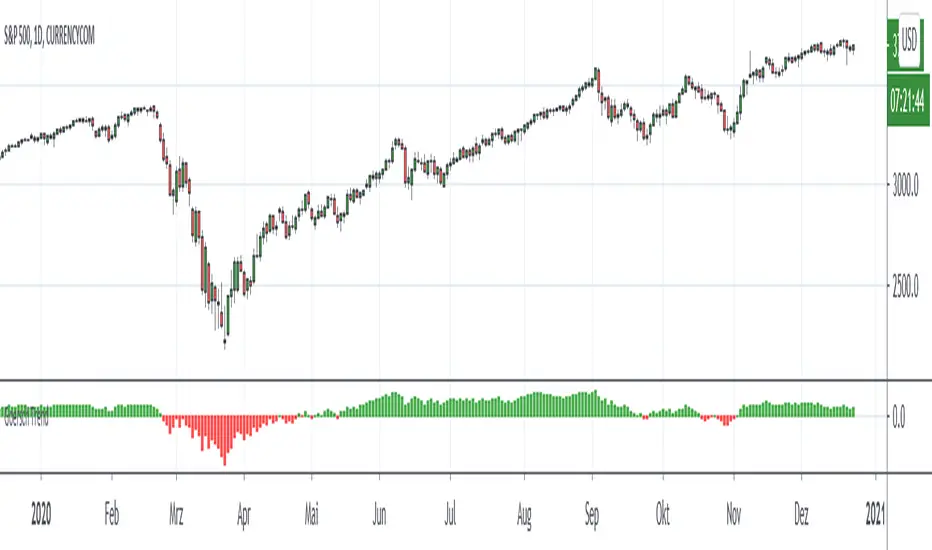
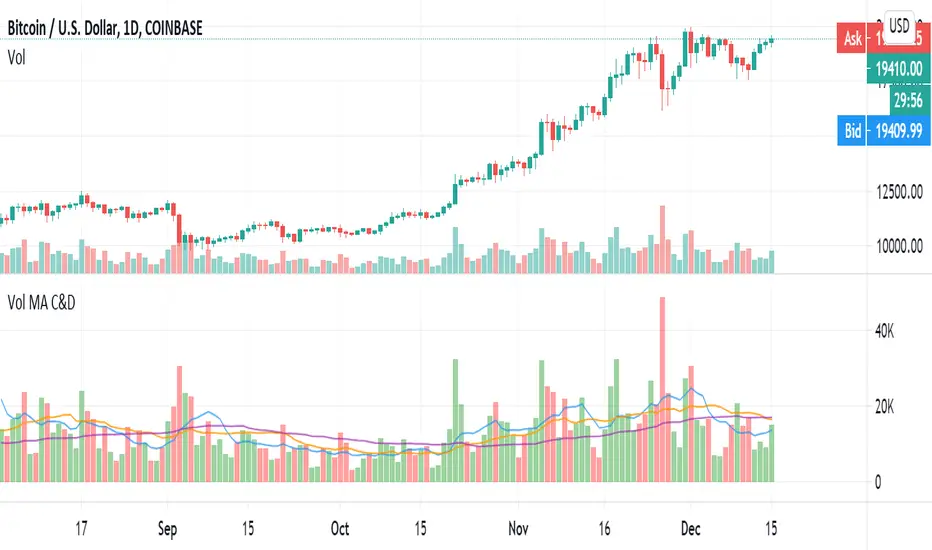
Volume MA Convergence and DivergenceGreetings, I imagine there is already some similar scripts as this one but I couldn't find one so I decided to add something.
We are looking at convergence and divergence signals of moving-average values of 3 different volume time frames. The time frames can of course be tweaked to ones liking, I set up Vol-MA8, 20 and 50. A strong enough divergence in at least 2 of the MAs may perhaps signal an exhausting trend or the beginning of a new one. Convergence of all three to a single point, or close enough to, may signal impending volatility potentially. The latter would best be complimented with another volatility predicative indicator or correlating impending price change data. There are more signals to be studied within this single indicator such as a converging occurrence above OR below the mean, etc, etc.
@OptiSean on Twitter
Enjoy, Cheers
TBS - Trend Buy and Sell IndicatorTrend Buy and Sell Indicator
TBS identifies trend based on price cross-over/cross-under to a moving average. Confirmed Up-trend is displayed in green and Down-trend in red backgrounds. Before a trend is confirmed price cross-over is displayed in blue and cross-under in orange backgrounds. Once an uptrend is confirmed, TBS suggest buys based on touch downs to a Support moving average by a green arrow under the candle . A sell is suggested by TBS by a red arrow on top of the candle when the price reaches a certain percentage above support moving average. Motivation and Tolerance levels are provided to fine tune buying and selling signals.
Example : Default settings for BTC Weekly charts are Trend Moving Average = 50, Support Moving Average = 21, Motivation Buy = 10, Tolerance Buy = 5, Motivation Sell = 50 and Tolerance Sell = 90. That means in uptrend identified by green background every time the closing price touches 10% higher than 21 week moving average value TBS suggests buy, so a trader can choose to buy 80% of intended position at this level. If the price continues to drop down and touches 5% below 21 week moving average, a trader may choose to buy another 20% at this level. In the likely scenarios of price hike from here a trader may choose to sell 80% at the Motivation Sell level 50% higher than 21 week moving average. If the price reaches Tolerance Sell level at 90% higher than 21 week moving average a trader may choose to sell remaining 20% of the position.
Note 1 : TBS suggest Buys and sells but the execution of buy and sell is up to trader's discretion for example using Stop Buy order or Limit Buy order etc.
Note 2 : TBS is designed to be a medium to long term indicator for example weekly and monthly timescales. Traders might find it useful on shorter term time-frames but its not designed for short term time frame in mind.
Note 3 : Most of the parameters in TBS indicator are configurable as Trend Moving Average and Support Moving Average vary significantly across assets. Default parameters are set for Bitcoin Weekly time frame. Traders should play around with parameters to find best fit for Trend Moving Average and Support Moving Average for the asset of interest. For example TBS is very relevant and useful for Gold Weekly time frame with Trend Moving Average = 100, Support Moving Average = 30, Motivation Buy = 1, Tolerance Buy = 0, Motivation Sell = 11 and Tolerance Sell = 20.

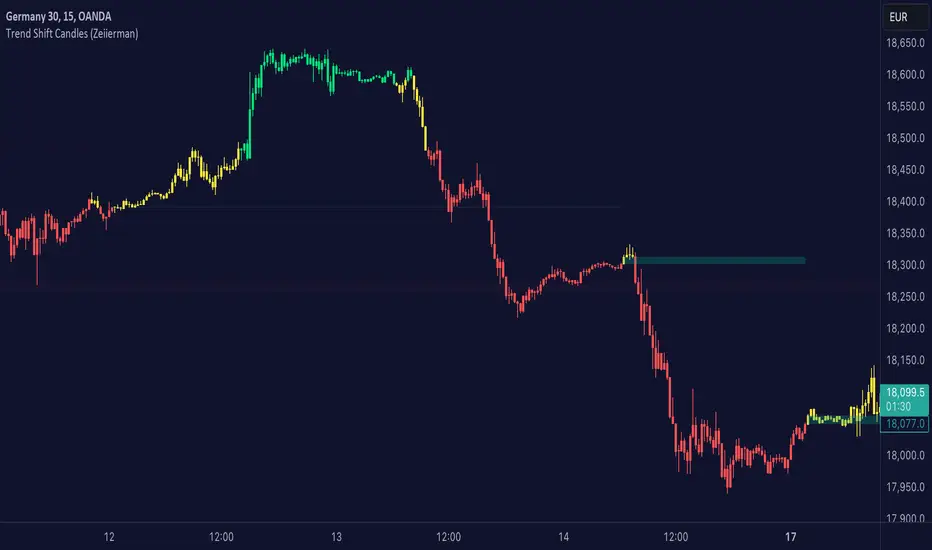
Trend shift Candles (Expo)Trend shift Candles (Expo) identifies where the market characteristics change. Trend shifts often occur in these areas. This is visualized with white candlesticks and Zones.
-> When the market enters a positive trend the candlesticks become green and when the market enters a negative trend the candlesticks become red.
-> The user can choose which timeframe to use. Vwap can be enabled as an input source instead of using price.
-> Please play around with the settings, I haven't set them to any specific values.
HOW TO USE
1. Use the indicator to identify the direction of the trend.
2. Use the indicator to identify trend changes.
-> Visual Order should be set to "Bring to Front" in order to see the color of the candles.
INDICATOR IN ACTION
4 hour chart
The indicator work on Heikin Ashi, Candles, Bars, Renko, Line Break, Kagi, and Point & Figure chart.
I hope you find this indicator useful , and please comment or contact me if you like the script or have any questions/suggestions for future improvements. Thanks!
I will continually work on this indicator, so please share your experience and feedback as it will enable me to make even better improvements. Thanks to everyone that has already contacted me regarding my scripts. Your feedback is valuable for future developments!
ACCESS THE INDICATOR
• Contact me on TradingView or use the links below
-----------------
Disclaimer
Copyright by Zeiierman.
The information contained in my scripts/indicators/ideas does not constitute financial advice or a solicitation to buy or sell any securities of any type. I will not accept liability for any loss or damage, including without limitation any loss of profit, which may arise directly or indirectly from the use of or reliance on such information.
All investments involve risk, and the past performance of a security, industry, sector, market, financial product, trading strategy, or individual’s trading does not guarantee future results or returns. Investors are fully responsible for any investment decisions they make. Such decisions should be based solely on an evaluation of their financial circumstances, investment objectives, risk tolerance, and liquidity needs.
My scripts/indicators/ideas are only for educational purposes
Sto RSI and kijun-sen line to determine and follow the trend This script uses 25-75 treshold of stochastic RSI with the help of kijun-sen as confirmation, to find entry points to any trend either newly developed or an established one. I just realized it on the 1 hour SPX chart. Sure it can be used on other symbols. Crossing above/below 25/75 line of sto RSI is considered as buy/sell signal. Signals are evaluated whether price be above/below kijun-sen line. If a sell signal below kijun-sen is generated it is a continuation signal for downtrend, otherwise it is a countertrend signal (maybe a signal for a new downtrend). A countertrend signal must be evaluated carefully and only accepted in the right side of kijun-sen. e.g entering a sell signal generated above kijun-sen should be accepted only below the kijun-sen, vice-versa.

Bullish and Bearish Engulfing and RSI, DMI and PSAR confirmationThe study combines Bearish and Bullish Engulfing pivot strategy with strong trend confirmative indicators:
Directional Movement Index (DMI)
Parabolic SAR
RSI Bands
Engulfing patterns in market provide a useful way for traders to enter the market in anticipation of a possible reversal in the trend. Engulfing candles tend to signal a reversal of the current trend in the market. This specific pattern involves two candles with the latter candle "engulfing" the entire body of the candle before it. The engulfing candle can be bullish or bearish depending on where it forms in relation to the existing trend
The indicator can be applied to trading pairs with USD, USDT, ETH and BTC quote currencies. Indicator supports spot, futures and marginal trading exchanges. It calculates and compares values of the price action candles to define is there an engulfing and what type it is: bullish or bearish:
If there is a bullish engulfing the indicator fills price action candle with yellow color
If there is a bearish engulfing the indicator fills price action candle with purple color
Advantages of this indicator:
1. This indicator reveals presence of both types of engulfing simultaneously
2. Weak engulfment signals and market noises are filtered by RSI bands, DMI and PSAR confirmations. This allows to receive only strong and confirmed engulfments
3. This indicator includes both
Study with built-in custom alerts to use with your own software through web hook connection.
Strategy with configurable risk management settings (order size, commission, take profit, stop loss and trailing). This provides you opportunity of direct broker connection and allows to conduct backtests before applying the strategy to real account
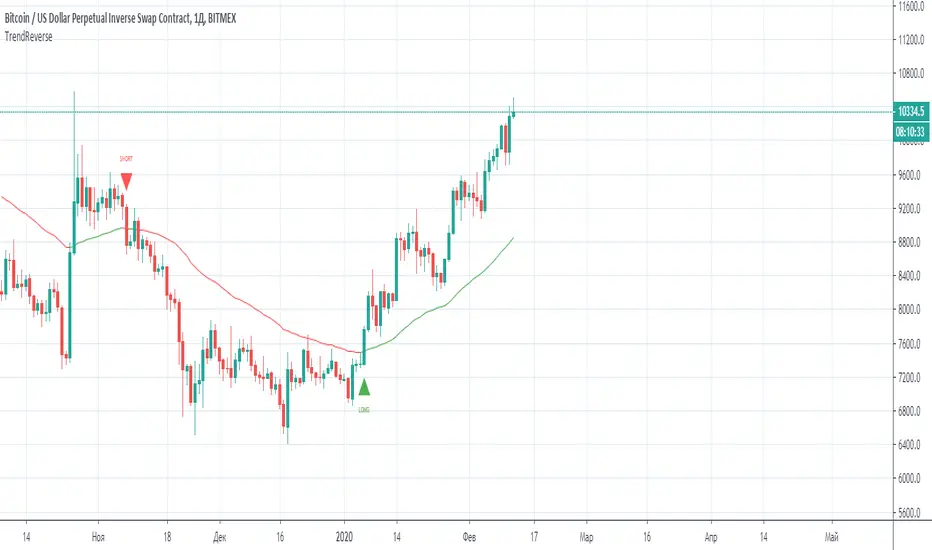
At the chart you can see the historical price action of XBTUSD at BitMEX exchange from 9th of May 2020 till 17th of May 2020 indicator. Moments when the indicator triggered to enter a position are described with message clouds. Moments when a certain position should be closed are highlighted with circles and commented with clouds
How to use?
Long signals:
1. Apply indicator to the trading pair your are interested in
2. Once bullish engulfing conditions are met price action candle will be colored yellow.
3. Once price action breaks RSI resistance band, retraces and closes below the band the signal is finished and the position should be closed
Short signals:
1. Apply indicator to the trading pair your are interested in
2. Once bearish engulfing conditions are met price action candle will be colored purple.
3. Once price action breaks RSI support band, retraces and closes above the band the signal is finished and the position should be closed
Automatic strategy:
When conditions of long or short position from the strategy are met the script opens position.
Strategy.exit closes the position once risk management settings are met.
Strategy.close closes the position once RSI band rejection is confirmed
If you want to obtain access to the indicator please send us a personal message
Best regards,
SkyRock Signals team

OneGreenCandle Kalman - RSIKalman filter on multiple RSI periods. Usefull on higher timeframes to confirm a change of trend.

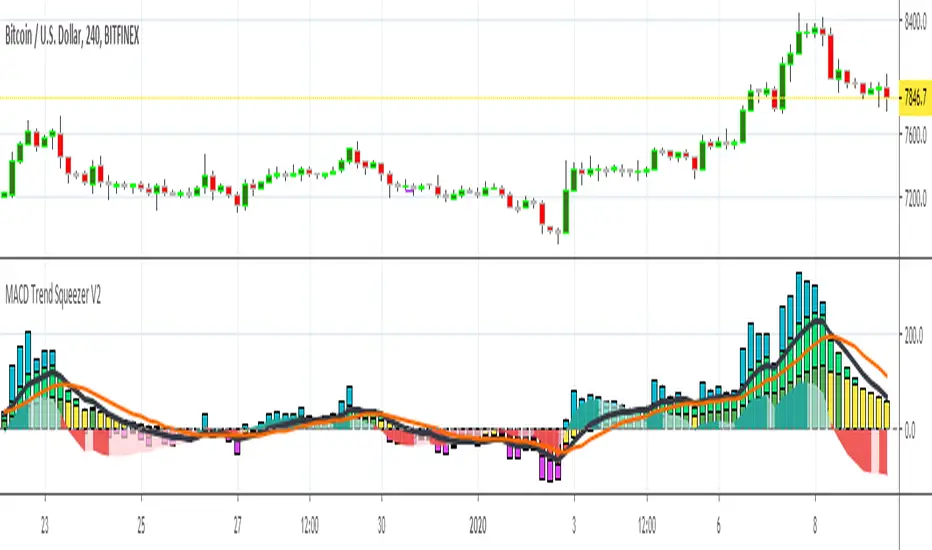
MACD Trend Squeezer V2This is a combination of a slightly sped up MACD overlay on top of a modified Bar Trend Squeeze or highly modified Momentum indicator. Helps to see the trend/momentum matched with the characteristics of the MACD and it's historiography. Very user friendly for adjusting color, transparency, depth, lines, size, etc.
MACD is the dark gray line.
Its signal slower line is orange.
Its historiography is the area fill blues and reds
Trend Squeezer / momentum are the Bars in the background.
// Changes from original version \\
Visual depth mostly. Most of the items are adjustable in the settings.
Increased user friendly inputs to adjust colors, lines, data, etc.
(darken / lighten and change background bar colors, increase/decrease line strengths and colors, adjust field data inputs)
Filthy REPAINTING of McNasty Profits*** THIS SCRIPT REPAINTS ***
Looking at the history will go you NO IDEA as to actual performance, or alerts that triggered within each bar. I made all of the alerts repaint in order to allow an alert each minute a condition is met, and never again after.
For instance; receive an alert each time the price is within a particular plotted area on the chart (as defined by settings). This could not be accomplished without repainting.
In order to receive a notification of the price crossing a particular line, YOU NEED TO SET ALERTS TO "ONCE PER MINUTE."
This way, if you use an alert to enter a position and then get stopped out, you can re-enter on the next alert if the price moves in the original direction again within the same bar.
Also, I made this script so that each entry has an available Stop Loss alert that will get you out of a position going in the wrong direction (and option to enter in opposite direction). You set the parameters within the settings.
Although each position has a tight Stop Loss available via Alert, I also recommend using a similar tight Stop Loss directly on your exchange in case an error occurs anywhere within the chain.
This script HAS A LOT OF OPTIONS for how you can use it, from very conservative to extremely aggressive. There are NINE customizable alerts for the user to decide how/when to use, or ignore entirely.
When the Alerts are set to "ONCE PER MINUTE" you will get an alert each time the price crosses the corresponding area on the chart, but the characters only remain on the charts history if the alert was still firing (Once Per Minute) when the bar closed. This is why the Alerts on the chart's history are completely irrelevant.
As you can imagine, this is a LOT OF ALERTS. Consequently, this is meant for use with "bot trading" using the Alerts to automatically Open and Close positions.
I am using it with 3Commas to make trades on Bybit.
At the time of publishing, this is "Invite Only." I need to test it out over a range of time, conditions, chart time frames, pairs, etc... before opening it to the public.

Pivot Reversal Strategy - FIGS & DATES 2.0Simple Pivot Reversal Strategy with some adding settings.
Date Range: To test over specific market conditions.
Initial Capitol: $10K - This is a more realistic representation of funds used this strategy (for me anyway). The default of $100K can give different results (usually better) than when using a smaller balance.
Order Size: 100% Equity - These trend following strategies typically used this way, going all in each direction.
Commission: .075% - It's always disheartening to think you've found a ridiculously good setting, and then realize you forgot to add the commission.
All of these settings can be changed, but it's easier for me (and more fool proof) to have them set as default.

3rd High Low This is simple script to mark when higher high (or lower low) is made on continuously third day.
There likelihood of short term reversal next day. As usual, it is just likelihood and not certainty.

Trend Channel [Gu5]SMA 200 determines the trend
Bullish trend, green candles. Down trend, red candles.
If the market value is narrow to the SMA200 channel, yellow candles.
Setting recommended for SMA Range
BTCUSD = 100
EURUSD = 1000
SPX = 100
ETHUSD = 10
