Волатильность


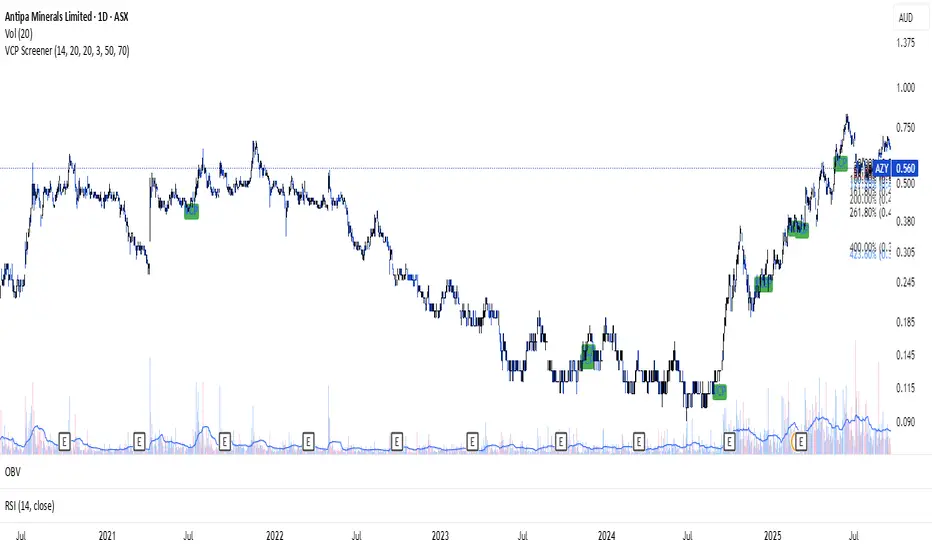
VCP ScreenerThis screener:
• Detect tight price contraction using ATR
• Check for volume contraction
• Confirm trend strength using moving averages
• Flag stocks near recent resistance
Session Liquidity Levels – Indicator for Smart Day Traders🧭 Session Liquidity Levels – Indicator for Smart Day Traders
Identify Key Market Liquidity Zones with Precision
The Session Liquidity Levels indicator automatically plots the most important market levels every day — giving you a clear view of where liquidity is building and where potential reversals or breakouts can occur.
This tool is designed for traders who rely on session structure and clean market levels rather than noise or lagging indicators.
⚙️ Features
✅ Asia Session High & Low – See the overnight range where liquidity starts building.
✅ London Session High & Low – Track the major volatility window and identify sweeps or fakeouts.
✅ Previous Day High & Low – Key reference points for continuation or reversal plays.
✅ Custom Colors & Styling – Personalize line colors and styles to fit your chart theme.
✅ Lightweight & Fast – Built in Pine Script v5 for smooth performance on all assets.
📊 How It Helps
Quickly visualize session highs/lows to plan liquidity grabs or breakout entries.
Mark daily structure without manually drawing lines.
Combine with your existing strategy to refine entry and exit timing.
Works on Forex, Indices, and Metals across all intraday timeframes.
⚡ Best For
Day traders who use session-based strategies (like Asia → London → New York transitions).
Traders studying liquidity sweeps, breakouts, or market structure shifts.
Anyone who wants a clean, automatic way to see session boundaries and key highs/lows.
🕌 Ethical Note
This indicator is 100% original, independently coded, and inspired by common trading concepts such as session ranges and daily structure.
It is not affiliated with or copied from any other paid indicators.
💰 Access
Available as an Invite-Only Script on TradingView.
Once purchased, you’ll receive access within 24 hours.
📩 Support
If you have any issues or want custom modifications (extra sessions, alerts, etc.), contact me directly — I’ll help you set it up.
Trade smarter. Stay disciplined. Let your levels guide you.

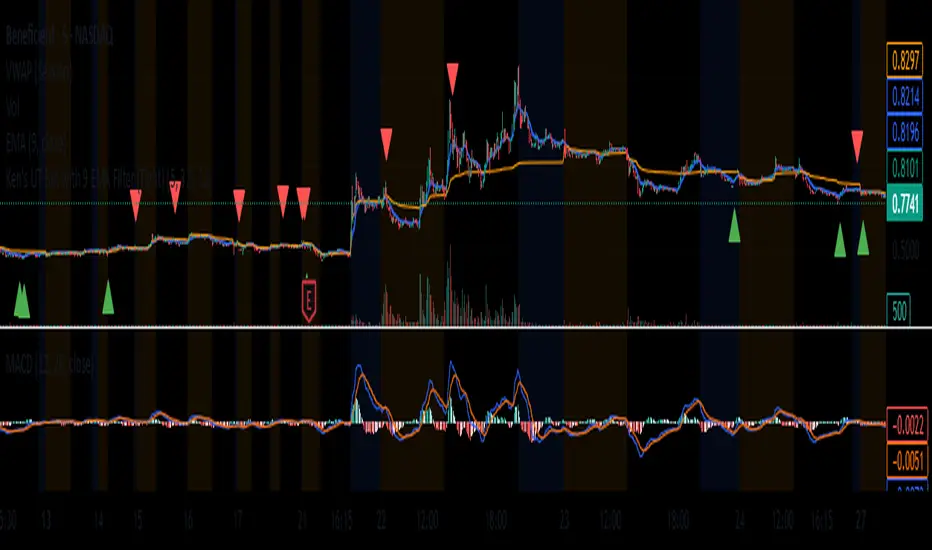
Inyerneck UT Bot with 9 EMA Filter With Signals (Tight) v: 4.20this script is a customized version of the UT bot, enhanced with 9ema trend filter for cleaner entries.designed for short term traders to reduce noise and avoid false signals during choppy price action. youll only see signals when price action confirms momentum aligned with trend as defined by EMA. try adjusting sensitivity and ATR period to your liking. my current setting is ATR 6,Sensitivity 3.8,EMA 9 to 11...
VIX/VVIX Spike RiskVIX/VVIX Spike Risk Analyzer
The VIX/VVIX Spike Risk Analyzer analyzes historical VIX behavior under similar market conditions to forecast future VIX spike risk.
By combining current VIX and VVIX levels as dual filters, it identifies historical precedents and calculates the probability and magnitude of VIX spikes over the next 1, 5, and 10 trading days.
IMPORTANT: This indicator must be applied to the VIX chart (CBOE:VIX) to function correctly.
Methodology
1. Dual-Filter Pattern Matching
The indicator uses both VIX and VVIX as simultaneous filters to identify historically analogous market conditions:
By requiring BOTH metrics to match historical levels, the indicator creates more precise market condition filters than using VIX alone. This dual-filter approach significantly improves predictive accuracy because:
VIX alone might be at 15, but VVIX can tell us if that 15 is stable (low VVIX) or explosive (high VVIX)
High VVIX + Low VIX often precedes major spikes
Low VVIX + Low VIX suggests sustained calm
2. Tolerance Settings
VIX Matching (Default: ±10% Relative)
Uses relative percentage matching for consistency across different VIX regimes
Example: VIX at 15 matches 13.5-16.5 (±10%)
Can switch to absolute tolerance (±5 points) if preferred
VVIX Matching (Default: ±10 Points Absolute)
Uses absolute point matching as VVIX scales differently
Example: VVIX at 100 matches 90-110
Can switch to relative percentage if preferred
3. Historical Analysis Window
The indicator scans up to 500 bars backward (limited by VVIX data availability) to find all historical periods where both VIX and VVIX were at similar levels. Each match becomes a "sample" for statistical analysis.
4. Forward-Looking Spike Analysis
For each historical match, the indicator measures VIX behavior over the next 1, 5, and 10 days
Display Metrics Explained
Average Highest Spike
Shows the average of the maximum VIX spikes observed.
Highest Single Spike
Shows the single largest spike ever recorded
Probability No 10% Spike
Shows what percentage of historical cases stayed BELOW a 10% spike:
Probability No 20% Spike
Shows what percentage of historical cases stayed BELOW a 20% spike:
Note : You'll see many more shaded bars than the sample count because each match creates up to 5 consecutive shaded bars (bars 1-5 after the match all "look back" and see it).
Short Volatility Strategies:
Enter when there's a LOW probability of big vol spikes based on today's metrics
Long Volatility Strategies
Enter when there's a HIGH probability of big vol spikes based on today's metrics

Inyerneck UT Bot 9 EMA V.sthis script is a custom ut bot signal generator using a 9 ema filter and atr based thresholds. it shows buy/sell signals based on crossover logic and works well for volitality based set ups. created by inyerneck
Tristan's Tri-band StrategyTristan's Tri-band Strategy - Confluence Trading System
Strategy Overview:
This strategy combines three powerful technical indicators - RSI, Williams %R, and Bollinger Bands - into a single visual trading system. Instead of cluttering your chart with separate indicator panels, all signals are displayed directly on the price chart using color-coded gradient overlays, making it easy to spot high-probability trade setups at a glance.
How It Works:
The strategy identifies trading opportunities when multiple indicators align (confluence), suggesting strong momentum shifts:
📈 Long Entry Signals:
RSI drops to 30 or below (oversold)
Williams %R reaches -80 to -100 range (oversold)
Price touches or breaks below the lower Bollinger Band
All three conditions must align during your selected trading session
📉 Short Entry Signals:
RSI rises to 70 or above (overbought)
Williams %R reaches 0 to -20 range (overbought)
Price touches or breaks above the upper Bollinger Band
All three conditions must align during your selected trading session
Visual Indicators:
(faint) Green gradients below candles = Bullish oversold conditions (buying opportunity)
(faint) Red/Orange gradients above candles = Bearish overbought conditions (selling opportunity)
Stacked/brighter gradients = Multiple indicators confirming the same signal (higher probability) will stack and show brighter / less faint
Blue Bollinger Bands = Volatility boundaries and mean reversion zones
Exit Strategy:
Long trades exit when price reaches the upper Bollinger Band OR RSI becomes overbought (≥70)
Short trades exit when price reaches the lower Bollinger Band OR RSI becomes oversold (≤30)
Key Features:
✅ Session Filters - Trade only during NY (9:30 AM-4 PM), London (3 AM-11:30 AM), or Asia (7 PM-1 AM EST) sessions
✅ No Repainting - Signals are confirmed on candle close for realistic backtesting and live trading
✅ Customizable Parameters - Adjust RSI levels, BB standard deviations, Williams %R periods, and gradient visibility
✅ Visual Clarity - See all three indicators at once without switching between panels
✅ Built-in Alerts - Get notified when entry and exit conditions are met
How to Use Effectively:
Choose Your Trading Session - For day trading US stocks, enable only the NY session. For forex or 24-hour markets, select the sessions that match your schedule.
Look for Gradient Stacking - The brightest, most visible gradients occur when both RSI and Williams %R signal together. These are your highest-probability setups.
Confirm with Price Action - Wait for the candle to close before entering. The strategy enters on the next bar's open to prevent repainting.
Respect the Bollinger Bands - Entries occur at the outer bands (price extremes), and exits occur at the opposite band or when momentum reverses.
Backtest First - Test the strategy on your preferred instruments and timeframes. Works best on liquid assets with clear trends and mean reversion patterns (stocks, major forex pairs, indices).
Adjust Gradient Visibility - Use the "Gradient Strength" slider (lower = more visible) to make signals stand out on your chart style.
Best Timeframes: 5-minute to 1-hour charts for intraday trading; 4-hour to daily for swing trading (I have also found the 3 hour timeframe to work really well for some stocks / ETFs.)
Best Markets: Liquid instruments with volatility - SPY, QQQ, major stocks, EUR/USD, GBP/USD, major indices
Risk Management: This is a mean reversion strategy that works best in ranging or choppy markets. In strong trends, signals may appear less frequently. Always use proper position sizing and stop losses based on your risk tolerance.
----------------------------------------------
Note: Past performance does not guarantee future results. This strategy is provided for educational purposes. Always backtest thoroughly and practice proper risk management before live trading.RetryClaude can make mistakes. Please double-check responses. Sonnet 4.5

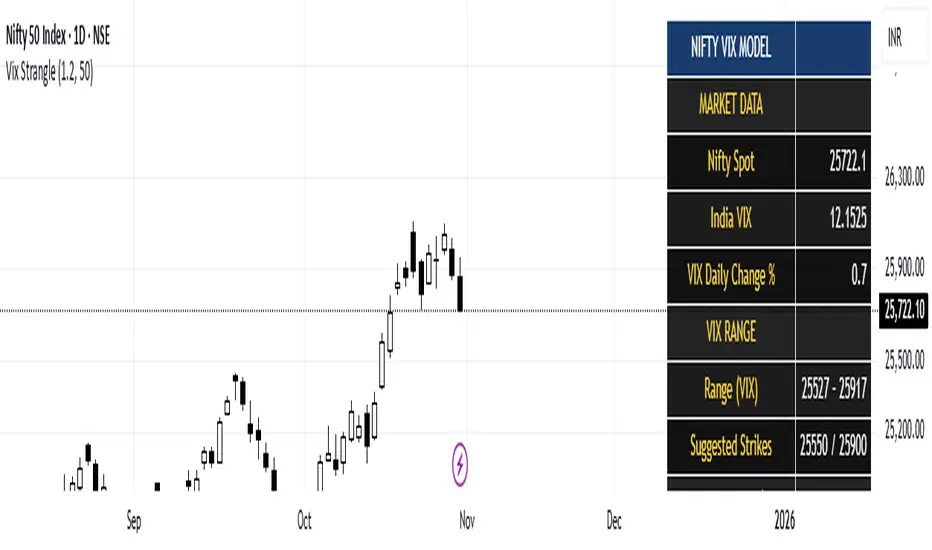
India Vix based Strangle StrikesA clean Nifty–VIX dashboard that converts India VIX into expected daily moves, price ranges, and suggested strangle strikes. Includes VIX %, expanded 1.2× range, and smart rounded strike levels for options trading.
This script provides a professional on-chart dashboard that converts India VIX into actionable trading levels for Nifty. It calculates the VIX-based expected daily move, projected price ranges, expanded 1.2× ranges, and suggested strangle strike prices. Includes clean formatting, color-coded sections, and real-time updates.
Ideal for traders using straddles, strangles, intraday volatility models, range-bound setups, and options-based risk management.
1.2x expanded range is better success probability, may keep 20% of strangle value as stop loss.
The vix based system is intended to give approx. 70%+ success rate.

VIX Regime AnalyzerVIX Regime Analyzer
The VIX Regime Analyzer is an analytical tool that examines historical VIX patterns to provide insights into how your asset typically performs under similar volatility conditions.
Key Features:
Historical Pattern Matching: Automatically scans up to 1,000 bars of history to find all periods when VIX was at levels similar to today, using customizable tolerance ranges (absolute or percentage-based).
Forward-Looking Statistics: For each VIX regime match, calculates what actually happened to your asset over the next 1, 5, 10, and 20 trading days, providing both average returns and probability of positive outcomes.
Regime Classification System: Intelligently categorizes the current market environment as bullish or bearish: Visual Historical Context:
Background shading throughout your chart highlights every historical period when VIX matched current levels, color-coded by subsequent performance (green for gains, red for losses).
User Inputs:
VIX Level Tolerance (+/-): How closely VIX must match (default: ±5 points)
Use Relative Tolerance (%): Switch to percentage-based matching for consistency across different VIX levels
Lookback Period: How many bars to analyze
Highlight Historical VIX Matches: Toggle background highlighting of past matching periods
The Data Table
The statistics box appears in the right handside of your chart and contains three main sections:
Section 1: VIX REGIME
Current VIX: The live VIX closing price
Range: The tolerance band being searched (e.g., if VIX is 18 with ±5 tolerance, range is 13-23)
Historical Samples: Number of matching periods found in the lookback window (minimum 10 required for statistical validity)
Section 2: FORWARD RETURN
Shows the average percentage change in your asset over different timeframes following similar VIX levels:
Avg Next Day: What typically happened by the next trading session
Avg Next 5 Days: Average 5-day forward performance
Avg Next 10 Days: Average 10-day forward performance
Avg Next 20 Days: Average 20-day forward performance (approximately 1 month)
Section 3: PROBABILITY UP
Shows the win rate - the percentage of times your asset closed higher after VIX matched current levels:
Next Day: Probability of being up the next session
Next 5 Days: Probability of being up after 5 days
Next 10 Days: Probability of being up after 10 days
Next 20 Days: Probability of being up after 20 days
Colors:
🟢 Green: Bullish regimes (various strengths)
🔴 Red: Bearish regimes (various strengths)
🟡 Yellow: Choppy/uncertain regime
When "Highlight Historical VIX Matches" is enabled:
Scroll back through your chart and you'll see colored backgrounds highlighting every period when VIX matched today's level. The color tells you whether that match led to gains (green) or losses (red). This provides instant visual pattern recognition - you can quickly see if similar VIX levels historically led to bullish or bearish outcomes.
Practical Example:
If you see that most historical periods with similar VIX levels are highlighted in green, it suggests the current VIX level has historically been a bullish signal for your asset.
How The Indicator Makes Decisions
The regime classification uses both magnitude AND probability to avoid false signals:
Example of Strong Classification:
Average 5-day return: +1.5%
Win rate: 65%
Result: STRONG BULLISH (both high return and high probability)
Example of Weak Signal:
Average 5-day return: +2.0%
Win rate: 35%
Result: CHOPPY (high average but low consistency = unreliable)
This dual-factor approach ensures the indicator doesn't mislead you with regimes that had a few huge winners but mostly losers, or vice versa.
Best Practices
Combine with your existing strategy: Use this as a regime filter rather than standalone signals
Check sample size: More historical matches = more reliable statistics
Consider multiple timeframes: If 5-day and 20-day metrics disagree, proceed with caution
Asset-specific tuning: Different assets may require different tolerance settings
VIX spikes: The indicator is particularly useful during VIX spikes to understand if panic is justified
What Makes This Different
Unlike simple VIX indicators that just plot the fear index, this tool:
Quantifies the actual impact of VIX levels on YOUR specific asset
Provides probability-based forecasts rather than subjective interpretation
Shows historical context visually so you can see patterns at a glance
Uses rigorous statistical criteria to avoid false regime classifications

RSI Exit + BB-RSI Combo📊 RSI Exit + BB-RSI Combo Indicator
This indicator combines RSI overbought/oversold exit signals with Bollinger Band re-entry conditions to highlight potential reversal or retracement zones.
1️⃣ RSI Exit Signal
- When RSI drops below 70 after being overbought → 🔴 "RSI" label
- When RSI rises above 30 after being oversold → 🟢 "RSI" label
- Works on 15m / 30m / 1h / 4h / 1D timeframes
2️⃣ BB-RSI Combo Signal
- When an RSI divergence forms and
- The candle body re-enters the Bollinger Band on 1H+ timeframe
→ Combo signal (💎 diamond) is shown
💡 How to Use
- Use RSI exit signals to spot overextension corrections
- Use combo signals to identify high-probability reversal or rebound setups
- Suitable for both swing and short-term trading

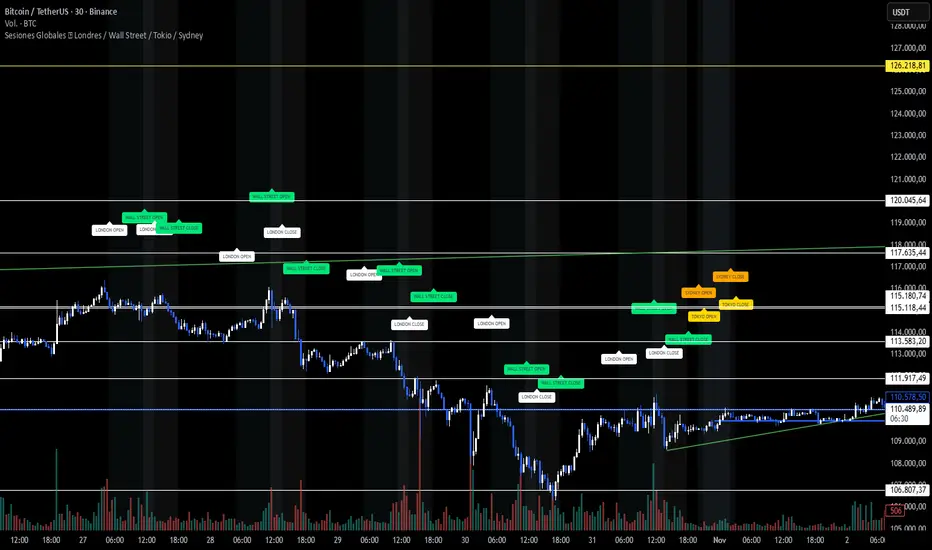
Sesiones Globales 🌍 Londres / Wall Street / Tokio / SydneyA clean visualization of the four main trading sessions — all shown in Argentina time (UTC−3) for easier global market tracking.
🕒 Sessions covered:
London 🇬🇧 — 05:00 to 13:30
Wall Street 🇺🇸 — 11:30 to 18:00
Tokyo 🇯🇵 — 21:00 to 03:00
Sydney 🇦🇺 — 20:00 to 02:00
✨ Features:
Soft background colors for each market session (non-intrusive and chart-friendly)
“OPEN” and “CLOSE” labels in matching session colors
Correct weekend handling — Tokyo and Sydney extend into early Saturday mornings (no false sessions shown)
Works on any asset — BTC, SP500, FX, or indices
Designed for dark charts and visual clarity
🎯 Why use it:
See where global liquidity overlaps, detect volatility zones, and plan your trades around real session activity — especially helpful for BTC and SP500 traders following institutional flow.
💡 Tip: All times are set to Argentina (UTC−3) by default. Adjust manually if you prefer another timezone.
NY VIX Channel Trend US Futures Day Trade StrategyNY VIX Channel Trend Strategy
Summary in one paragraph
Session anchored intraday strategy for index futures such as ES and NQ on one to fifteen minute charts. It acts only after the first configurable window of New York Regular Trading Hours and uses a VIX derived daily implied move to form a realistic channel from the session open. Originality comes from using a pure implied volatility yardstick as portable support and resistance, then committing in the direction of the first window close relative to the open. Add it to a clean chart and trade the simple visuals. For conservative alerts use on bar close.
Scope and intent
• Markets. Index futures ES and NQ
• Timeframes. One to thirty minutes
• Default demo. ES1 on five minutes
• Purpose. Provide a portable intraday yardstick for entries and exits without curve fitting
• Limits. This is a strategy. Orders are simulated on standard candles
Originality and usefulness
• Unique concept. A VIX only channel anchored at 09:30 New York plus a single window trend test
• Addresses. False urgency at session open and unrealistic bands from arbitrary multipliers
• Testability. Every input is visible and the channel is plotted so users can audit behavior
• Portable yardstick. Daily implied move equals VIX percent divided by square root of two hundred fifty two
• Protected status. None. Method and use are fully disclosed
Method overview in plain language
Take the daily VIX or VIX9D value, convert it to a daily fraction by dividing by square root of two hundred fifty two, then anchor a symmetric channel at the New York session open. Observe the first N minutes. If that window closes above the open the bias is long. If it closes below the open the bias is short. One trade per session. Exits occur at the channel boundary or at a bracket based on a user selected VIX factor. Positions are closed a set number of minutes before the session ends.
Base measures
Return basis. The daily implied move unit equals VIX percent divided by square root of two hundred fifty two and serves as the distance unit for targets and stops.
Components
• VIX Channel. Top, mid, bottom lines anchored at 09:30 New York. No extra multipliers
• Window Trend. Close of the first N minutes relative to the session open sets direction
• Risk Bracket. Take profit and stop loss equal to VIX unit times user factor
• Session Window. Uses the exchange time of the chart
Fusion rule
Minimum gates count equals one. The trade only arms after the window has elapsed and a direction exists. One entry per session.
Signal rule
• Long when the window close is above the session open and the window has completed
• Short when the window close is below the session open and the window has completed
• Exit on channel touch. Long exits at the top. Short exits at the bottom
• Flat thirty minutes before the session close or at the user setting
Inputs with guidance
Setup
• Use VIX9D. Width source. Typical true for fast tone or false for baseline
• Use daily OPEN. Toggle for sensitivity to overnight changes
Logic
• Window minutes. Five to one hundred twenty. Larger values delay entries and reduce whipsaw
• VIX factor for TP. Zero point five to two. Raising it widens the profit target
• VIX factor for SL. Zero point five to two. Raising it widens the stop
• Exit minutes before close. Fifteen to ninety. Raising it exits earlier
Properties visible in this publication
• Initial capital one hundred thousand USD
• Base currency USD
• request.security uses lookahead off
• Commission cash per contract two point five $ per each contract. Slippage one tick
• Default order size method FIXED with value one contract. Pyramiding zero. Process orders on close ON. Bar magnifier OFF. Recalculate after order is filled OFF. Calc on every tick ON
Realism and responsible publication
No performance claims. Past results never guarantee future outcomes. Fills and slippage vary by venue. Shapes can move while a bar forms and settle on close. Strategy uses standard candles.
Honest limitations and failure modes
Economic releases and thin liquidity can break the channel. Very quiet regimes can reduce signal contrast. Session windows follow the exchange time of the chart. If both stop and target can be hit within one bar, assume stop first for conservative reading without bar magnifier.
Works best in liquid hours of New York RTH. Very large gaps and surprise news may exceed the implied channel. Always validate on the symbols you trade.
Entries and exits
• Entry logic. After the first window, go long if the window close is above the session open, go short if below
• Exit logic. Long exits at the channel top or at the take profit or stop. Short exits at the channel bottom or at the take profit or stop. Flat before session close by the configured minutes
• Risk model. Initial stop and target based on the VIX unit times user factors. No trail and no break even. No cooldown
• Tie handling. Treat as stop first for conservative interpretation
Position sizing
Fixed size one contract per trade. Target risk per trade should generally remain near one percent of account equity. Risk is based on the daily volatility value, the max loss from the tests for one year duration with 5min chart was 4%, while the avg loss was below <1% of the total capital.
If you have any questions please let me know. Thank you for coming by !

True Range + Average True Range (Status Line Only)This simple yet powerful indicator displays True Range (TR) and Average True Range (ATR) values directly in your TradingView status line, without cluttering your chart.
It’s designed for traders who want to quickly monitor volatility and price range expansion in real time.
⚙️ Features:
Real-time updating TR & ATR values
Clean and minimal — no chart clutter
Customizable ATR length and smoothing method (RMA, SMA, EMA, WMA)
Works on all timeframes and symbols
📈 Use Cases:
Monitor volatility changes during trading sessions
Confirm breakout strength or volatility contraction
Combine with price action or volume-based setups

VTTOS — Volatility & Trend Transition OscillatorShort Description (one-line summary)
Displays volatility-based trend transitions using EMA relationships and adaptive percentile thresholds.
Full Description
Overview
A framework for studying volatility transitions and market phase shifts through adaptive EMA relationships.
VTTOS (Volatility & Trend Transition Oscillator System) is a technical-analysis framework that displays market behavior through volatility dynamics and EMA-based motion.
It is designed to support technical analysis and enhance market context interpretation.
VTTOS uses percentile thresholds derived from past volatility ranges to help identify transitions between trending and ranging market phases.
The indicator is built for traders who prefer to interpret market structure through volatility expansion and contraction, using clear visual markers to highlight possible sequence changes.
________________________________________
What Makes This Script Distinct
VTTOS applies adaptive percentile thresholds calculated from recent Tug Line and Tanker Line movements.
These thresholds automatically adjust based on recent data, allowing the plotted tags to represent potential market phases dynamically.
The focus is not on the EMA lines themselves, but on how price interacts relative to the percentile thresholds.
This integrated approach provides a structured volatility-based framework for contextual analysis.
________________________________________
Core Components
• Tug Line – Represents relative volatility derived from smoothed EMA relationships.
• Tanker Line – A slower baseline signal reflecting broader directional pressure.
• Threshold Bands – Adaptive percentile levels computed from recent pivot ranges.
• Sequence Markers – Numbered, colored labels that display phase progressions within the current trend.
• Multi-Market Compatibility – Can be applied to any asset or timeframe.
________________________________________
How to Read It
• When the Tug Line crosses above or below the percentile thresholds, the oscillator enters a new phase.
• Colored sequence labels display ongoing trend transitions (e.g., blue → orange → green for uptrends, purple → orange → green for downtrends).
• Opposite-side conditions automatically reset sequences to maintain clarity during volatile periods.
________________________________________
Usage Notes
• VTTOS does not generate trade entries, exit signals, or financial recommendations.
• Red or green labels only display possible late-phase conditions within a trend.
• X labels indicate when the oscillator crosses the zero line, visually marking a potential phase transition.
• All visuals are intended for analytical and educational purposes only.
• Users are encouraged to integrate VTTOS within their own analytical or confirmation framework.
• Numerical labels are iterative and do not carry standalone predictive meaning.
• The distance between the Tanker Line and percentile bands can help display relative trend strength visually, but it should not be interpreted as a forecast or signal.
________________________________________
Access
This is an invite-only script.
Access is restricted to users who have been granted permission by the author.
To request access, please use the standard “Request access” button on the indicator’s TradingView page.
Approved users will find the indicator under Invite-only scripts in the TradingView Indicators panel.
________________________________________
Disclaimer
VTTOS is provided strictly for informational and educational purposes.
It does not constitute financial advice, investment guidance, or performance assurance.
All users should conduct independent analysis and manage their own risk responsibly.
