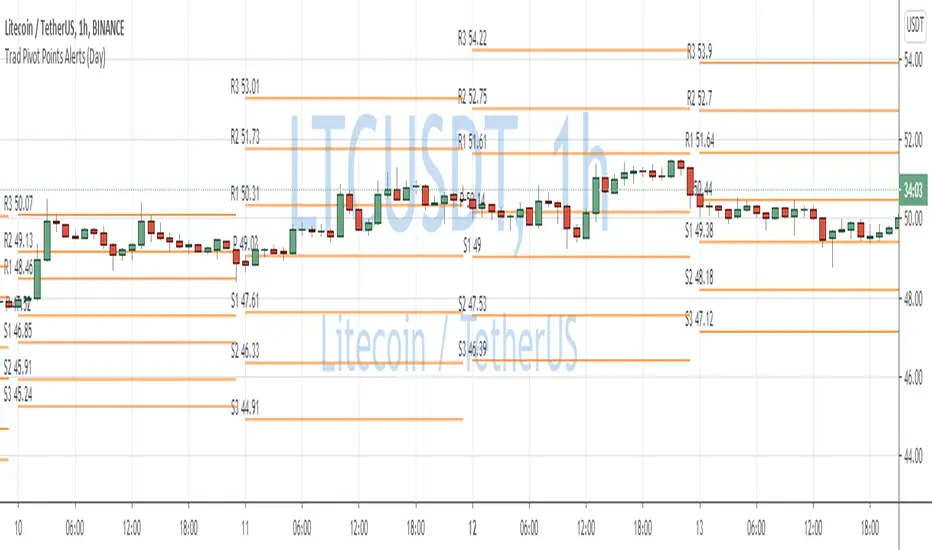
Traditional Pivot Points AlertsCreated a script for alerts on Traditional Pivot Points.
You will be able to create separate alerts for every level or create one for price crossing any level.
Because of some TradingView limitations, alerts won't be fired for the first bar of the session. Will try to solve that in the new versions.
In the script used new v4 plotting features, so will be able to plot levels and labels nicely. Unfortunately, there is a limit on the number of consecutive lines you can plot on the plot (around 50), so lines in the past will disappear.
You can enable/disable in params displaying level itself on the chart.
And remember:
Past performance does not guarantee future results.
Поиск скриптов по запросу "pivot"
Swing Pivots - Market Structure High Low [zazenio]What is Market Structure?
Market structure is simply the pattern of highs and lows that price creates as it moves. When you look at any chart, you'll notice price doesn't move in a straight line — it swings up, pulls back, swings up again (in an uptrend), or the opposite in a downtrend.
These swing points — the peaks and valleys — are what traders call pivots. Identifying them correctly is the foundation of understanding where a market has been and where it might go next.
What This Indicator Does
Swing Pivots automatically marks these peaks and valleys on your chart so you don't have to draw them manually. It works on any market — stocks, crypto, forex, futures, indices — and on any timeframe.
How Pivots Are Detected
This indicator confirms pivots based on price structure, not a fixed bar count.
Here's how it works:
A swing high is confirmed when price breaks below the previous swing low. At that moment, we know the high was real — price tried to go higher, failed, and reversed. The market "proved" that level was a genuine turning point.
A swing low is confirmed when price breaks above the previous swing high. The same logic applies — price tried to go lower, failed, and reversed direction.
This creates a natural alternation: high, low, high, low. Each pivot is validated by the market's actual behavior, not by waiting for an arbitrary number of bars to pass.
Why This Matters
Most pivot indicators use a "lookback" method — they wait for a certain number of bars (say, 5 or 10) on each side of a candle before confirming it as a pivot. This creates a fixed delay. By the time the pivot appears on your chart, price has already moved on.
This indicator doesn't wait. It confirms pivots the moment price structure proves them. The result is pivots that align with how traders actually read charts — based on breaks of structure, not arbitrary countdowns.
Settings
Swing Width: Controls how sensitive the detection is. Higher numbers show only major swings; lower numbers capture smaller moves within the structure.
Style/Size/Colors: Customize how the pivot markers look on your chart.
Use Cases
See the "skeleton" of price action at a glance
Identify potential support and resistance levels
Understand if the market is trending or ranging
Build a foundation for more advanced concepts like Break of Structure (BOS) and Change of Character (CHoCH)
⸻
Disclaimer:
This script is provided for educational and informational purposes only. It is not financial advice and does not constitute a recommendation to buy or sell any financial instrument. Always do your own research and trade at your own risk.

Next Pivot Projection [Trendoscope]Still experimental. Extending further on the divergence backtest results - in this script we try to project next 2 pivots (including one unconfirmed pivot)
🎲 Previous experiments
1. Divergence-Backtester
2. Divergence-Backtester-V2
🎲 Additions
Apart from collecting the stats on number of occurrences of HH, HL, LH, LL - this script also keeps track of average ratio for each levels and average bars.
Based on these data, we try to calculate the next pivot projections including possible bar and price.
Cloud covering the candles indicate historical levels of average HH, HL, LH, LL projections.
Hover on projection labels to find more details in tooltips.
🎲 Overall method in a nutshell
🎲 Going bit deeper
🎯 Unconfirmed Pivot and its projection - Last pivot of the zigzag is always unconfirmed. Meaning, it can potentially repaint based on further price movements. But, projection of the unconfirmed pivot will not change as it will be based on previous two pivots - both of which are confirmed.
🎯 Next Pivot Projection - Next pivot is projected based on last two pivots - which include last unconfirmed pivot. Hence, these projections can potentially repaint based on the last pivot repaint.
🎯 Historical projections displayed as cloud - Historical projection values are displayed as cloud around pivots.
A cloud above represents area from average lower high range to average higher high range. Cloud color is green if average ratio of pivot high is more than 1. Red Otherwise.
A cloud below represents area from average higher low range to average lower low range. Cloud color is red if average ratio of pivot high is more than 1. Green otherwise

Donchian Channel - Pivot High-LowCombining Pivot High Low and Donchian Channel - both of which are useful indicators for trend following.
Donchian Channel shows highest and lowest prices for X number of bars.
Pivot High-Low identifies when price made new Highs and Lows
Applying Donchian Channel on Pivot High-Low channel, we are plotting highest and lowest pivots formed in X bars.
In this indicator, we have 3 options for Channel Base :
Price : This is regular Donchian channel based on High-Low Price
Pivots : This is Donchian channel based on pivot points.
Combined : Combines both. Takes highest of Price and Pivots for plotting high, lowest of Price and Pivots for plotting low

RSI Pivot Breaks█ OVERVIEW
RSI Pivot Breaks is an RSI-based indicator that detects breakout events on oscillator-based pivot levels (RSI or MA RSI).
The tool automatically plots pivot levels, tracks their breakouts, highlights momentum shifts, and generates alerts for key events (pivot breaks and OB/OS crosses).
The indicator is designed primarily for momentum strategies — pivot breakouts often precede directional price moves, making RSI Pivot Breaks a powerful tool for identifying accelerations and changes in strength.
█ CONCEPTS
The indicator analyzes local RSI extremes and transforms them into dynamic support/resistance levels.
When RSI or MA RSI breaks the last pivot, it signals a shift in momentum balance, often leading to an impulse move.
Key concepts:
- pivot highs/lows detected on RSI or MA RSI,
- pivot lines extend forward until broken,
- pivot filters restrict pivot detection to specific RSI zones,
- OB/OS levels provide contextual momentum thresholds.
█ FEATURES
Pivot Detection & Breakouts
- Detection of pivot highs and lows on RSI or MA RSI.
- Pivot filters allow you to limit pivot detection to specific RSI ranges (e.g., only bullish pivots below 50 or bearish pivots above 50).
- Pivot lines update automatically after breakout.
Background highlights:
- green on pivot-high breakouts,
- red on pivot-low breakouts.
RSI & MA RSI
- Dynamic RSI colors based on momentum direction.
- Optional MA RSI line (SMA/EMA/RMA/WMA) usable as a smoother pivot source.
OB / OS Zones
- Fully adjustable overbought/oversold levels.
- Dedicated OB/OS colors.
- Optional gradient backgrounds.
Highlights
- Instant identification of moments when RSI breaks a key pivot level.
Alerts:
- pivot high breakouts.
- pivot low breakouts.
- OB crosses.
- OS crosses.
█ HOW TO USE
Add the indicator:
Indicators → RSI Pivot Breaks.
RSI Settings
- RSI Length – core RSI period.
- RSI MA Length & Type – MA RSI smoothing parameters.
Pivot Settings
- Pivot Left / Pivot Right – number of bars required to form a pivot and also the number of bars of delay before the pivot becomes confirmed.
(Higher values produce more reliable but slower pivots.)
Pivot Filters
- Minimum/maximum allowed RSI levels for pivot Highs and Lows.
- Examples:
- detect only pivot Highs at low RSI values.
- ignore pivots during extreme momentum.
- allow only mid-range pivot detection depending on strategy.
Visualization
- Toggles for RSI and MA RSI visibility.
- Optional gradients.
- Full color and transparency customization.
OB/OS Levels
- Adjustable thresholds depending on instrument volatility and strategy style.
█ SIGNAL INTERPRETATION
BUY
- RSI breaks the latest pivot high.
- RSI crosses upward out of OS.
- Context example: pivot lows forming a rising sequence.
SELL
- RSI breaks the latest pivot low.
- RSI drops downward from OB.
- Context example: pivot highs forming a declining sequence.
Trend / Momentum
- Pivot breakouts indicate acceleration or continuation of momentum.
- MA-based pivots provide smoother and more stable momentum structure.
█ APPLICATIONS
- Momentum Trading – pivot breaks as early acceleration signals.
- Scalping & Intraday – fast RSI pivots react quickly to short-term shifts.
- Swing Trading – smoother pivots using MA RSI for higher-timeframe structure.
- Divergence Detection – pivot behavior helps reveal divergence patterns, e.g.:
- RSI pivots rising while price is falling → potential early momentum reversal.
- Custom Filtering – pivot filters allow, for example:
- blocking bullish signals near OB.
- blocking bearish signals near OS.
- detecting pivots only above/below mid-range during strong trends,
depending entirely on strategy design.
█ NOTES
- Pivot detection includes natural delay equal to the Left/Right parameters.
- Pivot filters significantly change the character of signals, allowing fine-tuning of aggressiveness for any strategy.

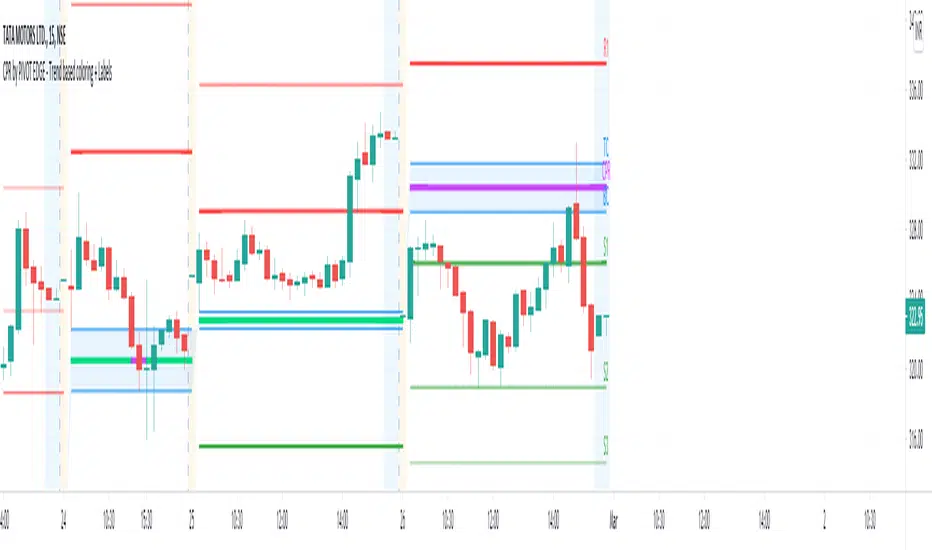
CPR by PIVOT EDGE - Trend based coloring + LabelsIntroduction to the Indicator " CPR by PIVOT EDGE - Trend based coloring + Labels "
The Foundation layout for this indicator is based on PIVOT's which are nothing but the most important levels that the price has respected in the past.The values for the pivots are derived from the key attributes of the price in any timeframe such as the OPEN, HIGH, LOW and CLOSE. These define the mood of the price and where it intends to move in relation to the previous range formed.Earlier HIGH - LOW i.e the RANGE indicates the possible movement that a stock can make in the current session and as per the calculated pivots we can possible find out the tentative supports and resistances. In addition to this indicator, It is advisable to use the price action theory which helps in taking a right decision for entries.
This indicator by itself is complete in nature, i.e it guides the user for possible entry levels and the projected targets that we can achieve and also the likely stop loss limit in case the price reverses. So beforehand even before entering into a trade position, the user can ascertain what can be his loss or max profit and then he can chose an optimum position size for favorable results.
The beauty of this Indicator lies in the fact that it can be used for all types of trading like Scalping, Intra day, Swing or Positional and Investments also. It works on all timeframes and across all market segments like EQUITY, COMMODITIES , FUTURES , OPTIONS , FOREX etc.
This indicator can be used for any exchange and any timezone also without any changes or adjustments needed.
Now let us understand the features of this Indicator in detail.
TIMEFRAME - It has options to choose between Day,week and month as timeframe. By default it is set to Day timeframe
DISPLAY CPR BAND - This displays the CPR range that consists of Pivot, TC and BC. This Band or Range is the core of this indicator and this givesa detailed information about the tentative range and momentum of the market for the present period
as well a prediction for next session and also can tell you the history of its pior period. This level acts as both support and resistance based on the direction of the trend. The unique feature built in this indicator is that
the Pivot changes its color based on the trend in the market and by looking at the color of the pivot itself you can make out what the current trend in the market is.
DISPLAY SUPPORT RESISTANCE - This indicates the important support and resitance levels for the day which is derived from the price details of prior period that is based on HIGH / LOW / CLOSE of prior period.
DISPLAY PREVIOUS HIGH / LOW / CLOSE - I have included Daily / Weekly and monthly levels. It is important to know the earlier highs / lows and close since price respects it very must just like support and resistance.
DISPLAY TOMORROW CPR - This displays the CPR band and support / resistance for tomorrow.It give an advance information of tomorrows trend and momentum today itself if you study the CPR concepts you can be prepared for tomomorrows market and can very well know in advance if it will be a sideways market or a trending day.
MINOR TREND - This displays a combination of 2 moving averages. By default I have coded for 20 and 50 period which can be modified as per your needs. These 2 moving averages depicts the prevailing minor trend in the market and you can take decision to enter trade based on this trend projection.
For users ease, I have conditionally coded the moving average curves and also the background color to depict the present trend i.e red denoted bearish trend and green denoting bullish trend. The colors change automatically based on the change in price behaviour.
MAJOR TREND - This displays the prevailing major trend in the market and I have used as 200 period moving average by default which you can change to suit your needs. You can check the major trend of the market by using higher timeframes above 1Hr.
IMPORTANT NOTE : This indicator does not guarantee any favorable results nor protect your from any loss. You own the complete risk of your trades. It is suggested that you use this indicator and do back testing for considerable period to understand how it works the the potential win rate it can give.
If you have any doubts or need any clarifications of assistance in understanding, you can message me and i will try to help.
I will soon try to make a Video and explain the use of this indicator for better clarity and understanding.
Happy and Safe trading - Mohan from PIVOT EDGE
[ALL-IN-ONE] Algorithmic S/R and Pivots and Long Term LevelsHello my trading padawans.
Hope you're all having a blast
Here's the invite-only script of the week. The ALL-IN-ONE saga continues with another script.
This time, I compiled a lot of algorithmic supports and resistances (S/R) - to be used with any indicators out there.
Those S/R are universal and work with all asset classes (FOREX, CRYPTO, INDICES, STOCKS, COMMODITIES, ...)
No one can predicts which S/R will stop a move - generally - the high timeframes S/R + the SMAs with a big input value - work as strong walls often forcing the candles to retrace a bit short-term.
At Today's post (October, 25th 2019 - 12 pm UTC-4), we see how useful they were, to identify how high BTC/USD could go before retracing.
I. 💎 SCRIPTS ACCESS 💎
1.🖐️ Access can only be requested through my website.
2.🖐️ My website URL is in this script signature at the very bottom (you'll have to scroll down a bit and going past the long description) and in my profile status available here : Daveatt
3.🖐️ A tutorial article/video will be provided on those sub mentioned links + Tradingview
4.🖐️ You obviously can contact me directly for more information
II. 🔎 ALL-IN-ONE Supports and Resistances 🔎
You can display the algorithmic S/R, and/or pivots, (not finished yet) and the long terms levels.
For the 3 types of S/R, I pre-selected those that I think are the most relevant and useful for everyone. Please let me know if you'd like me to add/remove some.
All those listed by default are important and provide a MAP for a trader.
They give great take profits zones, levels where it's better to wait for a pullback before entering.
2.1 👁️🗨️ S/R mode 👁️🗨️
Each type of S/R can be displayed or not.
2.2 📱 Mobile optimized display 📱
Preview : imgur.com I posted 2 images there
The script is made using the newest version of Pinescript, and displaying small labels for every support/resistance.
✨ This will come in handy for mobile users - they'll get nice looking labels displayed at the right of their chart.
Each S/R type have its own labels and label position. The script users can activate/deactivate them at will
Let's review quickly each one.
2.3 Algorithmic SMAs
I cherish, love, sometimes despite them, but they're very relevant for all asset classes. The tool displays as many relevant algorithmic and generic SMAs that I could think of.
The indicator lists about 18 different SMAs in multiple timeframes.
2.4 Pivots
7 pivots are displayed (S1/S2/S3/P/R1/R2/R3)
You can choose one of 4 pivot point types:
- Traditional
- Woodie
- Fibonacci
- Camarilla.
The fun doesn't stop here. You can also select a timeframe between Daily/Weekly/Monthly/Yearly for those pivots.
For INDICES, for example, I use a lot the daily Traditional Pivots.
2.5 Long Terms Levels
Display by default the highest/lowest weekly/monthly/quarterly/monthly levels.
The scripts user can chose to select the previous highest/lowest also.
-------------------------------------------------------------------------------------------------------------------------------------
If you have any doubts or questions, please hit me up directly or ask in the comments section of this script.
I'll never claim I have the best trading methodology or indicators.
You only will judge and I'll appreciate all the questions and feedback you're sending my way.
They helped me a ton for developing indicators based on all the requests I received.
May the force 💪 be with you all 🥳.
Dave

Daily Dual Pivots (Std + Fib) Extended by Jackel
簡介: 這個指標旨在為日內交易者提供最強大的支撐與阻力參考。它將市場上最常用的兩種 Pivot Points 計算方式——標準 (Standard) 與 斐波那契 (Fibonacci)——結合在同一個圖表中,讓你一眼就能看出關鍵的價格匯聚點 (Confluence Areas)。
主要特色:
雙重系統並存:
標準 Pivot (Standard):以 實線 (Solid Lines) 顯示。這是機構與大部分交易者使用的傳統支撐阻力位。
斐波那契 Pivot (Fibonacci):以 圓點/虛線 (Dotted Lines) 顯示。利用 Fib 黃金比例 (0.382, 0.618) 計算出的潛在反轉位。
清晰的視覺區分:標準版使用暖色系 (紅/綠/橙),Fib 版使用冷色系 (藍/紫),互不干擾,清晰易讀。
可選擴展關卡 (S4-S5 / R4-R5):預設顯示 P, R1-R3, S1-S3。如果市場波動劇烈,你可以在設定中開啟 "Show Extra Levels" 來顯示 R4/R5 及 S4/S5。
自動隱藏歷史:預設只顯示「當日」的線條,保持圖表整潔。如需回測,可開啟「顯示歷史數據」選項。
如何使用:
當 實線 (Standard) 與 虛線 (Fib) 重疊或非常接近時,該區域通常具有更強的支撐或阻力效力。
適用於 15分鐘、1小時或 4小時圖表操作日內交易。
Introduction: This indicator is designed for intraday traders who need precise Support & Resistance levels. It combines the two most popular Pivot Point calculation methods—Standard (Traditional) and Fibonacci—into a single chart, allowing you to easily identify key areas of confluence.
Key Features:
Dual System Strategy:
Standard Pivots: Displayed as Solid Lines. These represent the traditional structural levels used by most traders and institutions.
Fibonacci Pivots: Displayed as Dotted/Circle Lines. These use key Fibonacci ratios (0.382, 0.618) to identify potential reversal zones.
Visual Clarity: Different line styles and color groups allow you to distinguish between Standard and Fib levels instantly without chart clutter.
Extended Levels (Optional): By default, it shows P, R1-R3, and S1-S3. In highly volatile markets, you can enable "Show Extra Levels" in the settings to reveal S4/S5 and R4/R5.
Clean Chart: By default, it only shows levels for the current day. You can enable "Show History" in the settings if you need to backtest.
How to Use:
Look for Confluence: When a Solid Line (Standard) and a Dotted Line (Fib) overlap or are very close to each other, it indicates a very strong Support or Resistance zone.
Best used on 15m, 1H, or 4H charts for intraday analysis.

Rally Base Drop SND Pivots [LuxAlgo]The Rally Base Drop SND Pivots indicator uses "Rally", "Base", and "Drop" Candles to determine pivot points at which supply and demand (SND) levels are drawn.
🔶 USAGE
Rally, Base, and Drop (RBD) candles create a formula for seeing market structure through a fixed methodology. We are able to use this concept to point out pivot areas where Rallies and Drops directly meet.
The RBD SND Pivots are similar to traditionally identified "fractal" pivot points, with one key difference.
RBD SND Pivots detect a specific number of Rally and Drop candles directly back-to-back, requiring one side of the pivot to contain entirely green candles and the other to be entirely red candles or vice versa.
Since these pivot levels are based on Rally, Base, and Drop candles, the method directly implements rigid logic to further structure a trading system when utilizing these pivot levels with traditional SND concepts.
Furthermore, by implementing this logic when looking for pivots, a significant portion of potential noise is naturally filtered out.
🔶 DETAILS
In typical SND systems, the term "Base" is used for multiple meanings.
In this indicator, the base is a product of a pivot being formed. Once a Pivot is identified, the "Base" is marked as the first Rally or Drop of the second half of the pivot formation.
Once the pivot is identified, the high or low of the base candle is used to measure the pivot level.
🔶 SETTINGS
Length: Sets the number of Rally and Drop Candles that the script will require to identify pivots.
Ex. "3" = 3 Rally followed by 3 Drop
Historical Lookback: Hides historic levels based on a bar # Lookback from the current bar.
When set to 0, all Levels will display. (0 by default)

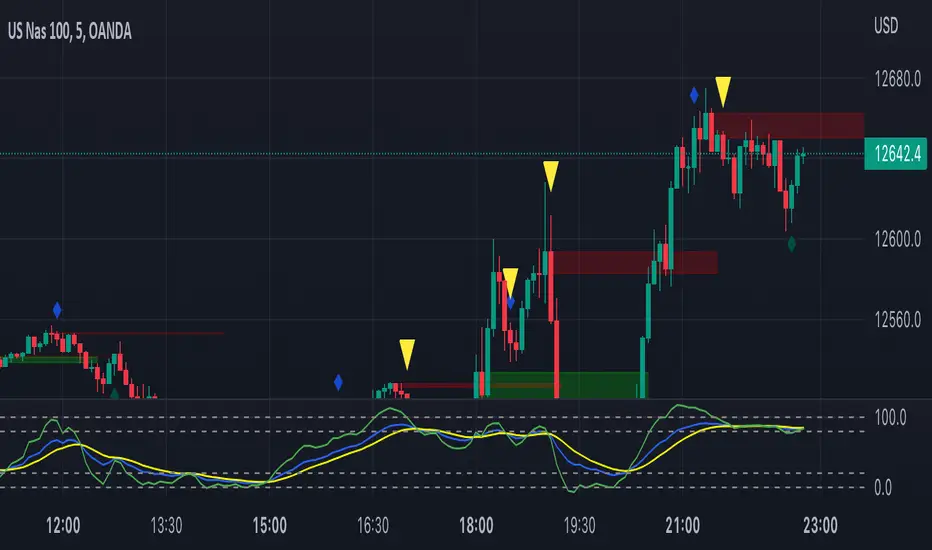
TRSI AND PIVOT STRATEGYThis is TRSI and Pivothigh and Pivotlow combined indicator.
TRSI itself generates signals when crossing 30/70 or 20/80 levels (as per your choice) to buy or to sell accordingly.
These crossing levels are marked on the chart with triangles and their direction.
The channel you see on the chart is based on high and low pivots, by defauld 4 bars left and 2 bars right.
How to use the channel:
The best signal is generated when price crosses the channel up or down and TRSI crosses 30/70 or 20/80 level confirming the price movement. The crossing points of price and the channel are marked with blue and red crossess.
You can use the channel to trade within it with TRSI confirmation, as price usually bounces from the levels.
Best timeframes are 15 min and 1 hour.

Market Structure Pivots with BOS & CHoCH [zazenio]What is Market Structure?
Market structure is simply the pattern of highs and lows that price creates as it moves. When you look at any chart, you'll notice price doesn't move in a straight line — it swings up, pulls back, swings up again (in an uptrend), or the opposite in a downtrend.
These swing points — the peaks and valleys — are what traders call pivots . Identifying them correctly is the foundation of understanding where a market has been and where it might go next.
What This Indicator Does
Swing Pivots automatically marks these peaks and valleys on your chart so you don't have to draw them manually. It works on any market — stocks, crypto, forex, futures, indices — and on any timeframe.
Beyond just marking pivots, this indicator also draws BOS (Break of Structure) and CHoCH (Change of Character) lines — two essential concepts that help you understand when a trend is continuing or potentially reversing.
How Pivots Are Detected
This indicator confirms pivots based on price structure, not a fixed bar count.
Here's how it works:
A swing high is confirmed when price breaks below the previous swing low. At that moment, we know the high was real — price tried to go higher, failed, and reversed. The market "proved" that level was a genuine turning point.
A swing low is confirmed when price breaks above the previous swing high. The same logic applies — price tried to go lower, failed, and reversed direction.
This creates a natural alternation: high, low, high, low. Each pivot is validated by the market's actual behavior, not by waiting for an arbitrary number of bars to pass.
Understanding BOS and CHoCH
Once you can identify pivots, the next step is understanding what happens when price breaks through them. This is where BOS and CHoCH come in.
BOS (Break of Structure)
A Break of Structure occurs when price continues in the direction of the current trend by breaking a previous pivot level.
In an uptrend : Price breaks above a previous swing high → This signals strength. Buyers are pushing price to new highs, and the trend is likely to continue.
In a downtrend : Price breaks below a previous swing low → This signals weakness. Sellers are pushing price to new lows, and the trend is likely to continue.
Think of BOS as the market saying "the trend is still intact." Each BOS confirms that the dominant side (buyers or sellers) remains in control.
CHoCH (Change of Character)
A Change of Character occurs when price breaks a pivot level in the opposite direction of the current trend. This is an early warning signal that the trend may be reversing.
In an uptrend : Price breaks below a previous swing low → This is unexpected. In a healthy uptrend, lows should hold. When they don't, it suggests buyers are losing control and sellers may be taking over.
In a downtrend : Price breaks above a previous swing high → This is unexpected. In a healthy downtrend, highs should hold. When they don't, it suggests sellers are losing control and buyers may be stepping in.
Think of CHoCH as the market's behavior "changing character" — it's no longer acting the way it should if the trend were healthy.
Why BOS and CHoCH Matter
These concepts give you a framework for reading what the market is actually doing:
BOS tells you the trend is continuing — stay with it or look for entries in that direction
CHoCH warns you the trend may be ending — time to be cautious, take profits, or look for trades in the new direction
By visualizing these breaks directly on your chart, you don't have to guess. You can see at a glance whether the market is trending smoothly (consecutive BOS) or showing signs of reversal (CHoCH).
Why This Approach Works
Most pivot indicators use a "lookback" method — they wait for a certain number of bars (say, 5 or 10) on each side of a candle before confirming it as a pivot. This creates a fixed delay. By the time the pivot appears on your chart, price has already moved on.
This indicator doesn't wait. It confirms pivots the moment price structure proves them. The result is pivots that align with how traders actually read charts — based on breaks of structure, not arbitrary countdowns.
Settings
Configuration
Swing Width : Controls how sensitive the detection is. Higher numbers show only major swings; lower numbers capture smaller moves within the structure.
Pivot Settings
High/Low Color : Customize the colors of swing high and swing low markers
Style : Choose between Triangle or Circle markers
Size : Adjust the size of pivot markers (Auto, Tiny, Small, Normal)
Structure Lines
Show CHoCH : Toggle Change of Character lines on/off
CHoCH Color : Customize the color of CHoCH lines
CHoCH Label : Show/hide the "CHoCH" text label
Show BOS : Toggle Break of Structure lines on/off
BOS Color : Customize the color of BOS lines
BOS Label : Show/hide the "BOS" text label
Use Cases
See the "skeleton" of price action at a glance
Identify potential support and resistance levels
Understand if the market is trending or ranging
Spot trend continuations with BOS lines
Catch early reversal signals with CHoCH lines
Build a foundation for more advanced trading strategies
━━━━━━━━━━━━━━━━━━━━━━
Version History
v1.1
Added BOS (Break of Structure) lines to visualize trend continuation
Added CHoCH (Change of Character) lines to identify potential trend reversals
Added toggle options for BOS and CHoCH visibility
Added customizable colors for structure lines
Added optional labels for BOS and CHoCH
v1.0
Initial release
Automatic swing high and swing low detection
Structure-based pivot confirmation (not fixed lookback)
Customizable pivot markers (style, size, colors)
Adjustable swing width sensitivity
━━━━━━━━━━━━━━━━━━━━━━
Disclaimer:
This script is provided for educational and informational purposes only. It is not financial advice and does not constitute a recommendation to buy or sell any financial instrument. Always do your own research and trade at your own risk.

Confirmed Pivots + MACD Signals (with BOS Lines)Confirmed Pivots + MACD Signals
This indicator combines confirmed swing highs/lows (pivots) with MACD-based momentum signals to highlight key reversal and continuation points on the chart.
Core Logic
Confirmed Pivots:
The script identifies swing highs and lows using the user-defined pivot confirmation length.
Once a structure is broken beyond the last pivot, that level becomes a confirmed support (CL) or resistance (CH) line.
These levels are plotted as dashed horizontal rays and labeled directly on the chart.
MACD Integration:
The classic MACD crossover/under logic is used:
Bullish Crossover: MACD line crosses above the Signal line.
Bearish Crossunder: MACD line crosses below the Signal line.
Signal Filtering by Proximity:
A Proximity Zone (%) defines how close price must be to an active support or resistance to trigger a signal.
Buy Signal: When price is within the support zone and a bullish MACD crossover occurs.
Sell Signal: When price is within the resistance zone and a bearish MACD crossunder occurs.
Inputs
Pivot Confirmation Length: Bars used to confirm swing points.
MACD Fast/Slow/Signal Lengths: Standard MACD settings.
Proximity Zone (%): Defines zone width (e.g., 1% around active level).
Output
Labels: "CH" (Confirmed High) and "CL" (Confirmed Low) with color-coded dashed lines.
Signals: "BUY" and "SELL" markers appear when both pivot and MACD conditions align.
Tips
Works best on higher timeframes (H1 and above).
Combine with price action or trend filters for confirmation.
Use proximity percentage according to volatility (e.g., smaller % for low-vol assets).
⚠️ Disclaimer:
This script is provided for educational and informational purposes only.
It does not constitute financial or investment advice, and the author is not responsible for any financial losses that may occur from its use.
Always perform your own analysis and use this indicator together with other technical and risk management tools before making trading decisions.
---------------------------------------------------------------------------------------------
سقف و کف تاییدشده + سیگنالهای MACD
این اندیکاتور ترکیبی از شناسایی سقفها و کفهای تاییدشده (Pivot High/Low) به همراه سیگنالهای مومنتوم MACD است که نقاط برگشت یا ادامهی روند را روی چارت مشخص میکند.
🔹 منطق عملکرد
تایید سقف و کفها:
ابتدا سقف و کفهای محلی بر اساس تعداد کندلهای تنظیمشده شناسایی میشوند.
وقتی ساختار قیمتی از آخرین سقف یا کف عبور کند، آن سطح به عنوان حمایت یا مقاومت تاییدشده در نظر گرفته شده و با برچسبهای “CL” (کف تاییدشده) و “CH” (سقف تاییدشده) و خطوط نقطهچین رسم میشود.
ادغام با MACD:
از منطق کلاسیک کراساور/کراسآندر MACD استفاده شده است:
کراس صعودی: عبور خط MACD از بالای خط سیگنال.
کراس نزولی: عبور خط MACD از زیر خط سیگنال.
فیلتر سیگنال با ناحیه مجاور:
با استفاده از درصد ناحیه مجاور (Proximity Zone %)، فقط زمانی سیگنال صادر میشود که قیمت نزدیک حمایت یا مقاومت فعال باشد.
سیگنال خرید: وقتی قیمت در ناحیهی حمایت و همزمان MACD صعودی شود.
سیگنال فروش: وقتی قیمت در ناحیهی مقاومت و همزمان MACD نزولی شود.
تنظیمات ورودی
طول تأیید پیوتها
تنظیمات MACD (Fast, Slow, Signal)
درصد ناحیه مجاور برای فعال شدن سیگنالها
خروجیها
برچسبهای “CL” و “CH” برای سطوح تاییدشده
نشانگرهای “BUY” و “SELL” در محل صدور سیگنال
نکات کاربردی
بهترین عملکرد در تایمفریمهای بالاتر (۱ ساعته به بالا)
برای دقت بیشتر، آن را با فیلتر روند یا پرایساکشن ترکیب کنید
درصد ناحیه مجاور را با توجه به نوسانات دارایی تنظیم کنید

Clone Pivots. Oct_2023Conceptually very simple.
The all time high or low of the chart (this indicator can be used with non-price sources as well), is used to divide the price pane continuously by 2.
For example the first pivot is (All Time High + All Time Low)/2.
From this point the price chart is further divided by 2.
The user can set the depth of division, and the lines for depth are only shown around the price.
About clone pivots.
- they can be used for ladder trading
- they are based on the range of the stock or instrument price
An alternative is available to use Fib divisions rather than simple divide by 2 method.
Labels may be placed with price or without. And depth of labelling is also an option.
Clone pivots at 50% tend to work very well with price structures - give it a try and see if it helps your trading!
Pine source uses UDTs, Methods, Arrays and Maps.

Fractals PivotsWhich trader does not know pivots? There are a lot of varieties of pivots indicators of which some are a default on most trading platforms. So what better way to challenge yourself then to create your own kind of pivots. Let's welcome the idea of Fractal Pivots.
Williams Fractal or fractals is a technical analysis indicator introduced by the famous trader Bill Williams in his book ‘Trading Chaos’. He developed it on the basis of the Chaos Theory and trading psychology. The indicator is centred around the idea that there is repetition in price behaviour and fractals can provide an insight into those repetitive patterns.
How does the indicator turn these into pivot lines?
The user will set a time period in which the script will look for fractals. It will then remember all the fractals that happen during that time period.
Let's say you are trading the hourly chart with a weekly pivot setting like in the chart this script is published on. The script will highling the 1h fractals that are happening. Then the next week it will use these exact fractals from previous week to draw the pivot lines.
Another example here is an 8h chart. Look how it uses the previous week fractals this week.
Let me know if you find a very great fractal length+timeframe setting where the levels really get respected. I would really appreciate that.

Turk Pivot Candle Order BlocksOrder Blocks based on pivot reversal candle
When a pivot High or Pivot Low is found and confirmed, a box will be plotted on the open and close values of that pivot candle
You also have the ability to change the amount of candles the box stretches over as well as the colors of the bullish and bearish boxes
How To Use:-
Pivot points often provide Support and Resistance points on their own,
one way of marking up order blocks is by taking the pivot candle and marking that up as a resistance area where you could be looking for price to reverse
Dynamic Pivot Point [MarkitTick]Title: Dynamic Pivot Point MarkitTick
Concept
Unlike traditional Pivot Points, which plot static horizontal levels based on the previous period's High, Low, and Close, this script introduces a dynamic element by applying an Exponential Moving Average (EMA) to the calculated pivot levels. This approach allows the Support and Resistance zones to adapt more fluidly to recent price action, reducing the jagged steps often seen in standard multi-timeframe pivot indicators.
How It Works
The script operates in two distinct phases of calculation:
1. Data Extraction and Core Math:
The indicator first requests the High, Low, and Close data from a user-defined timeframe (e.g., Daily, Weekly). Using this data, it calculates the standard Pivot Point (P) alongside three levels of Support (S1, S2, S3) and three levels of Resistance (R1, R2, R3) using standard geometric formulas:
Pivot = (High + Low + Close) / 3
R1 = 2 * Pivot - Low
S1 = 2 * Pivot - High
(Subsequent levels follow standard Floor Pivot logic).
2. Dynamic Smoothing:
Instead of plotting these raw values directly, the script processes each calculated level (P, S1-S3, R1-R3) through an Exponential Moving Average (EMA). The length of this EMA is controlled by the Pivot Length input. This smoothing process filters out minor volatility and creates curved, dynamic trajectories for the pivot levels rather than static straight lines.
How to Use
Traders can use this tool to identify dynamic areas of interest where price may react.
The White Line represents the Central Pivot. Price action relative to this line helps determine the immediate bias (above for bullish, below for bearish).
Green Lines (Support 1, 2, 3) indicate potential demand zones where price may bounce during a downtrend.
Red Lines (Resistance 1, 2, 3) indicate potential supply zones where price may reject during an uptrend.
Because the levels are smoothed, they can also act as dynamic trend followers, similar to moving averages, but derived from pivot geometry.
Settings
Show Pivot Points: Toggles the visibility of the plot lines on the chart.
Pivot Length: Defines the lookback period for the EMA smoothing applied to the pivot levels. A higher number results in smoother, slower-reacting lines.
Timeframe: Determines the timeframe used for the underlying High/Low/Close data (e.g., selecting "D" calculates pivots based on Daily data while viewing a lower timeframe chart).
Disclaimer This tool is for educational and technical analysis purposes only. Breakouts can fail (fake-outs), and past geometric patterns do not guarantee future price action. Always manage risk and use this tool in conjunction with other forms of analysis.

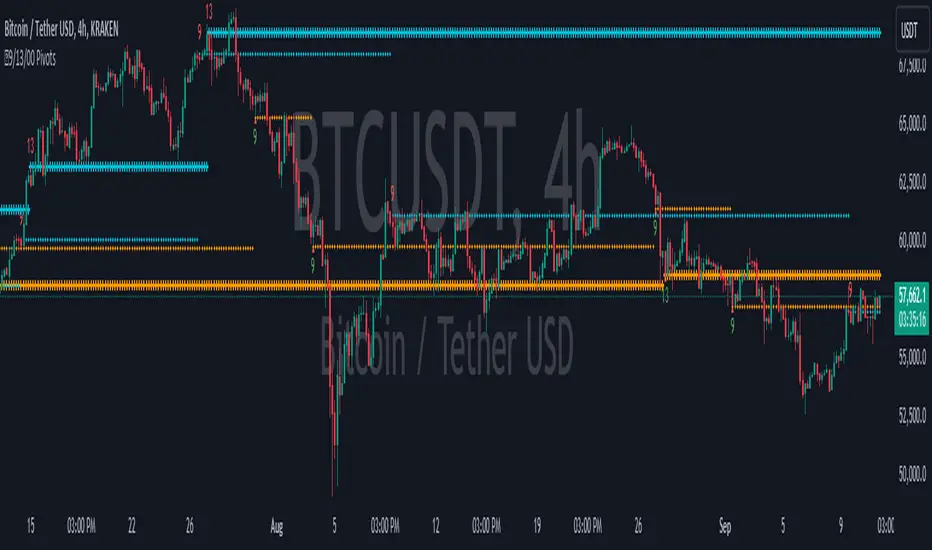
9/13/00 Pivots [Rainbow Trends]The 9/13/00 Pivot indicator is a tool that is able to highlight support and resistance levels in relation to the 9, 13 and extended counts of the trending price action. While numerous traders trade the 9/13 counts, this tool is unique in that it continues counting past the 9 level and will mark extended runs coming to an end with a vertical Red or Green Column.
The indicator identifies levels based on both 9,13 and extended counts, but splits them into both Support and Resistance levels and marks each level with a horizontal pivot. The level being Support/Resistance can be determined by the colors of the pivot. In addition, this tool Note that these styles of pivots and colors can be edited in the tool settings.
This calculation is based on the value of the current close compared to the close that happened 4 candles back.
Condition: sequence := close > close
seq := close > close
When this condition is true for 9 or 13 consecutive closes in a row, the indicator will mark the candle with the current number count as well as drawing a horizontal pivot to indicate the importance of the price level.
Sequences
Pivots
Extended Trends Ending/Exhausting
Annotated Chart
Annotated Extended Trends Ending/Exhausting
Scalp Trading Zone
Settings
Toggle Settings - Allows each visual aspect of the indicator to be enabled/disabled.
Pivot Color Settings - Allows the trader to custom tune the colors for their own style.
Candle Settings - The candles are individually marked color wise to visually draw the user's eyes to the change in candle color.
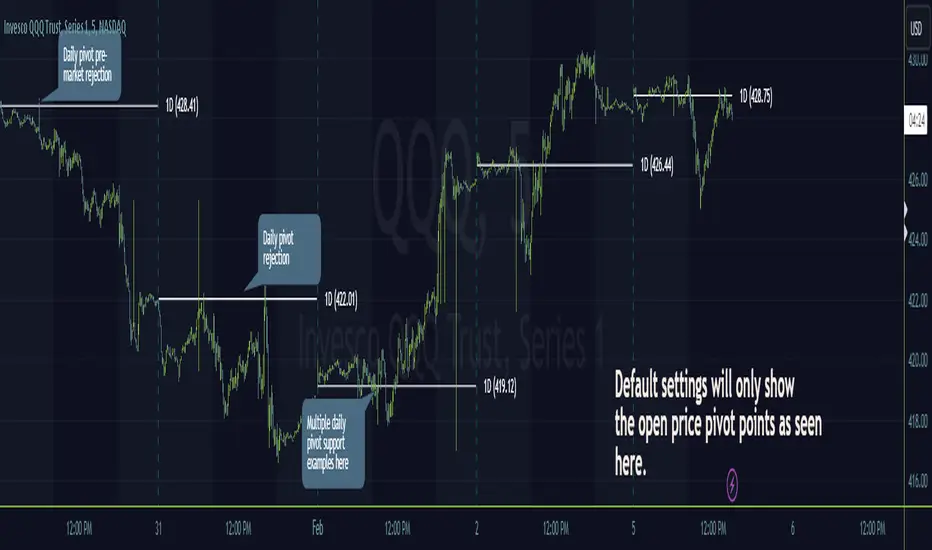
Timeframe PivotsUse this tool to plot open prices from any timeframe as a pivot level with the option to go advanced and turn on extensions (instructions below), which review the relationship between previous and current open prices to build range extensions up to six levels wide.
Please be aware extensions, nor vwap are not enabled by default! It is up to the user to determine how they wish to setup this indicator. Please read the full description for utilizing this indicator so that it's well known the complete feature set and understanding of how to enable additional plots, complete instruction is provided for all users below.
Default configuration example:
To enable extensions the user must open the indicator configuration by clicking the gear icon for "Timeframe Pivots", depending on screen resolution scrolling with mouse may need to occur in order to find the section labeled "Extensions", use the mouse or equivalent human interface device to check the checkbox to the right of the color plots and line type drop down.
Extensions enabled example:
Timeframe Selection
Timeframes available to the indicator are any timeframe the platform makes available to the user by default, or also if the TradingView user has higher tier plan to create custom timeframes - those should be available as well. To adjust timeframe the user must open the indicator configuration by clicking the gear icon for "Timeframe Pivots", depending on screen resolution scrolling with mouse may need to occur in order to find the input labeled "Timeframe", use the mouse or equivalent human interface device select the drop down and select timeframe suitable to users application.
How the extension width and extensions are calculated:
The exact process takes the new timeframe change open price calculates the difference between prior open, once that has been completed then it's divided in half to build extensions.
Code example:
Extension Width = (Open - Open ) / 2
How the extensions are calculated:
// +1 for positive extension, -1 for negative extension
(Extension Width * (Configured Multiplier * 1)) + Pivot Open Price
+1 Extension:
$5 * (1.0 * 1) + $400 = $405
-1 Extension:
$5 * (1.0 * -1) + $400 = $395
So it should be established how each projected extension, either positive or negative, is created.
Range bound market detection and notes:
One note regarding the ranges, sometimes the open prices of each period can be close in proximity to their predecessor, there's not enough range to build meaningful projections. In these situations this means the market is most likely range bound and prior range data is utilized to continue providing guidance. This addresses an issue with other pivot indicators that will instead blindly follow price and present useless pivot ranges.
It does this through detection of average half range widths, the last 14 ranges to be exact, if the current, (open - open / 2), half range width is smaller than the average, prior half range width will be used.
Code example:
// assume past half range widths are 10, 8, 9, 5, 14, 7, 7, 9, 10, 10, 4, 7, 7, 8
float v_halfRangeWidthToUseForExtensions = na
v_priorHalfRangeWidth = 10
v_avgHalfRangeWidth = 8.2 // past range widths sum = 115 / 14
v_newHalfRangeWidthToUseForExtensions = 2 // new open - open is tiny compared to avg
if v_newHalfRangeWidthToUseForExtensions < v_avgHalfRangeWidth
// replace new half range width with previous one
v_newHalfRangeWidthToUseForExtensions := v_priorHalfRangeWidth
In the code example above if the new half range width was above or equal to the rolling average, no adjustment would be made by the indicator.
VWAP
Additional feature of showing vwap, anchored to the same timeframe as the pivot, provides a trend and volume analysis within the confines of the pivots range.
The user must open the indicator configuration by clicking the gear icon for "Timeframe Pivots", scroll using mouse to the "VWAP" section and click the checkbox next to the "Source" field, past the color plots. They are not enabled by default!
The user can also add the bands for VWAP by clicking the checkbox next to the "Bands" field, past the color plots. They are not enabled by default!
VWAP calculations begin from open price of new timeframe change, then afterwards the "Source" set is utilized, the default is HLC3 which is standard for VWAP indicators.
Multiple Timeframe Analysis (MTFA)
It's simple to create a unique combination of favored timeframes for multiple timeframe analysis, consider daily, weekly and monthly combined analysis for powerful indications of market sentiment and directional bias.
Example MTFA demonstration:
Why was this created?
I created this while investigating the efficacy of open price ranges, it became apparent that these pivot ranges are some of the more price respecting pivots I've ever observed. I also grew tired of lack of price adherence to other pivot indicators widely available.
There exists a relationship between each timeframes open price in comparison to prior open price, if the market is willing to navigate to a prior lower open price from higher open price, it could be perceived as bearish and the extensions (if enabled as instructed above), could be suitable range based projections for future price movements.
Example comparison:
As can be seen, and there are many examples, where Timeframe Pivots provides more discreet levels and potential explanations for price movements.
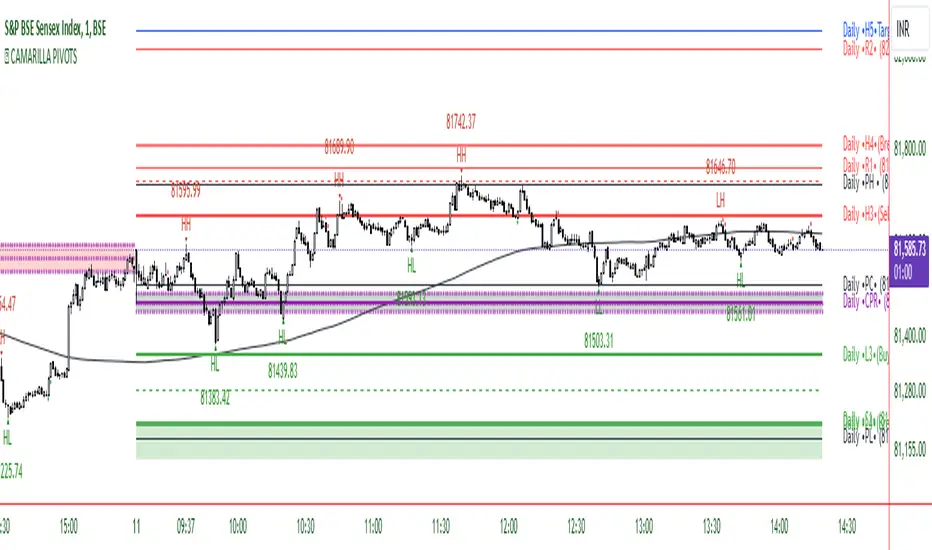
CAMARILLA PIVOTSThis indicator is based on the Pivot study. Traders will be able to plot CPR, Standard floor pivots as well as Camarilla Pivots on multiple timeframes.
Why pivots from multiple timeframes are relevant and included in this one indicator?
We can analyse pivots on multiple timeframes for different trading setups. As in, Daily floor pivots are best suited for analysing the market trend for Day trading. Similarly, Weekly and Monthly floor pivots can be analysed for Swing and positional trading entries. Whereas yearly pivot is best suited for trend analysis for investment purpose.
What is the relevance of plotting tomorrow's pivot level in advance?
Pivot are calculated based on the price happened on a previous day. And hence trader can plot tomorrow pivots in advance to shortlist stocks for tomorrow's trading session.
TimeFrames Available to traders are –
- Auto (1H)
1. Daily
2. Weekly
3. Monthly
4. Quarterly
5. Yearly
A) Daily Pivots
Present Day –
1. Trader can plot Daily CPR
2. Trader can plot Daily R1, R2, R3 and R4 pivot resistance levels
3. Trader can plot Daily S1, S2, S3 and S4 pivot support levels
4. Trader can plot Daily Camarilla levels
Future Day –
1. Trader can plot Tomorrow CPR
2. Trader can plot Tomorrow R1, R2, R3 and R4 pivot resistance levels
3. Trader can plot Tomorrow S1, S2, S3 and S4 pivot support levels
4. Trader can plot Tomorrow Camarilla levels
5. Previous Day High and Low
B) Weekly Pivots
Present Week –
1. Trader can plot Present week CPR
2. Trader can plot Present week R1, R2, R3 and R4 pivot resistance levels
3. Trader can plot Present week S1, S2, S3 and S4 pivot support levels
4. Trader can plot Present week Camarilla levels
Next Week –
1. Trader can plot Next week CPR
2. Trader can plot Next week R1, R2, R3 and R4 pivot resistance levels
3. Trader can plot Next week S1, S2, S3 and S4 pivot support levels
4. Trader can plot Next week Camarilla levels
5. Previous Week High and Low
C) Monthly Pivots
Present Month –
1. Trader can plot Present Month CPR
2. Trader can plot Present Month R1, R2, R3 and R4 pivot resistance levels
3. Trader can plot Present Month S1, S2, S3 and S4 pivot support levels
4. Trader can plot Present Month Camarilla levels
Next Month –
1. Trader can plot Next Month CPR
2. Trader can plot Next Month R1, R2, R3 and R4 pivot resistance levels
3. Trader can plot Next Month S1, S2, S3 and S4 pivot support levels
4. Trader can plot Next Month Camarilla levels
5. Previous Month High and Low
EXTREME REVERSAL SETUP:
This is by far my favorite setup in the lot. Classic Mean Reversion setup.
The logic, as explained in the book, goes like this,
1. The first bar of the pattern is about two times larger than the average size of the candles in the lookback period.
2. The body of the first bar of the pattern should encompass more than 50 percent of the bar’s total range, but usually not more than 85 percent.
3. The second bar of the pattern opposes the first.
The setup works extremely well in high beta stocks like Vedanta VEDL.
Feel free to play with the settings in order to better align this pattern with your favorite stock.
OUTSIDE REVERSAL SETUP:
My second favorite setup, it is quite good at catching intraday trends.
Here’s the logic,
1. The engulfing bar of a bullish outside reversal setup has a low that is below the prior bar’s low and a close that is above the prior bar’s high. Reverse the conditions for bearish outside reversal.
2. The engulfing bar is usually 5 to 25 percent larger than the size of the average bar in the lookback period.
Settings for this pattern simply reflect these conditions. Feel free to modify them as you wish.
DOJI REVERSAL SETUP:
Doji candles signify market indecision and this pattern tries to profit off these market conditions.
Logic:
1. The open and close price of the doji should fall within 10 percent of each other, as measured by the total range of the candlestick.
2. For a bullish doji, the high of the doji candlestick should be below the ten-period simple moving average. Vice-versa for bearish.
3. For a bullish doji setup, one of the two bars following the doji must close above the high of the doji. Vice-versa for bearish.
Feel free to modify the settings and optimize according to the stock you are trading.
Don't optimize too much :)
This pattern works brilliantly well on larger intraday timeframes, like 15m/30m/60m.
This pattern also has a higher propensity to give false indications than the two described above.
Doji reversal typically helps to catch larger trend reversals.
WICK REVERSAL SETUP:
This pattern tries to capture candlesticks with large wick sizes, as they often indicate trend reversal when coupled with significant support and resistance levels.
Logic:
1. The body is used to determine the size of the reversal wick. A wick that is between 2.5 to 3.5 times larger than the size of the body is ideal.
2. For a bullish reversal wick to exist, the close of the bar should fall within the top 35 percent of the overall range of the candle.
3. For a bearish reversal wick to exist, the close of the bar should fall within the bottom 35 percent of the overall range of the candle.
This pattern must always be coupled with important support resistance levels, else there will be a lot of false signals.
This indicator helps you identify market structure by plotting swing highs and lows (HH, LH, HL, LL).
Indicator Settings Overview
SWING LENGTH
The number of leftbars and rightbars when searching for swing points. The lower the value, the more swing points are shown and the higher the value, the less swing points are shown. I suggest adjusting it to fit your style and when switching between different timeframes.
TradingCube : Crypto : Pivot ScreenerThe Crypto Pivot Screener is a real-time scanner of a list of top crypto assets.
You can use the indicator to monitor the pivots of about 40 crypto assets.
At least once a month, I will update the List of Crypto assets.
The indicator includes three types of pivots . Classic, Fibonacci, and Standard.
You have the option to select between Daily, Weekly, and Monthly time frames as well

Standard Fibonacci Pivot PointsPivot points are probably one of the greatest leading indicator for any and all asset classes, used since the advent of the public/private markets, granted it uses previous days data, it is an awesome leading indicator that produces guide rails for future trading periods. This project was born out of the necessity to have the additional fibonacci levels and to have pivot point for the current day to appear for pre and post market hours. The latter inspiration was later added by the TV team at my request and it was greatly appreciated.
This tool can be handy in any trading process from short-long term trades or timeframes, multiple timeframe analysis, trend trades, swing trades, position trades, and momentum trades.
The tool can also be a great addition to any part of your processes especially if you are looking for instances of confluences on higher or lower timeframes.
"Pivot points are a technical indicator that is used to determine the levels at which price may face support or resistance. The Pivot Points indicator consists of a pivot point (PP) level and several support (S) and resistance (R) levels." - TV Help Center
We have found the Fibonacci levels to be more respected/self-fulfilling than other versions of the pivot point indicator. (Find example in code notes below)
Note: (If you all love the flexibility of this code then we will be happy to replicate it using the other pivot point formulas. Just drop us a private message.)
TV has a great default version of the indicator but it lacks dynamism . (The compile time is relatively similar to the default indicator also)
Some of the features that we loved from the default we have been able to carry over after many many difficult iterations :
-- Showing historical pivots (probably the most difficult feature add up until some recent pine script features additions)
-- Automatic pivot timeframe creation...meaning for appropriate pivot lines populate for daily, weekly, monthly, and yearly timeframe periods
-- Labels that do not lay on top of the lines as labels normally do
By dynamism we are referring to the following abilities/features:
-- Ability for the next day's pivot to populate before the next market open (pivots populate when the market time changes over to the next day)
-- Ability to turn on/off every support and/or resistance line...sometime you just want to see the resistance levels if it is an up kind of day
-- Ability to have the support/resistance lines to be different colors
-- Ability to change what the pivot point itself if based on
-- The additional fibonacci ratios
Default Ratios + Matching Labels:
38.2% - S1/R1
61.8% - S2/R2
100% - S3/R3
Additional (Mid) Ratios + Matching Labels:
23.6% - SA/RA
50% - SB/RB
76.4% - SC/RC
127.2% - S4/R4
141.4% - S5/R5
161.8% - S6/R6
200% - S7/R7
Code Notes and Insight:
pivot point = (high + low + close) / 3
support lines = pivot - (prevhigh - prevlow) * 0.236
resistance lines = pivot - (prevhigh - prevlow) * 0.236
The high, low and close is based on the indicator resolution which by default is set too auto due to smaller timeframes not being able to pull back enough data at time when attempting to show multiple periods of pivots.
The increased resolution is determined by the following parameters (similar to the default TV indicator):
-- for intraday resolutions up to and including 15 min, DAY (1D) is used
-- for intraday resolutions 26m, 30m, and 1H then WEEK (1W) is used
-- for 3H, 4H and daily resolutions MONTH (1M) is used
-- for weekly and monthly resolutions, 12-MONTH (12M) is used
-- Tooltips have been added on the labels as subtle references in case you forget what a specific level's formula is
-- Remember to set your changes as default in the input menu after changing the colors of lines or default populated levels
-- Number of pivots back has been limited to 20 given that indicators are only able to populate 500 lines and labels but 20 historical periods should be more than enough for sufficient use
---------
Past performance is not indicative of future performance.
Please PM us to obtain access to any of our indicators.
Please PM or comment if you run into any bugs within your use or any questions about functionality.

Parallel Pivot Lines [LuxAlgo]Displays lines connecting past pivot high/low points with each line having the slope of a linear regression. This slope can also be controlled by the user with the 'Slope' setting. Each line can be used as a support or resistance by the user.
Settings
Length : Pivot length. Use higher values for having lines connected to more significant pivots points.
Lookback : Number of lines connecting a pivot high/low to display, with a total of lines equal to Lookback*2
Slope : Allows the user to multiply the linear regression slope by a number within -1 and 1
Limitations
The script has currently several real time behavior limitations. Lines are displayed retrospectively and will not update with the arrival of new bars. Readjusting the indicator to newer pivots will require the user to either hide/unhide the indicator or change its settings.
High Length or Lookback values might not return any lines if the location of a pivot point is outside the defined buffer size of the indicator (set as 5000 bars).
How To Use
The indicator can be used to get supports and resistances and is more so closer to a drawing tool due to its limitations. The lines not updating with the arrival of new bars have the advantage of providing fixed supports/resistances.
The Slope setting allows the user to control the angle and direction of the lines. Using a Slope of 1 will return lines with the same slope as the one of a linear regression fit from the farthest pivot point displayed by the indicator to the most recent bar.
The chart above shows the indicators and a linear regression in orange.
If you want to have horizontal lines, use a Slope equal to 0.
Finally using a negative slope value will allow the user to have lines in opposite directions to the main trend.
Conclusion
We hope you like this indicator (drawing tool) and find it useful for drawing your support & resistances in a unique way!

Automatic Risk to Reward PivotsIn a nutshell I was tired of guestimating what my risk was between pivots when getting into trades I went to work on the basic math behind the relationship of the pivots to find their natural risk to reward ratios.
The natural risk to rewards span high and low...for example...you can go from the S3 --> R3 and that R:R is with a stop loss of the S4 is 7.4
But making all of those possibilities in code is excessive and for simplicity sake I price can only be between two pivot areas at any point in time.
So this auto risk to reward is limited to the 2:1 opportunities. If you by chance do the math for all of the possibilities as I have then it would be easy to change the Take Profit levels.
I use the fibonacci pivot points in this indicator but I include the mid levels and further extensions totaling 20 levels, 21 including the pivot.
Here they are...the generic plots are bolded...the additional levels are the other fib levels
R7 - 200%
R6 - 162%
R5 - 141%
R4 - 127%
R3 - 100%
R-C - 76%
R2 - 62%
R-B - 50%
R1 - 38%
R-A - 24%
Pivot
S-A - (24%)
S1 - (38%)
S-B - (50%)
S2 - (62%)
S-C - (76%)
S3 - (100%)
S4 - (127%)
S5 - (141%)
S6 - (162%)
S7 - (200%)
The indicator give you the setups for uptrends and downtrends based on the pivot point moving averages (ex. ema(hlc3, 34)) from a higher timeframe which you will be free to change yourself in the inputs.
For my setup, I trade from the daily pivots using the 10m or 5m chart so my next level up is the weekly pivots which I view using the 1H chart candles.
In the next iterations I will add the ability to change the MA lengths.
Pivot Point Moving average lengths
Weekly lengths - fast 34 : slow 55
Monthly lengths - fast 13 : slow 34
Yearly lengths - fast 13 : slow 34
Rules for Uptrends
Fast MA > Slow MA
Session high < r6
Rules for Downtrends
Fast MA < Slow MA
Session high > s6
Timeframes applicable are only those who have a higher pivot set above it
Monthly_SR = 240m, 300m, D
Weekly_SR = 26m, 30m, 60m
Daily_SR = 1m, 3m, 5m, 10m, 15m
Your take profit line will always populate where your risk will be 2:1
Your stop loss will always be one pivot level underneath or above your entry
Feel free to ask any questions. Trade well my friends!
