Pivot Points - Daily(with CPR)/Weekly/Monthly with two EMAsThis script plots all the Pivot points and Support/Resistance on your chart
You can chose Daily, Weekly or Monthly pivot.
Daily Pivot has CPR, 4 support levels and 4 resistance levels
Monthly and Weekly pivot has 3 supports and 3 resistance.
You will also get to plot two EMAs if you want.
Untick the checkbox of Primary EMA and Secondary EMA if you don't want to see EMAs(by default EMAs are disabled)
As this is a leading indicator, price reacts to these levels quite significantly.
You can use this indicator by 'Add to Favourite Indicators' option
Поиск скриптов по запросу "pivot"

Pivot point with CPR, historical, high low and openThis script generates pivot points up to 10 level with CPR levels for Daily, Weekly, Monthly & Yearly
along with resolution for Daily, Weekly, Monthly & Yearly
along with High, low and close for that resolution
can check historical levels for the resolution as well.
the pivot auto adjusts even when you change the chart pattern to heikin ashi, renko or any other.. unlike system pivot.
change the time frame & resolution to required setting like
"Daily" & "D"
"Weekly" & "W"
"Monthly" & "M"
"Yearly" & "12M"

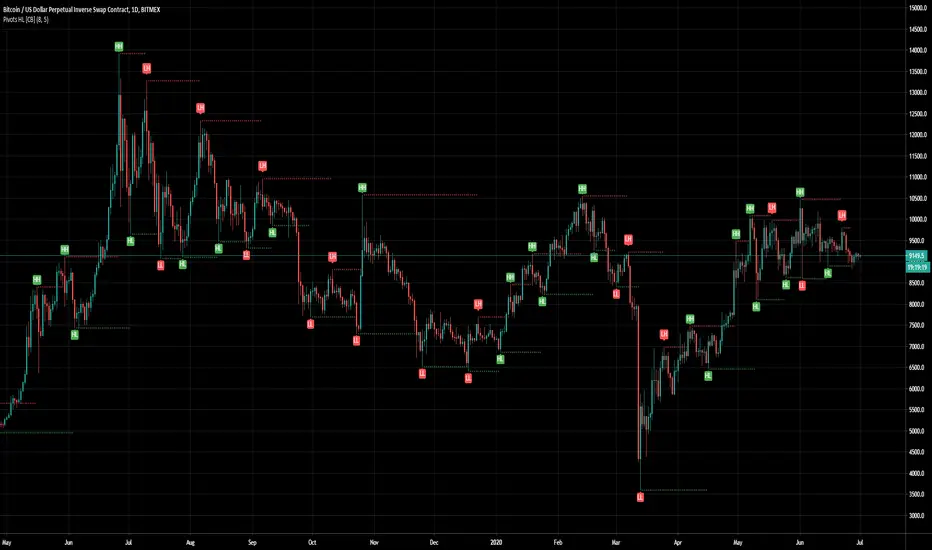
Pivots High Low (HH/HL/LH/LL)/Trend [Anan] Hello Friends,,
This is pivot points high low with pivot trend to define the trend direction.
Pivot trend is the pivot points average.
Options:
- Pivot Point Period
- Show/hide Pivot Points Labels
- Show/hide Bull/Bear Labels ( depends on pivot trend)
- Show/hide Pivot Center Line (Bull>Center, Bear

Pivot Points with Monthly and Weekly optionsA pivot point indicator that has possibility to see even the monthly or the weekly pivot points .
Pivot points are very powerful if used in correct way.
most of the time the price can be rejected from the pivot point or if the price break it it will be a nice entry if retest the pivot
R2/S2 are a very strong pivots to break but of course you need a certain distance between the pivot

Pivot Points Percentage Differences (W/ High & Low Indicators)This script is really handy for day trading. This works best on low time frames like the 1 minute or the 5 minute .
To understand what pivot points are you can add other pivot point indicators or just look at the color differences below since every-time that changes it's a new pivot point (which represents a known low or known high with high certainty)
The script shows the most recent percentage move up or down for the last known pivot point based on the pivot point setting data.
Pivot points are generated after 20 bars go by default, but you can set this to whatever you wish in the settings . Just click the gear icon for the script to set these.
You can also set how many bars back to look for what was the last highest percentage move (down or up). This will be important for your day trading strategy.
The idea to trading with this is pretty simple.
You look at the highest percentage moves that were made on pivots up or down and if you notice a current move that has trended down or up to the highest percentage, that makes that a safer bet for shorting or longing.
Of course, sometimes, things move greater or less than normal, so you would set stop losses accordingly.
Hope this helps with your day trading for finding good entry and exit points!
EXAMPLE TRADE SCENARIO
You notice the last high for the last 100 bars was 3% . The price recently rose 3% from a known pivot low. You can put a short on this. You noticed that the average price down was 2% , so if the price drops 2% or close to it you can exit your short and go LONG . You set a stop loss above what you put by an extra percentage to be safe.
I will do an experimental strategy version of this idea if people are interested.

Pivot alerts by Funded-TraderThis indicator draws Standard Pivot Levels on all products on all timeframes.
The P Pivot is included, and it goes as far as R3 and S3, as pivots 4 and 5 are rarely reached in the market.
This indicator differs from the "Standard Pivot" published by TradingView as this can be used to set-up an Alert: just add a new alert, pick "crossing" and in value pick "Pivot Alerts"
I have chosen a neutral colour Orange for all pivot levels.

Pivots + MAs ISRSPivots + MAs ISRS is a complete market-structure tool designed for traders who want clear institutional levels combined with trend confirmation from moving averages and Fibonacci zones.
This indicator helps you identify breakouts, pullbacks, and reversal points with much higher accuracy.
It combines the best of three worlds:
🔹 1. Advanced Pivot Points (Standard TV Engine)
Includes every major professional pivot type:
Traditional
Fibonacci
Woodie
Classic
DM
Camarilla
You can choose pivot anchors such as:
Daily, Weekly, Monthly, Quarterly, Yearly, and extended periods (2, 3, 5, and 10 years).
✔ Fully customizable colors
✔ Show/hide each level individually
✔ Dynamic labels (left or right)
✔ Works with intraday + extended sessions
🔹 2. Built-in Moving Averages
The indicator includes:
3 EMAs to measure trend direction and momentum
A 5-period SMA for micro-structure and scalping precision
Great for identifying confluences between trend direction + pivot levels.
🔹 3. FiboISRS Zones
Fibonacci-based zones designed to enhance price-reaction detection:
Retracement levels
Liquidity zones
Confluences with EMAs + Pivot Points
Perfect for spotting high-probability reversal areas.
🎯 What This Indicator Helps You Do
✔ See active institutional levels on any timeframe
✔ Detect real breakouts (not fakeouts) using Pivots + MAs
✔ Identify clean pullbacks into key zones
✔ Spot reactions at S1/S2/S3 or R1/R2/R3
✔ Keep your chart clean with minimal noise
Works extremely well on:
Crypto with solid liquidity
Major indices (SPX, NASDAQ, Dow)
Forex
Gold and commodities
🧠 Pro Tip
The highest-probability setups occur when price touches:
👉 A Pivot Level
👉 An EMA (20, 50, or 200)
👉 A FiboISRS zone
When these three overlap, the market often reacts strongly.
⚡ Creator
Indicator created by Ismael Robles (ISRS) to bring a clean, institutional-grade structure to everyday traders.

Pivot PointsIndicator calculates the basic pivot points from previous day's h/l/c on intraday charts

Pivot Points Standard Higher Timeframe█ OVERVIEW
This indicator was intended as educational purpose only and alternative way to write pine script in version 5 for Pivot Points Standard.
█ CREDITS
Credits to TradingView for original built-in source code.
█ FEATURES
Display price or percentage.
Change color for labels and lines.
█ USAGE EXAMPLES

Pivot Support/ResistanceThis indicator displays immediate Pivot Highs/Lows compared to the current price as lines on the chart. It can be useful to identify support/resistance.

Pivot Points And Breakout Price Action With LuckyNickVaBar Color Candle Aligned with pivot points swing high and swing lows For Those Who Are Familiar with Trading The Breakouts Of Highs & Lows Of Structure. Pivots are said to be key areas in the market where price shows heavy reaction to where reversals make occur. At these points there are swing Highs & swing lows that traders may be able to find opportunity in the market. This Script is a combination of pivot points and Barcolor signals for the breakout.

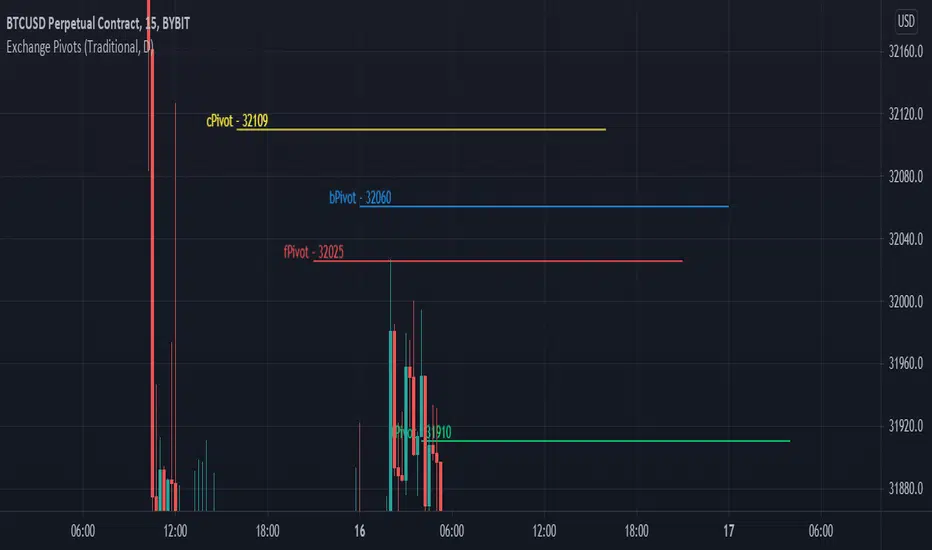
Exchange PivotsPivot points from 4 different Markets:
DailyPivot: BYBIT:BTCUSD
AsiaPivot: OKCOIN:BTCUSD
ForexPivot: FOREXCOM:BTCUSD
TradestationPivot: TRADESTATION:BTCUSD
Pivot Points (Daily, Weekly, Monthly)Pivot point: P = (High + Low)/2
First support: S1 = Low
Second support, S2 = Low - 2 * (High - Low)
First resistance: R1 = High
Second resistance, R2 = High + 2 * (High - Low)
White Line: Pivot Point
Gleen Line(Thin Line): Support 1
Green Line(Thick Line): Support 2
Red Line(Thin Line): Resistance 1
Red Line (Thick Line): Resistance 2
You can adjust it to daily, weekly or monthly indicators, daily for intraday trading (1minute, 1hour etc.), weekly and monthly for day/swing trading, monthly for weekly trades. I plot the graph with steplines since I think they can show the differences of pivots from time to time more clearly, you are free to change to other plot styles like circles or regular lines if you want to. Please like this script, and let me know any questions, thanks.

Pivot Points [CB]Automatically label pivots as HH/LH and HL/LL.
The criteria for determining pivot points can be configured.
Pivot CPR by AnandI have included the following in this script which we can include all five in a single indicator.
============================
1) PIVOT POINTS
2) CAMARILLA PIVOTS
3) Opening Price
4) Previous Day High
5) Previous Day Low
You can SHOW (or) HIDE any one in the list !
Thanks,
Anand J.
Pivots With CPR,Moving Average and VWAP - by AnanthThis indicator is a combination of Pivot points with CPR, Moving Average and VWAP.

Pivot Points (Pine)This script is an implementation of Pivot Points in Pine that supports arbitrary session lengths.
It is both a work-in-progress and for amusement, since multiple levels of Trading View support told me parts of this would not be possible to implement in Pine.

Pivots Daily Weekly Monthly YearlyDaily, Weekly, Monthly and yearly pivot lines
Just the pivot lines without the support and resistance lines


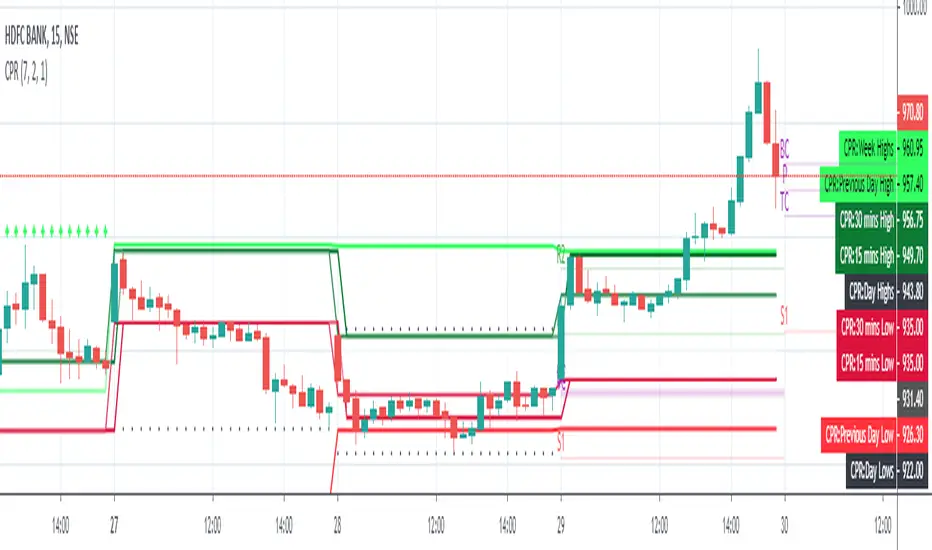
Pivot Boss IndicatorsPivot boss indicators shows central pivot range and pivot levels for support and resistance.

Pivots + EMAIndicators Pivot points and 2 EMAs combined. It can be used to find support and resistance levels and shows Exponential Moving Average lines

Pivot Breakouts with MA FilterPivot Breakouts with MA Filter
This script identifies pivot breakouts (both bullish and bearish) using support and resistance levels and overlays breakout labels, arrows, and customizable Moving Averages. It allows traders to fine-tune their analysis with multiple options to customize the display and behavior of the breakout signals.
Key Features:
Pivot Support and Resistance:
Support is defined by the lowest low in a given range (using the lookback period).
Resistance is defined by the highest high in a given range (using the lookback period).
The script draws support and resistance boxes on the chart when these levels change, providing clear visual markers for potential breakout areas.
Breakout Detection:
Bullish Breakout: A breakout above resistance and the price is above the selected moving average (MA).
Bearish Breakout: A breakdown below support and the price is below the selected MA.
Breakout events trigger labels indicating "Resistance Breakout" (for bullish) and "Support Breakout" (for bearish).
The option to show Breakout Labels (with customizable colors) is available in the settings.
Moving Average Filter:
You can select the type of moving average (SMA or EMA) to use for filtering breakout signals.
MA Filter Length: This input allows you to set the period of the moving average to act as a filter for breakout conditions. This helps ensure the breakout aligns with the broader trend.
Multiple Moving Averages (Optional):
You can add up to four different moving averages (SMA or EMA), each with its own length and color.
You have the option to toggle each moving average on or off and adjust their appearance settings (color and length).
The script supports dynamic plots for each moving average, helping to visualize multiple trends at once.
Breakout Arrows:
The script can display arrows (or other shapes) below the bar for bullish breakouts and above the bar for bearish breakouts.
Arrows are optional and can be turned on/off in the settings.
You can customize the shape of the arrows (e.g., arrow, circle, square, or even a large or small triangle).
Customizable Colors and Labels:
The color of the breakout labels and arrows can be customized in the settings to make them fit your chart's style and personal preferences.
Alerts:
Alerts can be set for new support and resistance levels, as well as when breakouts occur (either bullish or bearish).
The alert system helps to notify traders when significant price action takes place without needing to constantly monitor the chart.
Settings:
Select Moving Average Type (SMA or EMA)
MA Filter Length: Length of the moving average used for filtering breakout conditions.
Lookback Range: Determines the range over which the pivot points (support and resistance) are calculated.
Breakout Labels: Option to turn on/off breakout labels, and customize label colors.
Show Breakout Arrows: Enable or disable breakout arrows with shape options (arrow, circle, square, large triangle, small triangle).
Multiple Moving Averages: Option to show up to 4 MAs with customizable colors and lengths.

Pivot Point+ Supertrend + EMA + Support/Resistance- LAXMANTAK98
Pivot Point Supertrend with EMA and Support/Resistance Indicator
This custom trading indicator combines the following key components to assist in market analysis and trade decision-making:
Pivot Points:
Pivot points are calculated based on a chosen price source (High, Low, Open, or Close). These levels are used to determine potential support and resistance zones.
Pivot Highs (Resistance) and Pivot Lows (Support) are plotted as labels on the chart for easy identification.
Supertrend Indicator:
The Supertrend is a trend-following indicator that helps to identify bullish or bearish trends.
It uses the Average True Range (ATR) to calculate dynamic support/resistance levels, with adjustable settings for ATR length and multiplier factor.
The trend direction is visually represented by green (bullish) and red (bearish) lines on the chart.
Exponential Moving Averages (EMA):
The indicator plots up to four EMAs with user-defined periods (e.g., 9, 21, 50, 200).
EMAs are commonly used to smooth out price data and identify trends over various timeframes.
Support and Resistance Levels:
Based on Pivot Points, support and resistance levels are plotted using crosses on the chart.
These levels indicate possible price reversal points, helping traders spot key zones for entry and exit.
Visual Alerts:
The indicator includes built-in alerts for trend changes and potential buy/sell signals based on the transition between uptrend and downtrend states.
This combined indicator allows traders to analyze trends, identify key levels for trading, and make more informed decisions by integrating Pivot Points, Supertrend, EMAs, and Support/Resistance in one cohesive system.
