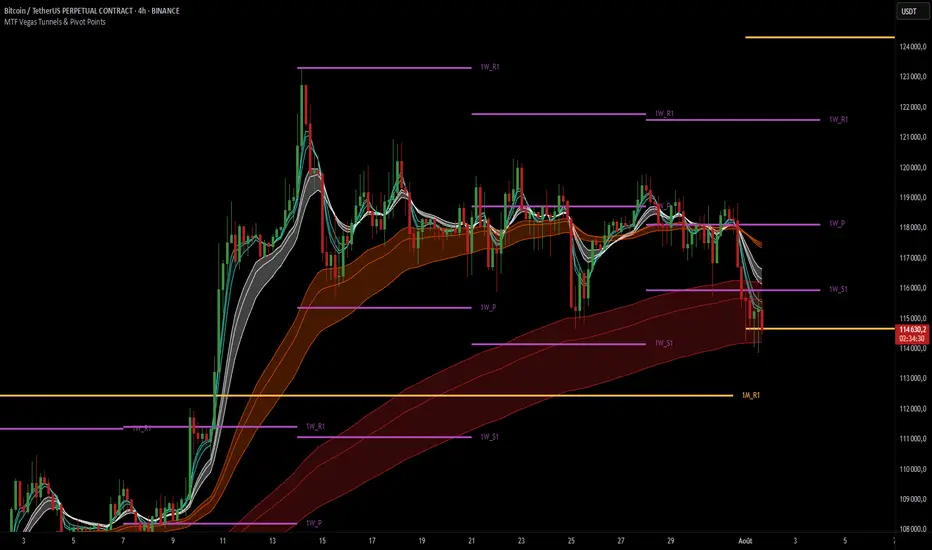
MTF Vegas Tunnels & Pivot PointsThis indicator is a professional-grade multi-timeframe confluence tool combining two highly complementary trading frameworks:
Vegas Tunnels (EMA-based trend zones)
Pivot Points (market structure levels across multiple timeframes)
Its purpose is to help traders:
Read market direction with clarity
Spot key reaction zones before they happen
Combine dynamic trend with static structure
All in one compact and fully customizable tool.
🔍 What This Indicator Shows
🌀 MTF Vegas Tunnels – Trend Momentum Zones
Vegas Tunnels are dynamic trend zones built from a trio of long-term exponential moving averages: EMA 144, 169, and 233. These specific EMAs are widely used in trend-following strategies to filter noise and focus on the core direction of the market.
They are used to identify:
The dominant market trend
Pullback or breakout zones within that trend
Dynamic support/resistance areas where price may bounce, consolidate, or reverse
This script allows you to activate up to 6 Vegas tunnels, each linked to a different timeframe: 5 min, 15 min, 1H, 4H, 1D, 3D (fully customizable)
Each tunnel displays three curves :
Low = potential dynamic support (EMA 233)
Middle = trend core zone (EMA 169)
High = potential dynamic resistance (EMA 144)
By plotting these moving averages together, the indicator forms a tunnel that visually guides you through trending environments.
Each timeframe is color-coded for clarity, helping you quickly assess the trend structure across multiple layers of the market.
🧱 Pivot Points – Market Structure Mapping
Pivot Points are price levels used by institutional traders to track where price is likely to react. This tool includes pivot levels from four timeframes :
Daily
Weekly
Monthly
Yearly
For each timeframe, you can select which levels to display :
Pivot (P)
Support 1 (S1) / Resistance 1 (R1)
Up to S5/R5 if desired
These levels are plotted as horizontal lines with labels, making it easy to :
See confluence zones between different timeframes
Anticipate reaction areas with higher accuracy
Align trend with market structure
⚙️ Customization Features
Enable/disable tunnels individually by timeframe
Choose pivot timeframes and levels to show
Adjust visual style: label names, line thickness, max levels per timeframe
Customize colors for every curve and pivot group
The indicator is designed to be clean, modular, and non-intrusive, adaptable to any trading style.
🎯 Why Use This Indicator ?
This tool is ideal for traders who want to :
Trade with the trend, not against it
Identify high-probability zones for entry/exit
See how multiple timeframes align in one chart
Make better decisions by combining momentum and structure
Whether you're a scalper using intraday pivots and 5min tunnels, or a swing trader watching weekly zones and 4H trends — this script gives you a full tactical view.
Поиск скриптов по запросу "pivot"
ReadyFor401ks Pivot / Support / ResistOverview
The ReadyFor401ks Pivot / Support / Resist indicator is a versatile tool designed to help traders identify key price levels—pivots, supports, and resistances—derived from a higher timeframe. This indicator recalculates levels based on a user-defined timeframe, providing you with a broader context for potential market reversals and continuations.
Key Features and Benefits
• Customizable Higher Timeframe:
You can select the frequency at which the levels are recalculated. For example, on a Daily chart, you might choose a 3-month timeframe to determine the pivot levels. This allows you to capture longer-term support and resistance zones that can be crucial for identifying major price reactions.
• Visual Clarity:
With toggles to show or hide the pivot, support, and resistance lines on the price chart, you have full control over the visual clutter on your chart. Additionally, you can choose to display the exact price values directly on the price scale, giving you an immediate reference as you trade.
• Enhanced Data Display:
In addition to price scale labels, the indicator offers an option to show the level values on the status line (data window). This feature is especially beneficial for traders who want to keep a close eye on these key levels without compromising chart space.
Practical Example
Imagine you’re analyzing a Daily chart while the indicator is set to recalculate levels on a 3-month frequency . Over a three-month period, the indicator determines a pivot point (P) along with three levels of resistance (R1, R2, R3) and support (S1, S2, S3). As price action unfolds, you may observe that:
• Price approaches the pivot level (P): This could indicate a potential reversal or a consolidation zone.
• Price bounces off a resistance level (e.g., R1): Signaling that the market is struggling to break higher.
• Price finds support at S1: Providing an opportunity to look for a bullish reversal.
By combining these insights with your own technical analysis, you can make more informed trading decisions based on significant levels that have been validated over a longer timeframe.
Conclusion
The ReadyFor401ks Pivot / Support / Resist indicator is ideal for traders who want to add an extra layer of confirmation to their trading strategies by identifying key price levels derived from higher timeframe data. Whether you’re a swing trader or a long-term investor, this tool helps you visualize crucial support and resistance areas, improving your market timing and risk management. Enjoy the enhanced clarity and flexibility this indicator offers on your TradingView charts!
Uptrick: SMA Pivot Marker### Uptrick: SMA Pivot Marker (SPM) — Extensive Guide
#### Introduction
The **Uptrick: SMA Pivot Marker (SPM)** is a sophisticated technical analysis tool crafted by Uptrick to help traders interpret market trends and identify key price levels where significant reversals might occur. By integrating the principles of the Simple Moving Average (SMA) with pivot point analysis, the SPM offers a comprehensive approach to understanding market dynamics. This extensive guide explores the purpose, functionality, and practical applications of the SPM, providing an in-depth analysis of its features, settings, and usage across various trading strategies.
#### Purpose of the SPM
The **SMA Pivot Marker (SPM)** aims to enhance trading strategies by offering a dual approach to market analysis:
1. **Trend Identification**:
- **Objective**: To discern the prevailing market direction and guide trading decisions based on the overall trend.
- **Method**: Utilizes the SMA to smooth out price fluctuations, providing a clearer picture of the trend. This helps traders align their trades with the market's direction, increasing the probability of successful trades.
2. **Pivot Point Detection**:
- **Objective**: To identify key levels where the price is likely to reverse, providing potential support and resistance zones.
- **Method**: Calculates and marks pivot highs and lows, which are significant price points where previous trends have reversed. These levels are used to predict future price movements and establish trading strategies.
3. **Trend Change Alerts**:
- **Objective**: To notify traders of potential shifts in market direction, enabling timely adjustments to trading positions.
- **Method**: Detects and highlights crossover and crossunder points of the smoothed line, indicating possible trend changes. This helps traders react promptly to changing market conditions.
#### Detailed Functionality
1. **Smoothing Line Calculation**:
- **Simple Moving Average (SMA)**:
- **Definition**: The SMA is a type of moving average that calculates the average of a security’s price over a specified number of periods. It smooths out price data to filter out short-term fluctuations and highlight the longer-term trend.
- **Calculation**: The SMA is computed by summing the closing prices of the chosen number of periods and then dividing by the number of periods. For example, a 20-period SMA adds the closing prices for the past 20 periods and divides by 20.
- **Purpose**: The SMA helps in identifying the direction of the trend. A rising SMA indicates an uptrend, while a falling SMA indicates a downtrend. This smoothing helps traders to avoid being misled by short-term price noise.
2. **Pivot Points Calculation**:
- **Pivot Highs and Lows**:
- **Definition**: Pivot points are significant price levels where a market trend is likely to reverse. A pivot high is the highest price over a certain period, surrounded by lower prices on both sides, while a pivot low is the lowest price surrounded by higher prices.
- **Calculation**: The SPM calculates pivot points based on a user-defined lookback period. For instance, if the lookback period is set to 3, the indicator will find the highest and lowest prices within the past 3 periods and mark these points.
- **Purpose**: Pivot points are used to identify potential support and resistance levels. Traders often use these levels to set entry and exit points, stop-loss orders, and to gauge market sentiment.
3. **Visualization**:
- **Smoothed Line Plot**:
- **Description**: The smoothed line, calculated using the SMA, is plotted on the chart to provide a visual representation of the trend. This line adjusts its color based on the trend direction, helping traders quickly assess the market condition.
- **Color Coding**: The smoothed line is colored green (upColor) when it is rising, indicating a bullish trend, and red (downColor) when it is falling, indicating a bearish trend. This color-coding helps traders visually differentiate between uptrends and downtrends.
- **Line Width**: The width of the line can be adjusted to improve visibility. A thicker line may be more noticeable, while a thinner line might provide a cleaner look on the chart.
- **Pivot Markers**:
- **Description**: Pivot highs and lows are marked on the chart with lines and labels. These markers help in visually identifying significant price levels.
- **Color and Labels**: Pivot highs are represented with green lines and labels ("H"), while pivot lows are marked with red lines and labels ("L"). This color scheme and labeling make it easy to distinguish between resistance (highs) and support (lows).
4. **Trend Change Detection**:
- **Trend Up**:
- **Detection**: The indicator identifies an upward trend change when the smoothed line crosses above its previous value. This crossover suggests a potential shift from a downtrend to an uptrend.
- **Usage**: Traders can interpret this signal as a potential buying opportunity or an indication to review and possibly adjust their trading positions to align with the new uptrend.
- **Trend Down**:
- **Detection**: A downward trend change is detected when the smoothed line crosses below its previous value. This crossunder indicates a potential shift from an uptrend to a downtrend.
- **Usage**: This signal can be used to consider selling opportunities or to reassess long positions in light of the emerging downtrend.
#### User Inputs
1. **Smoothing Period**:
- **Description**: This input determines the number of periods over which the SMA is calculated. It directly affects the smoothness of the line and the sensitivity of trend detection.
- **Range**: The smoothing period can be set to any integer value greater than or equal to 1. There is no specified upper limit, offering flexibility for various trading styles.
- **Default Value**: The default smoothing period is 20, which is a common choice for medium-term trend analysis.
- **Impact**: A longer smoothing period results in a smoother line, filtering out more noise and highlighting long-term trends. A shorter period makes the line more responsive to recent price changes, which can be useful for short-term trading strategies.
2. **Pivot Lookback**:
- **Description**: This input specifies the number of periods used to calculate the pivot highs and lows. It influences the sensitivity of pivot point detection and the relevance of the identified levels.
- **Range**: The pivot lookback period can be set to any integer value greater than or equal to 1, with no upper limit. Traders can adjust this parameter based on their trading timeframe and preferences.
- **Default Value**: The default lookback period is 3, which provides a balance between detecting significant pivots and avoiding excessive noise.
- **Impact**: A longer lookback period generates more stable pivot points, suitable for identifying long-term support and resistance levels. A shorter lookback period results in more frequent and recent pivot points, useful for intraday trading and quick responses to price changes.
#### Applications for Different Traders
1. **Trend Followers**:
- **Using the SMA**: Trend followers utilize the smoothed line to gauge the direction of the market. By aligning trades with the direction of the SMA, traders can capitalize on sustained trends and improve their chances of success.
- **Trend Change Alerts**: The trend change markers alert trend followers to potential shifts in market direction. These alerts help traders make timely decisions to enter or exit positions, ensuring they stay aligned with the prevailing trend.
2. **Reversal Traders**:
- **Pivot Points**: Reversal traders focus on pivot highs and lows to identify potential reversal points in the market. These points indicate where the market has previously reversed direction, providing potential entry and exit levels for trades.
- **Pivot Markers**: The visual markers for pivot highs and lows serve as clear signals for reversal traders. By monitoring these levels, traders can anticipate price reversals and plan their trades to exploit these opportunities.
3. **Swing Traders**:
- **Combining SMA and Pivot Points**: Swing traders can use the combination of the smoothed line and pivot points to identify medium-term trading opportunities. The smoothed line helps in understanding the broader trend, while pivot points provide specific levels for potential swings.
- **Trend Change Alerts**: Trend change markers help swing traders spot new swing opportunities as the market shifts direction. These markers provide potential entry points for swing trades and help traders adjust their strategies to capitalize on market movements.
4. **Scalpers**:
- **Short-Term Analysis**: Scalpers benefit from the short-term signals provided by the SPM. The smoothed line and pivot points offer insights into rapid price movements, while the trend change markers highlight quick trading opportunities.
- **Pivot Points**: For scalpers, pivot points are particularly useful in identifying key levels where price may reverse within a short time frame. By focusing on these levels, scalpers can plan trades with tight stop-loss orders and capitalize on quick price changes.
#### Implementation and Best Practices
1. **Setting Parameters**:
- **Smoothing Period**: Adjust the smoothing period according to your trading strategy and market conditions. For long-term analysis, use a longer period to filter out noise and highlight broader trends. For short-term trading, a shorter period provides more immediate insights into price movements.
- **Pivot Lookback**: Choose a lookback period that matches your trading timeframe. For intraday trading, a shorter lookback period offers quick identification of recent price levels. For swing trading or long-term strategies, a longer lookback period provides more stable pivot points.
2. **Combining with Other Indicators**:
- **Integration with Technical Tools**: The SPM can be used in conjunction with other technical indicators to enhance trading decisions. For instance, combining the
SPM with indicators like RSI (Relative Strength Index) or MACD (Moving Average Convergence Divergence) can provide additional confirmation for trend signals and pivot points.
- **Support and Resistance**: Integrate the SPM’s pivot points with other support and resistance levels to gain a comprehensive view of market conditions. This combined approach helps in identifying stronger levels of support and resistance, improving trade accuracy.
3. **Backtesting**:
- **Historical Performance**: Conduct backtesting with historical data to evaluate the effectiveness of the SPM. Analyze past performance to fine-tune the smoothing period and pivot lookback settings, ensuring they align with your trading style and market conditions.
- **Scenario Analysis**: Test the SPM under various market scenarios to understand its performance in different conditions. This analysis helps in assessing the reliability of the indicator and making necessary adjustments for diverse market environments.
4. **Customization**:
- **Visual Adjustments**: Customize the appearance of the smoothed line and pivot markers to enhance chart readability and match personal preferences. Clear visual representation of these elements improves the effectiveness of the indicator.
- **Alert Configuration**: Set up alerts for trend changes to receive timely notifications. Alerts help traders act quickly on potential market shifts without constant monitoring, allowing for more efficient trading decisions.
#### Conclusion
The **Uptrick: SMA Pivot Marker (SPM)** is a versatile and powerful technical analysis tool that combines the benefits of the Simple Moving Average with pivot point analysis. By providing insights into market trends, identifying key reversal points, and detecting trend changes, the SPM caters to a wide range of trading strategies, including trend following, reversal trading, swing trading, and scalping.
With its customizable inputs, visual markers, and trend change alerts, the SPM offers traders the flexibility to adapt the indicator to different market conditions and trading styles. Whether used independently or in conjunction with other technical tools, the SPM is designed to enhance trading decision-making and improve overall trading performance. By mastering the use of the SPM, traders can gain a valuable edge in navigating the complexities of financial markets and making more informed trading decisions.

Support and Resistance Pivot Points/Lines [Mauserrifle]Support and Resistance Pivot Points/Lines by Mauserrifle. A personal take on drawing support and resistance pivot lines. This indicator was born as the core of bot strategies I am trying to build. I think this indicator with its feature called “Cooldown rounding” can be useful to others to manually scalp or analyze charts. I did not find other indicators to do the same so I hope you find it useful.
A summary of the features:
It will draw high/low pivot lines based on a maximum of eight higher timeframes
You can set up how many days the lines are valid and appear per timeframe. The default period days are based on a 2m chart strategy. Consider higher values for day charts.
The lines will be drawn from the moment when they are KNOWN, which helps analyzing historical charts. You can change this behavior to make them draw from the pivot (looking at future data on historic data)
The pivot point lines can be rounded by multiple methods: round, ceil/floor, roundn (decimal) and round_to_mintick. This general rounding feature is disabled by default because, in my opinion, a much more useful one can be used which I call “Cooldown rounding” described in the next point.
Cooldown rounding: Round lows and highs for a cooldown period to keep the previous pivot line instead of adding a new line when they match the rounded value within the cooldown period. The existing line will be extended. This feature is useful because it makes sure the initial line is added to the exact high/low pivot level but any future lines within the rounding will just extend the existing line. Consider using roundn on some intraday charts such as SPY 2m.
You can set a maximum minutes for the cooldown. The default is 3 years which is just based on some charting techniques for scalping 2m. It will just enable the cooldown rounding permanently on the intraday (due max bar limit) and with a limit on daily. Tweak it to your needs.
It is possible to always add new pivot lines when a new high is higher or low is lower compared to previous line. Thus ignoring the rounding logic. Consider disabling it on intraday charts such as SPY 2m.
NOTE:
Only configured timeframes EQUAL/ABOVE your chart timeframe will activate
The default period days are optimized for a 2m intraday trading strategy. Consider higher values for day charts.
Max lines rendered is set to 500
Line calculation is limited by the max bars of the chart and date range
Repainting may happen on intraday when for example using a 2m chart timeframe with pivots on 15m+ (as documented by tradingview). Rendered days 7+ will also cause repainting issues on 2m charts. See tradingview support docs: 43000478429. For scalping manually using already known lines this shouldn't be a problem I think but be aware!
The default settings have been set so every chart timeframe will show lines without further configuration.
Keep an eye on the data window how many lines are rendered. Make sure you never exceed 500. Anything above will cause earlier lines to disappear which could be a problem when you use it to analyze historical data.
I hope you find this useful!
DISCLAIMER
Trading is risky & most day traders lose money. This indicator is purely for informational & educational purposes only. Past performance does not guarantee future results.

TraderHouse Pivots Fibonacci TraderHouse Pivots Fibonacci
A pivot point is a technical analysis indicator, or calculation, used to determine the overall trend of the market over different time frames. The pivot point itself is simply the average of the high, low, and closing prices from the previous trading day.
Fibonacci retracement levels are horizontal lines that indicate the possible locations of support and resistance levels. Each level is associated with one of the above ratios or percentages. It shows how much of a prior move the price has retraced. The direction of the previous trend is likely to continue.

Divergence and Pivot - Detector For Any IndicatorI present to you an indicator capable of determining the divergence and convergence points for any indicator you choose. It will also determine Pivot points.
All you need to do is add the indicator to your favorites and call it. Next, you need a second indicator for which you want to find divergences or pivots. Next you need choise 'Oscillator Source' section in my indicator, after that you need to choose the name of the indicator for which you want to find divergences . - Done!
Thanks to the developers of TradingView for posting the source code of the "Divergence Indicator" indicator.

[CP]Pivot Boss Candlestick Scanner - No Repainting This indicator is based on the high probability candlestick patterns described in the ’Secrets of a Pivot Boss’ book.
The indicator does not suffer from repainting.
I have kept this indicator open source, so that you can take this indicator and design a complete trading system around it.
Although the patterns have some statistical edge in the markets, blindly using them as Buy/Sell Indicators will certainly result in a heavy loss.
I like some of these setups more than others, and I have listed them in the order of my likeness.
The first one I like the most, the last one, I like the least.
The patterns are universal and work well in both intraday, daily and even larger timeframes.
Signals in the example charts are manually marked by,
Hammer - profitable short signal
Rocket - profitable long signal
X - unprofitable long or short signal
GENERAL USER INPUTS:
These settings exist as the indicator uses ‘Labels’ to mark the patterns and Pine Script limits a maximum of 500 labels on a chart.
If you want to go back in the past and check how the indicator was doing, set the Start and End dates both and check the ’Use the date range above to mark the Candlestick Setups?’ option.
EXTREME REVERSAL SETUP:
This is by far my favorite setup in the lot. Classic Mean Reversion setup.
The logic, as explained in the book, goes like this,
1. The first bar of the pattern is about two times larger than the average size of the candles in the lookback period.
2. The body of the first bar of the pattern should encompass more than 50 percent of the bar’s total range, but usually not more than 85 percent.
3. The second bar of the pattern opposes the first.
The setup works extremely well in high beta stocks like Vedanta VEDL.
Feel free to play with the settings in order to better align this pattern with your favorite stock.
Check out the examples below,
No indicator is perfect, failed patterns are marked with an X.
OUTSIDE REVERSAL SETUP:
My second favorite setup, it is quite good at catching intraday trends.
Here’s the logic,
1. The engulfing bar of a bullish outside reversal setup has a low that is below the prior bar’s low and a close that is above the prior bar’s high. Reverse the conditions for bearish outside reversal.
2. The engulfing bar is usually 5 to 25 percent larger than the size of the average bar in the lookback period.
Settings for this pattern simply reflect these conditions. Feel free to modify them as you wish.
The pattern is pretty powerful and will sometimes help you catch literally all the highs and lows of the market, as shown in the examples of Vedanta VEDL and RELIANCE stocks below.
As usual, this pattern is not PERFECT either.
DOJI REVERSAL SETUP:
Doji candles signify market indecision and this pattern tries to profit off these market conditions.
Logic:
1. The open and close price of the doji should fall within 10 percent of each other, as measured by the total range of the candlestick.
2. For a bullish doji, the high of the doji candlestick should be below the ten-period simple moving average. Vice-versa for bearish.
3. For a bullish doji setup, one of the two bars following the doji must close above the high of the doji. Vice-versa for bearish.
Feel free to modify the settings and optimize according to the stock you are trading.
Don't optimize too much :)
This pattern works brilliantly well on larger intraday timeframes, like 15m/30m/60m.
This pattern also has a higher propensity to give false indications than the two described above.
Doji reversal typically helps to catch larger trend reversals. Check out the examples below from RELIANCE and NIFTY charts,
Note that the RELIANCE chart below is the same as shown for the Outside Reversal Setup above, notice the confluence of Outside
Reversal and Doji Reversal on the 31st August.
Confluence of patterns usually increases the probability of success.
RELIANCE 15m Chart - Pattern can catch nice trends on higher timeframes
NIFTY 15m Chart
WICK REVERSAL SETUP:
This pattern tries to capture candlesticks with large wick sizes, as they often indicate trend reversal when coupled with significant support and resistance levels.
Logic:
1. The body is used to determine the size of the reversal wick. A wick that is between 2.5 to 3.5 times larger than the size of the body is ideal.
2. For a bullish reversal wick to exist, the close of the bar should fall within the top 35 percent of the overall range of the candle.
3. For a bearish reversal wick to exist, the close of the bar should fall within the bottom 35 percent of the overall range of the candle.
This pattern must always be coupled with important support resistance levels, else there will be a lot of false signals.
The chart below is the same NIFTY chart as above with the Wick Reversal candles marked as well.
You can see that there are a lot of false signals, but the price also indicates ’pausing’ at important levels by printing a wick reversal setup.
You can use this information to your advantage when riding a trend.
FINAL WORDS:
Settings for various patterns simply reflect the logic described.
You will probably need to tweak and optimize the pattern settings for the stock that you are trading.
Higher Beta/Higher Volatility stocks are a great choice for these patterns.
Using these patterns at critical support and resistance levels will result in dramatically high accuracy.
Be creative and try to develop a proper system around this indicator, with rules for position sizing, stop loss etc.
You do not have to trade all the patterns. Even trading just one pattern with a proper system is good enough.
DO NOT USE THIS INDICATOR AS A BUY/SELL SYSTEM, YOU WILL LOSE MONEY.
Feel free to drop any feedback in the comments section below, or if you have any unique candlestick patterns that you would like me to code.

On-Balance Volume Oscillator with Divergence and PivotsThis is On-Balance Volume recalculated to be an Oscillator, a Divergence hunter was added, also Pivot Points and Alerts.
On-Balance Volume, or OBV is considered a "leading indicator" - in contrast to a "lagging indicator" just as Moving Averages it does not show a confirmation what already happened, but it shows what can happen in the future. For example: The chart is climbing while the OBV oscillator is slowly declining, gets weaker and weaker, maybe even prints bearish divergences? That means that a reversal might be occurring soon. Leading indicators are best paired with Stop and Resistance Lines, general Trendlines, Fib Retracements etc...Your chart is approaching a very important Resistance Trendline but the OBV shows a very positive signal? That means there is a high probability that the Resistance is going to be pushed though and becomes Support in the future.
What are those circles?
-These are Divergences. Red for Regular-Bearish. Orange for Hidden-Bearish. Green for Regular-Bullish. Aqua for Hidden-Bullish.
What are those triangles?
- These are Pivots. They show when the OBV oscillator might reverse, this is important to know because many times the price action follows this move.
Please keep in mind that this indicator is a tool and not a strategy, do not blindly trade signals, do your own research first! Use this indicator in conjunction with other indicators to get multiple confirmations.

Combo Backtest 123 Reversal & Pivot Point V2 This is combo strategies for get a cumulative signal.
First strategy
This System was created from the Book "How I Tripled My Money In The
Futures Market" by Ulf Jensen, Page 183. This is reverse type of strategies.
The strategy buys at market, if close price is higher than the previous close
during 2 days and the meaning of 9-days Stochastic Slow Oscillator is lower than 50.
The strategy sells at market, if close price is lower than the previous close price
during 2 days and the meaning of 9-days Stochastic Fast Oscillator is higher than 50.
Second strategy
Pivot points simply took the high, low, and closing price from the previous period and
divided by 3 to find the pivot. From this pivot, traders would then base their
calculations for three support, and three resistance levels. The calculation for the most
basic flavor of pivot points, known as ‘floor-trader pivots’, along with their support and
resistance levels.
WARNING:
- For purpose educate only
- This script to change bars colors.

Adoptive Supertrend - PivotsAnother experiment with Supertrend by making use of pivot point high/lows.
Trailing Stop types used in this indicator are:
ATR - plain ATR based supertrend
Breakout - ATR based supertrend combined with breakout. (Trailing triggered only if price change is higher than HighPriceChange multiplier times ATR.
Pivot Points - Trail only when new pivots created. Pivot stop multiplier is used below pivot low.
Combined - Combine everything together

GODMODE PivotsGODMODE PIVOTS
******************************************************
Note : Read below before you use on live trading accounts and test on paper trading until you get used to of it
*** This script does not provide end to end signals like buy here and sell there ***
* I personally use this trading system for my trades so i have converted all of it into one script
* I got used to with these ema's and been using it from long time ago
* Take trades on your own risk
*******************************************************
# Script Signals :
* Pivot points for take profits
* UT ( up trend indication )
* DT ( down trend indication )
* Small triangles ( red ,green for continuation )
* Bar colors ( for overbought and oversold )
* 3 EMA's ( for support and resistance )
# how to use :
++++ made to use on 30 min and 1 hr time frame only ++++
* Ema's for support and resistance
* long after "UT" green signal
* short after "DT" red signal
* "Piv" labels (pivot points) for take profits
Piv red = take profits on longs
Piv green = take profits on shorts
* Small triangles shows continuation signals
green for up trend
red for downtrend
* Bar colors shows over sold and overbought price
Green and blue is for oversold price
Red and Orange is for overbought price
When these bar colors occurs i consider closing full position
* Use Ema's for stop placements
**look at the chart for reference
Dm for access
Thanks

Pivot Point V2 Strategy Pivot points simply took the high, low, and closing price from the previous period and
divided by 3 to find the pivot. From this pivot, traders would then base their
calculations for three support, and three resistance levels. The calculation for the most
basic flavor of pivot points, known as ‘floor-trader pivots’, along with their support and
resistance levels.
WARNING:
- For purpose educate only
- This script to change bars colors.
Renko Chart Alerts with PivotsAdd alerts to renko charts to be notified when:
new brick
brick up
brick down
direction change
direction change up
direction change down
Also shows pivots based on brick reversals. Alerts also available for:
pivot breakout
pivot high breakout
pivot low breakout
You can hide the plots for pivot high/low and breakouts in the style tab of the settings for the indicator.
To add the alerts:
add the indicator to your renko chart
click add alert
click the condition dropdown and choose Renko Alerts
you should see all the alerts there and you can add any one or more to your chart

ATR/EMA/Pivots/Crossover/LabelsScript for ATR, EMA , Pivots , EMA crossover, and Buy/Sell Labels for EMA Crossover
ATR Channel plotted from open of candle
3 channels with configurable length
+/- .5
+/- 1
+/- 2
EMAx5
Preset to 10, 20, 50, 100, 200. Lengths are configurable
Standard Pivots
Pivot with S1, S2, S3, R1, R2, R3
EMA crossover with Buy/Sell Labels
EMAs lengths are configurable for crossover
(Ability to change colors and turn on/off all of the above. Pic is only showing +/-1 ATR channel, EMAs, Pivot Point with S1/R1, and Crossover with Buy Sell Labels)
Find this useful? Accepting tips. Message me.

Fibonacci Pivot Points AlertsCreated a script for alerts on Fibonacci Pivot Points.
You will be able to create separate alerts for every level or create one for price crossing any level.
Because of some TradingView limitations, alerts won't be fired for the first bar of the session. Will try to solve that in the new versions.
In the script used new v4 plotting features, so will be able to plot levels and labels nicely. Unfortunately, there is a limit on the number of consecutive lines you can plot on the plot (around 50), so lines in the past will disappear.
And remember:
Past performance does not guarantee future results.
Dynamic Pivot Point This Pivot points is calculated on the current day.
Pivot points simply took the high, low, and closing price from the previous period and
divided by 3 to find the pivot. From this pivot, traders would then base their
calculations for three support, and three resistance levels. The calculation for the most
basic flavor of pivot points, known as ‘floor-trader pivots’, along with their support and
resistance levels.

Universal Pivot ScannerUniversal Pivot Scanner
Professional pivot pattern detection for any market data source.
A robust pivot detector designed to work across all timeframes and data types - price action, technical indicators, volume, or custom studies. One tool, multiple applications.
Core Functionality
Identifies two high-probability retracement patterns:
HH+HL → Bullish continuation setup (higher high followed by higher low)
LL+LH → Bearish continuation setup (lower low followed by lower high)
Key Features
Non-repainting detection. Labels and alerts trigger at pivot confirmation, ensuring real-time actionable signals without historical bias.
Source flexibility. Compatible with any input - price data, oscillators (RSI, MACD), volume analysis, or proprietary indicators. Single implementation across multiple strategies.
Adaptive configuration. Adjustable lookback period optimizes performance for different market conditions and data types.
Recommended Settings
Lookback: 1 → Oscillators and momentum indicators
Lookback: 3-10 → Price action and ranging markets
Includes visualization table displaying recent pivot sequence and active pattern status.
Designed for systematic traders requiring consistent, verifiable signals across diverse market conditions.

Dynamic Pivot Fibonacci v1.3Advanced Fibonacci Levels & Time Zones
This indicator provides a comprehensive suite for Fibonacci analysis, focusing on both price and time. It is designed for technical analysts who require a highly configurable tool to identify key levels of support, resistance, and temporal market rhythm.
📊 Core Price Level Features
The indicator's primary function is to draw Fibonacci price levels based on one of two user-defined calculation methods:
Pivot-Based Calculation: Automatically detects high/low pivot points using configurable Pivot Left and Pivot Right lookback periods.
Memory-Based Calculation: Identifies the highest high and lowest low over a specified Memory Length (lookback period).
🎨 Display & Customization
13 Configurable Levels: Users can enable, define, and color up to 13 distinct price levels.
Background Fill: Optional color filling between levels for enhanced visual clarity.
Line Extension: Full control over line drawing, including extending lines to the left, right, or both (either indefinitely or for a limited number of bars).
Historical Deletion: Option to automatically delete previous Fibonacci lines when a new range is detected.
⏳ Additional Analysis Tools
Fibonacci Time Zones: Renders vertical time markers based on the Fibonacci sequence, projected from the selected pivot points. This feature is designed to help identify potential turning points in time.
Trend Analysis (SMMA): Includes an optional module to display multiple Smoothed Moving Averages (SMMA) and an aggregate trend line, assisting in contextual market analysis.
🇮🇷 توضیحات فارسی
سطوح پیشرفته فیبوناچی و مناطق زمانی
این اندیکاتور مجموعهای جامع برای تحلیلهای فیبوناچی، با تمرکز همزمان بر قیمت و زمان، ارائه میدهد. این ابزار برای تحلیلگران فنی طراحی شده است که نیازمند ابزاری با قابلیت تنظیمات بالا جهت شناسایی سطوح کلیدی حمایت، مقاومت و ریتم زمانی بازار هستند.
📊 ویژگیهای اصلی سطوح قیمتی
عملکرد اصلی این اندیکاتور، ترسیم سطوح قیمتی فیبوناچی بر اساس یکی از دو متد محاسباتی قابل تعریف توسط کاربر است:
محاسبه مبتنی بر پیوت (Pivot-Based): به صورت خودکار نقاط پیوت سقف و کف را بر اساس دورههای بازبینی (Lookback) قابل تنظیم (Pivot Left و Pivot Right) شناسایی میکند.
محاسبه مبتنی بر حافظه (Memory-Based): بالاترین سقف و پایینترین کف را در یک طول حافظه (دوره بازبینی) مشخص، پیدا میکند.
🎨 نمایش و سفارشیسازی
۱۳ سطح قابل تنظیم: کاربران میتوانند تا ۱۳ سطح قیمتی مجزا را فعال، تعریف و رنگآمیزی کنند.
پُر کردن پسزمینه (Fill): قابلیت اختیاری پُر کردن فضای بین سطوح با رنگ، برای افزایش وضوح بصری.
امتداد خطوط: کنترل کامل بر ترسیم خطوط، شامل امتداد دادن به سمت چپ، راست یا هر دو طرف (به صورت نامحدود یا برای تعداد کندلهای معین).
حذف سطوح گذشته: گزینهای برای حذف خودکار خطوط فیبوناچی قبلی به هنگام شناسایی یک محدوده جدید.
⏳ ابزارهای تحلیلی جانبی
مناطق زمانی فیبوناچی (Fib Time Zones): نشانگرهای زمانی عمودی را بر اساس دنباله فیبوناچی ترسیم میکند که از نقاط پیوت منتخب، پروجکت (project) شدهاند. این ویژگی برای کمک به شناسایی نقاط عطف احتمالی در بستر زمان طراحی شده است.
تحلیل روند (SMMA): شامل یک ماژول اختیاری برای نمایش چندین میانگین متحرک هموارشده (SMMA) و یک خط روند کلی، جهت کمک به تحلیل زمینه بازار.

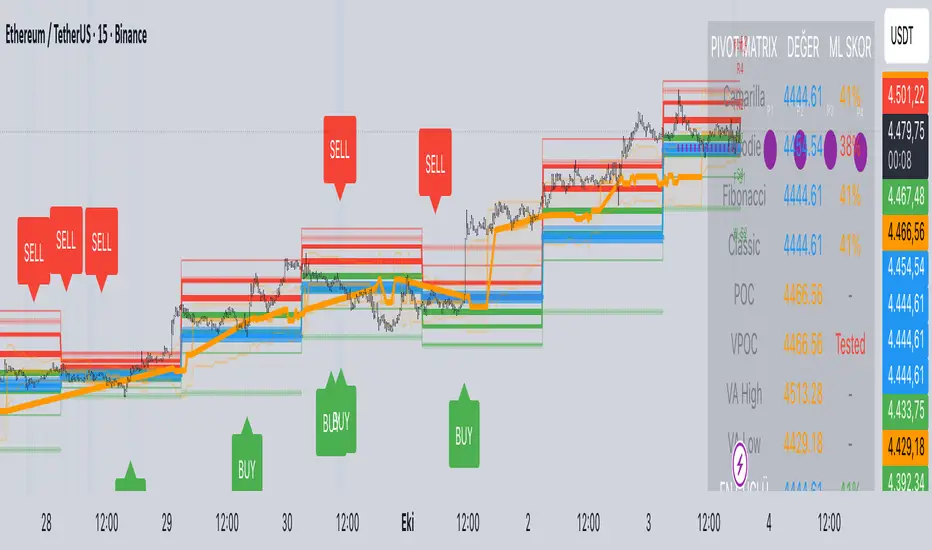
Predictive Pivot Matrix OHLC data, integrates volume profile for POC/Value Area tracking (including virgin POC), applies rule-based "ML" scoring to evaluate pivot strength via factors like proximity, volume, touches, trend, and confluence, monitors adaptive success rates, projects 5-day future pivots using trend/volatility, detects overlapping confluence zones, and generates visuals (lines, labels, table), alerts, and buy/sell signals on key crossings.
OrderBlock / FVG / BoS / Pivots (Multi-Tools) v 1.3Questo indicatore identifica e visualizza diversi pattern di price action utilizzati nel trading Smart Money Concepts (SMC). Ecco cosa fa:
Funzionalità Principali
-Order Blocks (OB) - Identifica blocchi di ordini istituzionali dove il prezzo potrebbe rimbalzare
-Fair Value Gaps (FVG) - Rileva gap di prezzo che potrebbero essere riempiti
-Break of Structure (BoS) - Segnala rotture di strutture di mercato importanti
-Rejection Blocks (RJB) - Trova zone di rifiuto del prezzo
-Premium Premium Discount Discount (PPDD) - Identifica order blocks formati dopo sweep di liquidità
Caratteristiche Aggiuntive
-Pivot Points - Visualizza massimi e minimi di mercato
-High Volume Bars - Evidenzia candele con volume anomalo
-Stacked OB+FVG - Segnala quando order block e fair value gap si sovrappongono
Personalizzazione
L'indicatore offre controlli completi per:
-Colori personalizzabili per ogni elemento
-Numero massimo di box visualizzabili
-Trasparenza e stili dei bordi
-Etichette e dimensioni
-Opzioni per evidenziare zone "mitigate" (già testate dal prezzo)
È uno strumento molto utile per trader che seguono la metodologia "Smart Money" e cercano di identificare dove gli operatori istituzionali potrebbero aver piazzato i loro ordini.
////////////////////////////////////////////////////////////////////////////////
This indicator identifies and displays various price action patterns used in Smart Money Concepts (SMC) trading. Here's what it does:
Main Features
-Order Blocks (OB) - Identifies institutional order blocks where the price could bounce
-Fair Value Gaps (FVG) - Detects price gaps that could be filled
-Break of Structure (BoS) - Alerts breakouts of important market structures
-Rejection Blocks (RJB) - Finds price rejection zones
-Premium Premium Discount Discount (PPDD) - Identifies order blocks formed after liquidity sweeps
Additional Features
-Pivot Points - Displays market highs and lows
-High Volume Bars - Highlights candles with abnormal volume
-Stacked OB+FVG - Alerts when order blocks and fair value gaps overlap
Customization
The indicator offers complete controls for:
-Customizable colors for each element
-Maximum number of displayable boxes
-Transparency and border styles
-Labels and sizes
-Options to highlight "mitigated" zones (already tested by the price)
It's a tool Very useful for traders following the "Smart Money Concepts" and trying to identify where institutional traders may have placed their orders.

Multi-Timeframe PivotDescription:
This script provides an advanced tool for multi-timeframe pivot point
analysis. It identifies swing points based on a candle's relationship to
its neighbors. The default strength settings of 1 align with the Inner
Circle Trader (ICT) concept of market structure.
The ICT concept defines a swing point based on a simple 3-candle pattern:
- A swing high is a candle where the candles to the immediate left and right
both have lower highs.
- A swing low is a candle where the candles to the immediate left and right
both have higher lows.
A key feature is its ability to accurately calculate and translate pivot
points from up to five higher timeframes (HTFs) and display them
precisely on a lower timeframe (LTF) chart.
NOTE: This indicator is designed to show HTF data on an LTF chart.
If you select a timeframe in the settings that is lower than your
current chart's timeframe, it will show pivots for the chart's
timeframe instead.
Core Features:
- Up to five independent higher timeframes.
- Per-timeframe customization for pivot strength (left/right bars) and color.
- Optional "Watchlines" that project the price of each pivot forward,
complete with a text label identifying the timeframe.
- An optional "Alignment Model" that colors the background when price is
aligned across all active timeframes (requires at least 2 TFs to be enabled).
Default State:
For a clean initial application, the Watchlines and Alignment Model features
are disabled by default but can be enabled in the settings.

Pivot Reversal Strategy + alerts via TradingConnector to indicesSoftware part of algotrading is simpler than you think. TradingView is a great place to do this actually. To present it, I'm publishing each of the default strategies you can find in Pinescript editor's "built-in" list with slight modification - I'm only adding 2 lines of code, which will trigger alerts, ready to be forwarded to your broker via TradingConnector and instantly executed there. Alerts added in this script: 14 and 22.
How it works:
1. TradingView alert fires.
2. TradingConnector catches it and forwards to MetaTrader4/5 you got from your broker.
3. Trade gets executed inside MetaTrader within 1 second of fired alert.
When configuring alert, make sure to select "alert() function calls only" in CreateAlert popup. One alert per ticker is required.
Adding stop-loss, take-profit, trailing-stop, break-even or executing pending orders is also possible. These topics have been covered in other example posts.
This routing works for Forex, indices, stocks, crypto - anything your broker offers via their MetaTrader4 or 5.
Disclaimer: This concept is presented for educational purposes only. Profitable results of trading this strategy are not guaranteed even if the backtest suggests so. By no means this post can be considered a trading advice. You trade at your own risk.
If you are thinking to execute this particular strategy, make sure to find the instrument, settings and timeframe which you like most. You can do this by your own research only.

Trader’s Pivot (also known as Bob's Pivots or Fish's Rule)Trader’s Pivot (also known as Bob's Pivots or Fish's Rule).
This indicator works on any time frame, daily or shorter and can be used in trading Stocks or Future contracts for day or swing trading.
For access to this indicator, please send private message.
