PRP - Pivot Reversal + PSAR Strategy [QuantNomad]PRP is a combination of Pivot Reversal and PSAR Strategy. With this strategy, I tried to be in a position for big moves in the market.
The strategy uses Pivot Reversal entries with an additional condition that TR of entry bar should be at least X ATRs. This allows to filter out some false signals.
For exits, I recoded the PSAR indicator as trailing stop loss. So I start PSAR Y ATRs below the Pivot level price crossed at entry. After that PSAR behaves as usual.
For stability and easier execution, I check conditions only on the close, no stop/limit orders are used.
Поиск скриптов по запросу "pivot"

MTF Trend Analyzer with Swing Pivots & S/R Levels [SmartFoxy]Indicator “Multi-Timeframe Trend Analyzer with Swing Pivots & S/R Levels”
📌 Overview
Trend & Pivot S/R Levels is a multi-timeframe market structure analyzer that identifies trend direction, detects swing highs/lows, and plots higher-timeframe support/resistance levels directly on your chart.
Designed for traders who want fast, clean, and accurate trend context without constantly switching timeframes.
________________________________________________________________________________
✨ Core Features
1. Multi-Timeframe Trend Analyzer .
Analyze up to five higher timeframes simultaneously — for example:
5m, 1H, 4H, 1D, 1W , etc.
For each timeframe, the indicator detects:
a) Trend direction:
🡕 Uptrend;
🡖 Downtrend.
b) Breakouts of recent pivot highs/lows to determine trend shifts.
c) Automatic graying-out of timeframes lower than the current chart TF .
d) A clean visual Trend Panel that shows:
Arrow direction;
Timeframe label (1D, 1W, etc.);
Trend color (bullish, bearish, neutral).
________________________________________________________________________________
2. Swing Pivot Detection (Current TF)
The script detects local swing points using customizable lookback parameters:
a) Pivot Type:
High/Low — classic swing structure;
Close — smoother swing detection using closing prices.
b) Left/Right Bars Lookback — the number of bars required on both sides to validate the pivot.
c) Multiple marker styles :
Built-in plot shapes (circle, cross, histogram, etc.);
Custom visual labels (▲▼, ◉, ✖, 🡇🡅, ◆, ◼, etc.).
This makes it easy to visually confirm that your swing settings are correct.
________________________________________________________________________________
3. Higher-Timeframe Support/Resistance
The indicator automatically draws HTF S/R lines based on the latest pivot highs/lows from each selected timeframe.
Each timeframe has:
Separate Support / Resistance colors ;
Adjustable line width ;
Selectable line style (solid, dashed, dotted, arrows);
Optional HTF labels displayed on the lines.
This allows you to see major market structure levels from higher timeframes without switching charts.
________________________________________________________________________________
4. Smart Timeframe Safety Checks
If a selected timeframe is lower than your current chart timeframe , its data is:
Disabled for S/R plotting ;
Shown in gray inside the Trend Panel;
Prevents invalid S/R calculations and ensures stable chart performance.
________________________________________________________________________________
⚙️ Customization Options :
Show/Hide the Trend Panel;
Panel placement anywhere on the chart;
Swing pivot type: High/Low or Close ;
Pivot lookback (left/right bars);
Choose five HTFs to analyze;
Enable/Disable HTF S/R;
Configure S/R color for each timeframe;
Line style + line width;
Pivot marker type + size;
Custom label styles + text scaling.
________________________________________________________________________________
✅ Benefits :
Perfect for traders who need instant multi-timeframe structure awareness ;
Reduces the need to constantly switch charts;
Works on all markets : crypto, stocks, forex, indices, futures;
Clean, modern, and intuitive visualization;
Helps confirm trend direction and key S/R levels at a glance.
________________________________________________________________________________
⚠️ Note
The indicator only displays S/R and trend data from higher timeframes relative to the current chart timeframe.

Strong PivotsThis finds pivots based on your inputs (number of candles back and forward that are above or below the range of the potential pivot points) and then optionally changes the color to help you visually identify the pivot. You can also specify pivots as strong pivots if they reverse in 1 time segment beyond a certain percentage (wick % of full candle range).
For example, if the pivot is at a high point but has a green body candle and a wick > 35% of the candle, it will change the body color to red to help visually understand that the candle can be considered a strong part of the downtrend, regardless of it closing green. This will help your mind interpret the top pivot candle as part of the potential trend reversal for the following candles and could even be used as part of your strategy ruleset.

Better Pivot Points [LuminoAlgo]Overview
The Better Pivot Points indicator is an advanced trend analysis tool that combines Supertrend methodology with automated pivot point identification and zigzag visualization. This indicator helps traders identify significant price turning points and visualize market structure through dynamic pivot labeling and connecting lines.
How It Works
This indicator utilizes a Supertrend-based algorithm to detect meaningful pivot points in price action. Unlike traditional pivot point indicators that rely on fixed time periods, this tool dynamically identifies pivots based on trend changes, providing more relevant and timely signals.
The algorithm tracks trend changes using ATR-based Supertrend crossovers to determine when significant highs and lows have formed. When a trend reversal is detected, the indicator marks the pivot point and draws connecting lines to visualize price flow and market structure progression.
Key Features
• Dynamic Pivot Detection: Automatically identifies high and low pivot points using Supertrend crossovers
• Market Structure Labeling: Labels pivots as HH (Higher High), LH (Lower High), HL (Higher Low), or LL (Lower Low)
• Zigzag Visualization: Connects pivot points with customizable lines to clearly show price flow and market structure
• Color-Coded Analysis: Uses distinct colors to indicate bullish trends (green), bearish trends (red), and neutral conditions (yellow)
• Customizable Parameters: Adjustable ATR period, factor, line width, and line style
Input Settings
• ATR Length: Controls the sensitivity of the Supertrend calculation (default: 21)
• Factor: Multiplier for the ATR-based Supertrend bands (default: 2.0)
• Zigzag Line Width: Customize the thickness of connecting lines (1-4)
• Zigzag Line Style: Choose between Solid, Dashed, or Dotted line styles
What Makes This Original
This indicator combines several analytical concepts into a cohesive tool that differentiates it from standard pivot point indicators:
1. Uses Supertrend crossovers as the trigger for pivot detection rather than traditional high/low lookback periods
2. Automatically categorizes market structure using HH/LH/HL/LL labeling system based on pivot relationships
3. Provides real-time zigzag visualization with intelligent color coding that reflects trend direction
4. Integrates trend direction analysis with structural pivot identification in a single comprehensive tool
The underlying calculations use custom logic for tracking trend states, validating pivot points, and determining appropriate color coding based on market structure analysis.
How to Use
1. Trend Identification: Green lines indicate bullish market structure, red lines show bearish structure, yellow indicates transitional periods
2. Support/Resistance: Pivot points often act as future support and resistance levels for price action
3. Market Structure Analysis: HH and HL patterns suggest uptrends, while LH and LL patterns indicate downtrends
4. Entry/Exit Planning: Use pivot points and trend changes to plan potential trade entries and exits
Important Limitations and Warnings
• This indicator is a technical analysis tool and should not be used as the sole basis for trading decisions
• Pivot points are identified after price moves occur, meaning this indicator has inherent lag and cannot predict future pivots
• False signals can occur during ranging or choppy market conditions where trends are unclear
• Past performance of any indicator does not guarantee future results or trading success
• The indicator works best in clearly trending markets and may produce less reliable signals in sideways price action
• This tool requires interpretation and should be combined with other forms of analysis
• Always use proper risk management and position sizing strategies when trading
Why This Script Is Protected
This indicator uses proprietary algorithms for pivot detection timing, trend state management, and market structure analysis that represent original research and development. The specific logic for pivot validation, color-coding methodology, and structural relationship calculations contains unique approaches that differentiate it from standard pivot point indicators available in the public library.
Disclaimer
This indicator is for educational and analysis purposes only and does not constitute investment advice. Trading involves substantial risk and is not suitable for all investors. Past results are not indicative of future performance. The future is fundamentally unknowable and past results in no way guarantee future performance. Always conduct your own research and consider your risk tolerance before making any trading decisions.

Polygonal Pivot Bands [FXSMARTLAB]The Polygonal Pivot Bands highlights key price pivots, dynamic support and resistance levels, and recent price action on a trading chart. This indicator connects pivot highs and lows with a zigzag line, extends a real-time dashed line to the latest price point, and plots diagonal support/resistance levels that adapt to price movement. These elements together provide traders with a view of significant price zones and potential trend shifts.
Key Components of the Indicator
Pivots are calculated based on user-defined lengths, specifying how many bars on either side of a high or low are required to validate it as a pivot.
Adjustable left and right pivot lengths allow traders to control the sensitivity of pivot detection, with higher values resulting in fewer, more prominent pivots, and lower values increasing sensitivity to price changes.
Zigzag Line
The zigzag line connects consecutive pivot points, filtering out smaller fluctuations and emphasizing the broader direction of price movement.
Users can customize the line's color and thickness to match their preferences, helping them focus on larger trends and potential reversal points.
By linking pivot highs and lows, the zigzag pattern highlights the overall trend and potential points of reversal.
Real-Time Connector Line
A dashed line extends from the last confirmed pivot to the latest price point, providing a real-time, bar-by-bar update of the current price relative to the previous pivot.
This line does not project future price direction but maintains an up-to-date connection with the current price, showing the distance from the last pivot.
Its color and thickness are customizable for improved visibility on the chart.
Dynamic Support and Resistance Levels
The indicator plots dynamic support and resistanc e levels by connecting recent pivot highs and lows, resulting in lines that may appear diagonal rather than strictly horizontal.
These levels move in line with price action, adapting to the natural direction of trends, and offer visual cues where price may encounter support or resistance.
Colors and thickness of these lines can be set individually, allowing traders to adjust visibility according to their preferences.
Enabling these lines gives traders an ongoing reference for critical price boundaries that align more closely with the overall trend.

Hurst Diamond Notation PivotsThis is a fairly simple indicator for diamond notation of past hi/lo pivot points, a common method in Hurst analysis. The diamonds mark the troughs/peaks of each cycle. They are offset by their lookback and thus will not 'paint' until after they happen so anticipate accordingly. Practically, traders can use the average length of past pivot periods to forecast future pivot periods in time🔮. For example, if the average/dominant number of bars in an 80-bar pivot point period/cycle is 76, then a trader might forecast that the next pivot could occur 76-ish bars after the last confirmed pivot. The numbers/labels on the y-axis display the cycle length used for pivot detection. This indicator doesn't repaint, but it has a lot of lag; Please use it for forecasting instead of entry signals. This indicator scans for new pivots in the form of a rainbow line and circle; once the hi/lo has happened and the lookback has passed then the pivot will be plotted. The rainbow color per wavelength theme seems to be authentic to Hurst (or modern Hurst software) and has been included as a default.

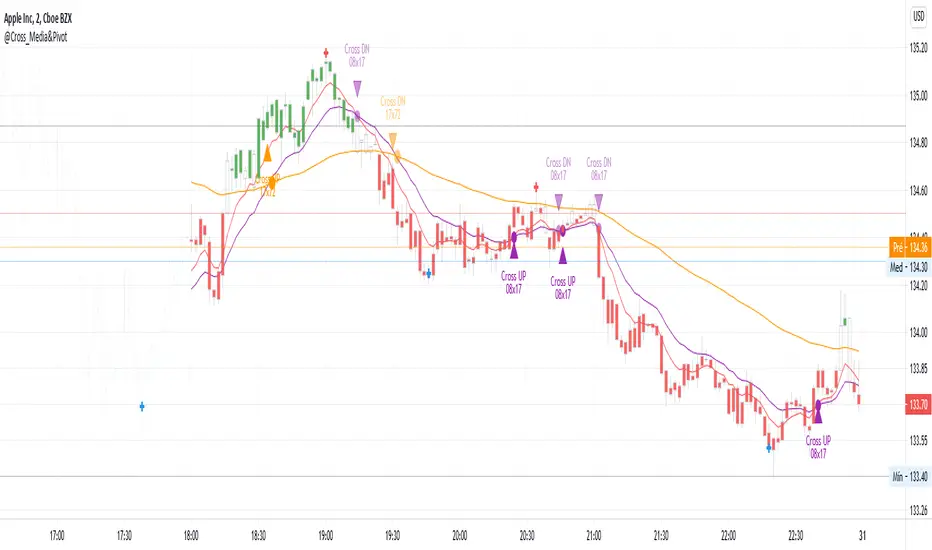
@Cross_Media&Pivot&TRADE_Entry_and_ExitThis script uses the functions plot(), cross(), plotcandle(), pivothigh() and pivotllow(). You can see the candles in the color green, above EMA 72 (Exponetional Move Average), and the color red, below EMA72. You can identify the position of the crossing UP and DOWN of the EMA 08 x EMA 17, EMA 17 x EMA72. You can identify the TRADE ENTRY points with the pivot high and TRADE EXIT with the pivot Low.
Elliott Wave PivotsThis script is designed to catch high timeframe Elliott Wave Pivots. It will label in hindsight and is therefore NOT intended for any entries of any kind. Both labels and lines are drawn once confirmation comes that a wave has completed. You can set alerts to be informed of the completion of that wave.
There are are four degrees of waves recognized. The wave degrees are named minute, minor, major and primary. These do not necessarily reflect an exact timeframe based on the name, rather it reflects the degree of the waves compared to the next. Minute being the lowest degree shown and primary being the highest.
In essence, a minute wave on the indicator will reflect a daily pivot. Each degree higher reflects a higher timeframe pivot that can be used to form an Elliott Wave count. The minute waves can be a bit noisy. View the higher timeframe waves to see structures before narrowing down to the lower timeframes.
To my knowledge, this indicator is unique in it's mission and execution. With that in mind, there can definitely be bugs. Feel free to reach out to me with feedback.

Momentum and Trend Strength Entry Exit Pivot StudyUpdated version of previous Momentum Strength Entry Exit Pivot Study:
//************************
// @TheGeeBee - Credit where used
//
//Notes:
//
// Use 1,2,3,5 minute timeframes
// EMA Cross line and offset allows user to alter the sell characteristics where the candle low is above the EMA line and indicates a possible pre-pivot reversal
// Adjust Min and Max pivots based on risk profile
// Single Candle drawdown value represents the maximum size of a single red candle before an Exit Pivot is generated
// ADX Threshold inhibits Pivots when trending signal is below the threshold value
// Percentage Max drawdown since Entry Pivot allows the system to generate an Exit Pivot if the security has dropped X percent from the most recent Entry Pivot point
// Use Bars, Candles (preferred) or Heikin-Ashi
// Multiple Green Bars = BTFD
// Multiple Red bars = If you didn't already get out, do it now!
//
//************************
Allows for Alerts to be set for Entry and Exit Pivots.
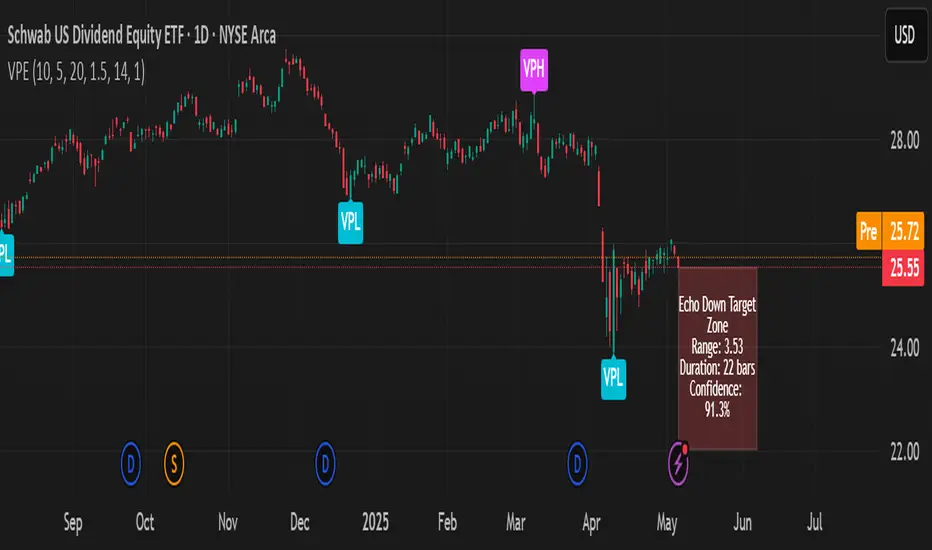
Volumetric Pivot Echo🔮 Volumetric Pivot Echo (VPE)
Future Price Projection Zones with Confidence Scoring
📘 Overview
The Volumetric Pivot Echo (VPE) is a next-generation leading indicator that identifies high-volume reversal points and echoes their price + time behavior into the future — giving you a visual forecast box that includes a confidence score, price range, and duration estimate.
It’s designed for swing and options traders who want forward guidance based on real structure, not just reactive signals.
⚙️ How It Works
Pivot Detection – Finds pivot highs/lows based on configurable bar structure.
Volume Confirmation – Only confirms pivots backed by strong volume (e.g., 1.5× average).
Echo Logic – Measures the price move and time it took to reach the pivot.
ATR Scaling – Adjusts projections based on current market volatility.
Confidence Score – Rates each projection (0–100%) based on structure match, volatility, and direction alignment.
📦 What Appears on Chart
Projection Box:
A forward-drawn rectangle from the current bar to the estimated future zone. The box's size and duration mirror the last valid momentum leg.
Box Label Text:
🔹 Range (projected move size)
⏱️ Duration (bars expected)
✅ Confidence %
VPH/VPL Markers:
Pivot highs and lows confirmed by volume, marked with “VPH” or “VPL”.
🎯 How to Trade with It
Use the box as a target zone for directional trades.
If price enters a box with >85% confidence, consider it a high-quality path projection.
Use with support/resistance confluence or entry systems.
Works especially well for swing trading, breakout setups, or options targeting.
🛠️ Recommended Settings
Box Transparency: Set Projection Up/Down Color to 90 (10% visible).
Text Color: Set to white for readability.
Volume Multiplier: Default 1.5x, increase in choppy markets.
Projection Duration: Start with 1.0x echo multiplier and fine-tune.
⏳ Timeframes & Accuracy
Timeframe Confidence Zones Most Reliable
15m – 1h Use 70–85% confidence scores
1h – 4h Sweet spot for balanced signals
1D – 1W Strongest historical echo tracking (>85% ideal)
✅ Key Features
Forward-looking, non-repainting logic
Clear visual projections — no guesswork
Confidence scoring built-in
ATR-adjusted — adapts to volatility
Works on any asset (stocks, crypto, FX)
🧠 Why It’s Unique
This is not a lagging oscillator or classic trend-following tool.
It’s a leading structure projection model — combining pivot behavior, volume intensity, and market volatility to sketch forward “echo zones” based on the past.
Multi Range VWAP PivotsMulti Range VWAP Pivots turned out to be one of my most accurate pivot indicators to date!
Multi Range VWAP Pivots works by recognizing the high and low of the timeframe selected (D, W, M, 6M, and 12M) and plotting range high to VWAP averages and range low to VWAP averages.
After further examination of each completed range, I came to the conclusion that due to the nature of averages, high and low respectively would need to be completed within the current range, for the averages to actually display pivots correctly. This means that if all averages appear to be "pivoting" correctly after or during a break lower of higher, then we can only assume the most recent break higher or lower could be exhaustion and price will be reverted to the mean (VWAP). OR, this could be the most accurate hindsight indicator on the planet.
*DISCLAIMER*: This indicator repaints. DO NOT backtest or set alerts with this indicator.

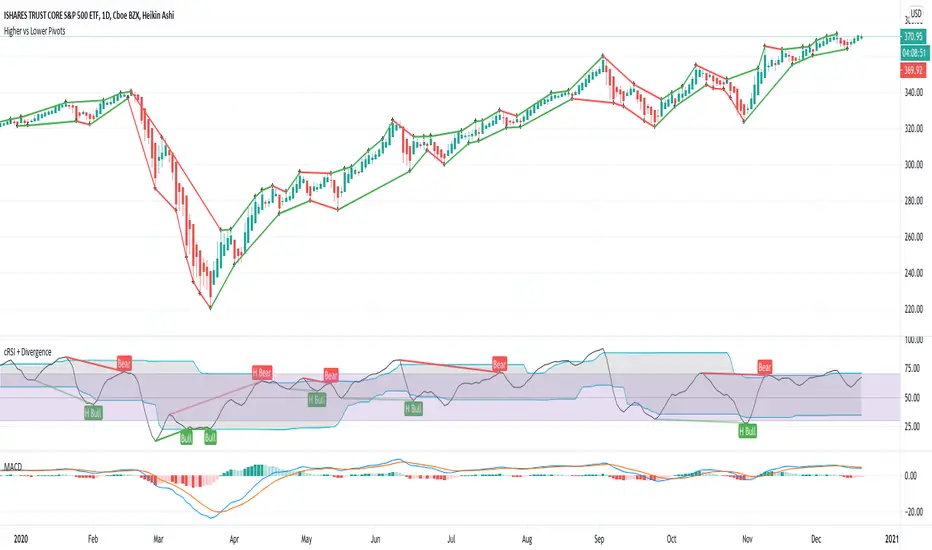
Higher vs Lower Pivots overlayA simple script that I made that draws lines between the high and low pivots. The color of the line define if the pivot is higher or lower than the previous pivot. The main thing to tune is the pivot look back vs look ahead, which are the same params used by the tradingview pivot indicator. There are several other params you can tweaks to get the look you want.
Extended Floor Trader PivotsThe Floor Trader Pivots indicator is a technical indicator that has long been used in the pits of exchanges. They define an equilibrium point called the primary pivot point or central pivot. Through much research, I can find no one to directly credit for establishing the original calculations which are used in this indicator. The original formulas calculate the primary pivot point (PP) and support/resistance levels based off the PP. Most pivot indicators only derive two support/resistance levels (R1, S1, R2, S2). This indicator provides the PP level as well as four additional support/resistance levels (R1-4, S1-4). This indicator also provides standard Open, High, Low, and Close levels. The calculations are as follows:
PP = (High + Low + Close) / 3
R1 = (PP * 2) - Low
S1 = (PP * 2) - High
R2 = (PP - S1) + R1
S2 = PP - (R1 - S1)
R3 = (PP - S2) + R1
S3 = PP - (R2 - S1)
R4 = (PP - S2) + R2
S4 = PP - (R2 - S2)
Pivot levels can be calculated for any time frame. This indicator provides Weekly, Monthly, Quarterly, and Yearly plots at each pivot level (PP - R4/S4).
This indicator can be used for a variety of different trading strategies and is widely used in equity markets, but can also be applied to Forex and Futures markets. It is most often used as profit taking/loss limiting levels as well as identifying possible areas for trend reversals.

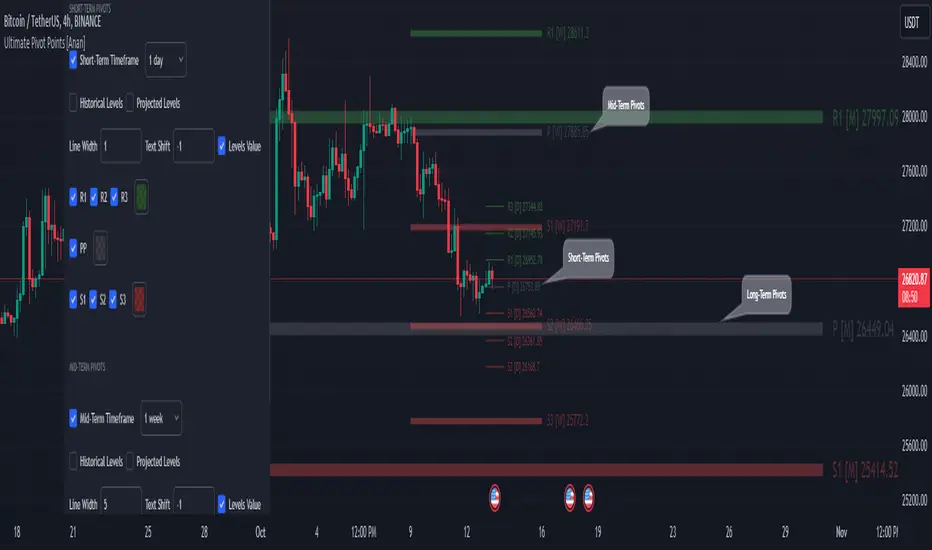
Ultimate Pivot Points [MTF/3in1/4Types/Projection/Alerts]-[Anan]Ultimate Pivot Points !
- V4 Pinescript.
- 4 Types of Pivot Points (Traditional , Fibonacci , Woodie , Camarilla ).
- Multi-time Frame: you can select Pivots Timeframe (1m, 3m ,5m,15m,30m,45m,1h,2h,3h,4h,1D,1W,1M).
- Three Pivot Points in one chart, I called them and they all have option to show or hide.
- Unlimited Number Of Pivots Back for all periods.
- Projection Pivot Points Levels.
- Each Pivot line have a label and value with period .
- Control with Line Width.
- Control with labels location with Text Shift Factor.
- Separate alerts for every Pivot Points levels.
Thanks QuantNomad for the inspiration.
Sri - Pivot + Vital Moving Averages Sri – Pivot + Vital Moving Averages
Sri – Pivot + Vital Moving Averages is an advanced all-in-one indicator that blends trend-following moving averages with multi-timeframe pivot levels (Daily, Weekly, Monthly). It is designed to give traders a complete view of both trend direction and key support/resistance zones, all in a single package.
By combining pivots and moving averages, this tool helps traders quickly identify whether the market is trending or ranging, while also highlighting critical price reaction points that can be used for intraday, swing, or positional trading.
🔹 Moving Averages
50 EMA → medium-term trend filter
200 EMA → long-term trend bias
800 HMA → ultra-smooth trend direction, great for capturing cycles
Daily EMA 200 → higher timeframe trend guide for precision entries
Each moving average is dynamically color-coded to reflect the market bias, making trend changes visually clear and easy to follow.
🔹 Pivot Levels (Daily, Weekly, Monthly)
Auto-calculated pivot, support (S1–S4), and resistance (R1–R4) levels
Balance Zone (BC & TC) highlighted with background shading
Custom colors, visibility toggles, and line thickness options
Dynamic horizontal levels that update with each new session
Ideal for spotting intraday reversals, swing levels, and institutional confluence zones
🔹 Customization & Flexibility
Toggle EMAs, HMA, and each pivot timeframe (Daily/Weekly/Monthly) individually
Full control over colors, transparency, and line styles
Background shading between pivot balance zones for clearer structure
✅ Key Benefits (Pros)
All-in-One Tool → Combines pivots and MAs into one clean package, saving chart space
Multi-Timeframe Edge → View daily, weekly, and monthly pivot levels together for better confluence
Clear Trend Guidance → EMA & HMA color shifts reflect trend changes instantly
Professional Visualization → Background balance zones and structured layouts make levels easy to read
Highly Customizable → Designed to adapt to intraday scalpers, swing traders, and long-term investors alike
⚠️ Things to Keep in Mind (Cons)
Charts may feel visually crowded if all pivots and moving averages are enabled at once
Best used as a confirmation & confluence tool, not as a stand-alone trading strategy
🔥 Recommended Enhancements (For Even Higher Success Rate)
This script already provides a strong edge, but adding the following tools can make it even more powerful:
Volume Confirmation (OBV or VWAP) → Validate pivot/EMA breakouts with volume strength
Momentum Filter (RSI or MACD Histogram) → Confirm directional momentum before acting on pivot touches
Trend Strength (ADX or Supertrend) → Distinguish strong trending phases from weak ranges
Reversal Candlestick Highlight → Automatically mark engulfing candles or pin bars occurring at pivots
These lightweight add-ons integrate well with the existing framework and can improve decision-making without cluttering the chart.
📊 Best Use Cases
Intraday Traders → Use daily pivots with 50/200 EMA for quick scalps and reversals
Swing Traders → Rely on weekly and monthly pivots for confluence with 200 EMA trend bias
Institutional/Positional Traders → Track 800 HMA and higher timeframe EMA 200 for structural guidance
Confluence Hunters → Combine pivot levels with trend bias for high-probability setups

Filter-Out Weak Pivot highs/lows, Swing highs/lows: MethodJust a simple indicator for refining the standard method of finding Pivot highs & Lows; Allowing user to filter-out weak/flat/rounded Pivot highs/lows
-Aim of this is to get pivot highs & pivot lows coded to print more in line with what the eye would naturally be drawn to as an obvious pivot high/low.
-This uses local moving average around the pivot high/low together with user-input ATR multiple, to create a condition for filtering out lacklustre pivot highs/lows.
-Thought i'd publish this separately as a tool that other coders might find useful.
//inputs//
~adjust looback/lookforward for Pivot highs/lows
~adjust 'spikiness' index to filter out less impressive pivot highs/lows (higher number = more selective)
Fibonacci Pivots: last days trade or user defined by irenabyssThis takes the high, low and close from day prior OR Allows the user to set a high, low and close then plots the fibonacci pivot points for the current days trading.
Recommended to use intraday (I use 5 min chart).

Kozlod - Pivot Reversal Strategy Alerts V2Its' new version of previously published Kozlod - Pivot Reversal Strategy Alerts
Indicator now better correspond to original strategy. However, there can be some differences. Problem is that it's pretty tricky to implement in plain PineScript same "stop" logic used in strategy.entry of the original script

Session Dynamics & Pivot Overlay (Arjo)## **OVERVIEW**
The **Session Dynamics & Pivot Overlay (Arjo)** is a visual analysis tool that displays session-based price ranges, anchored volume-weighted averages, daily pivot levels, and smoothed trend conditions on the chart. It highlights how price interacts with custom sessions, midpoint levels, and dynamic ranges, providing a structured visual layout that helps users observe market behavior over time without implying any form of prediction or trading signal.
## **CONCEPTS**
This indicator incorporates several widely used analytical concepts:
- **Session Ranges:** Identifies user-defined time windows and visually displays their high, low, and midpoint behavior throughout the session.
- **VWAP (Morning Session):** Shows volume-weighted average price calculations for a defined morning period, assisting with visual comparison between price and weighted averages.
- **Daily Pivot Levels:** Displays R1–R2, S1–S2, central pivot, and associated levels derived from prior daily price data.
- **Trend Smoothing:** Uses SuperSmoother filtering and an additional EMA to highlight whether the smoothed trend is rising or falling.
- **EMA + ATR Bands:** Plots a 20-period EMA with upper and lower ATR-derived bands to help visualize short-term price displacement relative to average true range.
All of these elements are presented solely for structural and comparative chart analysis.
## **FEATURES**
- **Custom Session Visualization:** Automatically draws session boxes, capturing the evolving high, low, and midpoint throughout the defined intraday window.
- **Dynamic Midline Calculation:** A midpoint line is updated continuously during the session to visually anchor price within the session’s range.
- **Morning Session VWAP:** Displays a dedicated VWAP line for the morning window with adjustable source and configuration options.
- **Daily Pivot Lines:** Automatically plots pivot, BC/TC, R1–R2, and S1–S2 levels with customizable colors, widths, and line styles.
- **Trend-Responsive Pivot Display:** Optionally toggles visibility of R2 or S2 depending on the direction of the smoothed trend.
- **EMA + ATR Zones:** Renders a 20-EMA and ATR-based support/resistance zone using filled regions for enhanced visual clarity.
- **Full Customization:** Multiple color, transparency, line-style, and display options allow users to adapt the presentation to their charting preferences.
- **Overlay Compatible:** Designed to work directly on price charts without obstructing candles or other overlays.
## **HOW TO USE**
Users can interact with the indicator entirely through the settings panel:
- Adjust session timings to match preferred market hours or custom internal zones.
- Enable or disable the display of pivot levels, VWAP, or the ATR/EMA zone.
- Customize colors and line styles to improve visibility according to the chart background or personal preference.
- Observe how price behaves relative to the session box, midpoint, VWAP, and pivot levels for contextual understanding.
- Utilize the smoothed trend condition to see when the indicator chooses to display certain pivot extensions.
These elements help users interpret chart structure, volatility, and intraday behavior in a visually organized manner.
## **CONCLUSION**
The ** Session Dynamics & Pivot Overlay (Arjo) ** indicator offers a consolidated view of session structure, pivot levels, VWAP, and smoothed trend conditions. Its purpose is to improve visual clarity and assist users in understanding market context without issuing directives or trade suggestions. It functions as an educational tool that enhances chart interpretation and supports structured analysis.
---
## **DISCLAIMER**
This indicator is for educational and visual analysis purposes only. It does not provide trading signals, financial advice, or guaranteed outcomes. Users should conduct their own research and consult a licensed financial professional when necessary. All trading decisions are solely the responsibility of the user.
Happy Trading (Arjo)

Magic Equity Trend & PivotsMagic Equity Trend & Pivots is a robust technical analysis engine designed specifically for equity and index traders. It serves as a comprehensive "Trend & Level" companion, combining institutional Pivot Points with a proprietary EMA trend filtering system to identify high-probability setups.
How the Magic Works
This indicator simplifies complex market data into a clear visual workflow:
1. The Magic Equity Trend (Trend Identification) The script uses a weighted system to determine the dominant market direction:
Bullish Trend: Price holds above the primary Trend SMA + a Volatility Buffer (Green Zone).
Bearish Trend: Price is rejected below the Trend SMA - Buffer (Red Zone).
No-Trade Zone: When the price is trapped inside the buffer (Gray Channel), the trend is considered weak or ranging.
2. Institutional Pivot Points Price often reacts at hidden levels. This tool calculates and overlays these levels automatically:
Multi-Type Support: Choose between Traditional, Fibonacci, Woodie, Classic, DM, and Camarilla pivots.
Timeframe Smart-Switching: Use fixed timeframes (e.g., Weekly Pivots on a Daily chart) or let the "Auto" mode decide the best reference period for your current view.
Historical Mode: Unlike standard pivots, these can be back-tested visually to see how prices respected levels in the past.
3. Precision Entry & Exit Logic Trade signals are not random; they are based on a strict confluence of "Magic" factors:
Entry Signal: Requires Trend Alignment + Fast/Slow EMA Crossover + RSI Strength (>60) + Relative Volume Spike.
Top-Up (Add-on): Detects low-risk opportunities to add to a position when price pulls back to the EMA10/20 during a strong trend.
Two-Stage Exit: Secures profits using either an ATR Trailing Stop or an Intraday RSI Breakdown, depending on your settings.
4. Divergence & Momentum
RSI Divergence: Automatically plots Regular Bullish and Bearish divergences to warn of potential reversals at tops or bottoms.
Darvas Boxes: Visualizes consolidation ranges to help identify breakouts.
5. Performance Dashboard A data table provides a snapshot of the asset's health:
Mean Reversion: Measures the % distance from key EMAs (10, 20, 50).
RVOL & ADR: Displays Relative Volume and Average Daily Range to gauge volatility.
Performance Tracker: A theoretical summary table showing how the trend signals have performed over the last 1W, 1M, and 1Y periods.
Settings & Customization
Visuals: Fully customizable colors for the Trend Cloud, Pivots, and Backgrounds.
Filters: Toggle specific filters (Volume, RSI, Trend Buffer) to adapt the sensitivity to different asset classes.
Disclaimer: This tool is for educational purposes and technical analysis assistance only. Past performance displayed in the dashboard does not guarantee future results.

30 Min Pivot Enhanced# 30 Min Pivot Enhanced
The **30 Min Pivot Enhanced** indicator detects pivot reversals and potential buy/sell signals on the 30-minute timeframe. It combines streak-based trend exhaustion with pivot breakouts and optional flush (capitulation) candle detection.
## Core Logic
- Trend streaks: pivots form after consecutive same-color candles (`trendLength`)
- Flush detection: oversized red candles (ATR based) flagged as potential exhaustion
- Pivot candidates:
- Bullish → after a red streak (or flush) followed by a green candle
- Bearish → after a green streak followed by a red candle
- Confirmation: price must break pivot high/low within `maxBarsAfterPivot`
## Inputs
- Consecutive Trend Candles → streak length required for pivot
- Maximum Bars After Pivot → confirmation window
- Show Pivot Lines → toggle pivot levels on chart
- Flush Detection → ATR-based capitulation detection
- Flush Lookback → how many bars to keep flush valid
- Enable Buy/Sell Alerts → toggle trade alerts
## Visuals
- Buy pivots → green "P Buy" labels under price
- Sell pivots → red pivot lines at lows (if enabled)
- Flush markers → optional debug labels showing capitulation bars
## Alerts
- Buy Alert → price breaks above pivot high
- Sell Alert → price breaks below pivot low
---
Best for traders watching **30-minute reversal plays**, especially where exhaustion or flush candles precede a breakout.

Auction S/D Zones (Pivot + Volume + ATR) - S9Trader
Short Summary
Plots high-probability Supply & Demand zones from confirmed pivots, validated by volume and an ATR-impulse filter. Highlights the first retest, supports optional invalidation, and includes touch alerts. Works on any symbol and timeframe.
Script Description
What it does
Detects swing highs/lows (confirmed pivots) and draws Supply (red) / Demand (green) zones.
Confirms potential institutional activity with Volume > SMA × multiplier.
Requires an impulse move at the pivot (range ≥ ATR × multiplier) to avoid weak swings.
Extends zones to the right, highlights the first touch, and can invalidate zones on clean breaks.
Provides alerts when price touches an active zone.
Principles (why it works)
Auction Market Theory: Markets rotate between balance and imbalance; sharp moves often mark “unfair” highs/lows that react on retest.
Supply/Demand Mapping: Swing highs tend to act as Supply on revisit; swing lows as Demand.
Volume Confirmation: Above-average pivot volume suggests non-retail participation.
ATR Impulse: Prioritizes pivots formed by meaningful range expansion, not noise.
How it works (logic)
Pivot detection: ta.pivothigh/low(leftBars, rightBars) confirms a swing after rightBars candles.
Zone construction: Supply = top at pivot high, bottom at max(open, close). Demand = bottom at pivot low, top at min(open, close). Optional minimum % height filter.
Filters: Volume > SMA(Volume, volLen) × volMult AND true range ≥ ATR × impATRmult.
Management: Keeps up to maxZones per side; highlights first retest; invalidates on decisive close through the far edge.
Alerts: Triggers when the current bar intersects any active zone.
Inputs (recommended starting points)
Pivot Left/Right Bars (5/5): Higher = stronger, fewer zones. Intraday: 3–6; Swing: 8–12.
Volume SMA Length (20) & High-Volume Multiplier (1.5–2.0): Higher = stricter.
ATR Length (14) & Impulse Multiplier (1.0–1.5): Higher = stricter.
Min Zone Height % (0.05–0.15%): Skip micro-zones.
Max Zones / Side (5–15): Reduce clutter & stay within object limits.
Invalidate on Break: Remove “proven wrong” zones.
Highlight First Touch: Emphasize the first interaction.
Extend Left: Optional historical context.
How to use (playbook)
Start with context: Identify the higher-timeframe trend/structure.
Prioritize first touch: Reactions are typically strongest on the first revisit.
Seek confluence: Favor zones aligned with trend or near HTF levels, VWAP/MA confluence, or round numbers.
Risk: Place stops just beyond the zone; size so a clean break is tolerable.
Targets: Mid-range, opposite side of the session’s rotation, or next HTF level; trail if momentum persists.
Alerts available
Supply Zone Touch
Demand Zone Touch
Notes & limitations
Pivots confirm only after rightBars candles; zones appear at the confirmed pivot (no instant hindsight).
Order flow/footprint is not available in Pine; bar volume is used as a proxy.
Drawing objects are limited by TradingView; keep maxZones modest on long histories.
Indicator only (not a strategy); backtesting requires a separate strategy script.
Changelog
v1.0.0 — Initial release: pivots + volume + ATR impulse, first-touch highlight, invalidation, alerts, zone caps.
Disclaimer
For educational purposes only. Not financial advice. Trading involves risk—do your own research and manage risk.
Auction S/D Zones (Pivot + Volume + ATR) -S9TraderShort Summary
Plots high-probability Supply & Demand zones from confirmed pivots, validated by volume and an ATR-impulse filter. Highlights the first retest, supports optional invalidation, and includes touch alerts. Works on any symbol and timeframe.
Script Description
What it does
* Detects swing highs/lows (confirmed pivots) and draws Supply (red) / Demand (green) zones.
* Confirms potential institutional activity with Volume > SMA × multiplier.
* Requires an impulse move at the pivot (range ≥ ATR × multiplier) to avoid weak swings.
* Extends zones to the right, highlights the first touch, and can invalidate zones on clean breaks.
* Provides alerts when price touches an active zone.
Principles (why it works)
* Auction Market Theory: Markets rotate between balance and imbalance; sharp moves often mark “unfair” highs/lows that react on retest.
* Supply/Demand Mapping: Swing highs tend to act as Supply on revisit; swing lows as Demand.
* Volume Confirmation: Above-average pivot volume suggests non-retail participation.
* ATR Impulse: Prioritizes pivots formed by meaningful range expansion, not noise.
How it works (logic)
* Pivot detection: `ta.pivothigh/low(leftBars, rightBars)` confirms a swing after rightBars candles.
* Zone construction: Supply = top at pivot high, bottom at max(open, close). Demand = bottom at pivot low, top at min(open, close). Optional minimum % height filter.
* Filters: `Volume > SMA(Volume, volLen) × volMult` AND `true range ≥ ATR × impATRmult`.
* Management: Keeps up to maxZones per side; highlights first retest; invalidates on decisive close through the far edge.
* Alerts: Triggers when the current bar intersects any active zone.
Inputs (recommended starting points)
* Pivot Left/Right Bars (5/5): Higher = stronger, fewer zones. Intraday: 3–6; Swing: 8–12.
* Volume SMA Length (20) & High-Volume Multiplier (1.5–2.0): Higher = stricter.
* ATR Length (14) & Impulse Multiplier (1.0–1.5): Higher = stricter.
* Min Zone Height % (0.05–0.15%): Skip micro-zones.
* Max Zones / Side (5–15): Reduce clutter & stay within object limits.
* Invalidate on Break: Remove “proven wrong” zones.
* Highlight First Touch: Emphasize the first interaction.
* Extend Left: Optional historical context.
How to use (playbook)
* Start with context: Identify the higher-timeframe trend/structure.
* Prioritize first touch: Reactions are typically strongest on the first revisit.
* Seek confluence: Favor zones aligned with trend or near HTF levels, VWAP/MA confluence, or round numbers.
* Risk: Place stops just beyond the zone; size so a clean break is tolerable.
* Targets: Mid-range, opposite side of the session’s rotation, or next HTF level; trail if momentum persists.
Alerts available
* Supply Zone Touch
* Demand Zone Touch
Notes & limitations
* Pivots confirm only after rightBars candles; zones appear at the confirmed pivot (no instant hindsight).
* Order flow/footprint is not available in Pine; bar volume is used as a proxy.
* Drawing objects are limited by TradingView; keep maxZones modest on long histories.
* Indicator only (not a strategy); backtesting requires a separate strategy script.
Changelog
* v1.0.0 — Initial release: pivots + volume + ATR impulse, first-touch highlight, invalidation, alerts, zone caps.
Disclaimer
For educational purposes only. Not financial advice. Trading involves risk—do your own research and manage risk.
